
Abstract
Background
It is important to predict the development of pre-eclampsia (PE) during early pregnancy to prevent its occurrence later on. In this study, we studied urinary biochemical parameters and blood pressure (BP) during and after pregnancy to find useful parameters for predicting PE.
Methods
A case-control study was performed in 25 PE patients and 172 normotensive pregnant women. Twelve biochemical parameters were measured in spot urine, and the systolic and diastolic BPs were measured using an automated device during pregnancy and six to eight weeks after birth.
Results
A multiple logistic regression analysis showed that the combinations of urinary creatinine (Cr) and systolic BP (SBP) in the first trimester of pregnancy (8.9 ± 2.6 weeks), and of urinary inorganic phosphorus (IP)/Cr and SBP in the second trimester of pregnancy (19.0 ± 1.6 weeks) were useful for predicting PE. The area under the curve in the receiver operator characteristic curve of the combination of urinary Cr and SBP in the first trimester was 0.85 (95% confidence interval [CI] 0.74–0.96), and that of the combination of urinary IP/Cr and SBP in the second trimester was 0.91 (95% CI: 0.86–0.97). When used 249 mg/dL in urinary Cr and 128 mmHg in SBP as their cut-off points, the combination in the first trimester increased the accuracy (sensitivity 75% and specificity 95%) in predicting PE, as compared with that of urinary Cr (29%, 99%) or SBP (50%, 98%).
Conclusions
Combination of urinary Cr and SBP in early pregnancy and that of urinary IP/Cr and SBP in mid-pregnancy are useful for the prediction of PE.
Introduction
Hypertensive disorders complicating pregnancy are common. Pre-eclampsia (PE) is estimated to occur in approximately 2–8% of all pregnancies and is an important cause of both maternal and fetal morbidity and mortality. 1–3 Therefore, it is important to predict PE during early pregnancy to prevent its occurrence later in pregnancy or during postpartum period.
Many reports have described the use of urinary biochemical parameters to predict the development of PE, but with controversial results. Among them, decrease in the urinary calcium/creatinine (Ca/Cr) ratio
4–7
and increase in urinary total protein (TP)/Cr,
8,9
microalbumin (Malb)/Cr,
10,11
N-acetyl-β-
Moreover, many reports have described the use of blood pressure (BP) measurements to predict the development of PE. 12–20 Ambulatory BP monitoring (ABPM) for 24 or 48 h in the first trimester of pregnancy has been reported to be useful for predicting the development of PE. 17–20 However, ABPM is not convenient for routine BP measurements. Recently, it was reported that BP measured by patients themselves using an automated device in the examining room (automated office BP) was better than the 24-h ABPM for predicting the risk of future cardiovascular events. 21 Therefore, in this study, we examined automated office BP in women during and after pregnancy.
Materials and methods
Subjects
We examined 431 pregnant women at Minoh City Hospital, but 234 women were excluded from the analysis for the following reasons: 111 women delivered at the other hospitals, 17 women had a miscarriage, 36 women had artificial abortion before 15 weeks' gestation, eight women carrying twins and 62 women with underlying conditions such as gestational proteinuria, renal disease, diabetes, autoimmune disease, chronic hypertension or other chronic medical illnesses.
Clinical characteristics of NTP women and PE patients
Note: Data are presented as mean ± SD NS, not significant; NTP women, normotensive pregnant women (control); PE patients, pregnant patients who developed pre-eclampsia
The study was approved by the medical ethics committee of the Minoh City Hospital, and informed consent was obtained from all subjects.
PE was defined as the development of hypertension and proteinuria (protein excretion of more than 0.3 g/24 h) in the second half of pregnancy. Hypertension was defined as SBP or DBP of at least 140 or 90 mmHg, respectively, observed on at least two occasions at any stage of pregnancy. Proteinuria was defined as the presence of protein in urine as detected by the dipstick method at least twice after 20 weeks of gestation.
PE patients were diagnosed from 34 to 39 weeks of pregnancy, and all patients were admitted into the hospital to keep quiet in bed and were taken a wait-and-see approach without treatment.
Urinary biochemical parameters
Fresh spot urine samples were used for the measurement of urine biochemical parameters to avoid the effects of freezing. 22,23 Urine specific gravity was measured using a fully automated analyser (US-3100R; Eiken Chemical Co, Ltd Tokyo, Japan). Urine concentrations of Cr, Ca, inorganic phosphorus (IP), TP, Malb, β 2-mG, NAG, uric acid (UA), sodium (Na) and potassium (K) were measured with the latest automatic analyser (Biomajesty [BM]-2250; JEOL Co, Ltd Tokyo, Japan).
We derived the following inter-assay coefficients of variation: urinary Cr, 0.4% and 1.3% at concentrations of 86.7 and 202.5 mg/dL; urinary Ca, 0.9% and 1.0% at 12.3 and 25.8 mg/dL; IP, 0.4% and 0.3% at 39.4 and 91.2 mg/dL; TP, 3.8% and 1.4% at 18.2 and 54.8 mg/dL; Malb, 0.8% and 0.7% at 50 and 140 μg/mL; NAG, 0.8% and 0.7% at activities of 15.2 and 103.3 U/L; β 2-mG, 1.4% and 0.7% at 307 and 1536 μg/L; UA, 0.6% and 0.5% at 12.4 and 77.1 mg/dL; Na, 1.1% and 1.2% at 122.4 and 257.3 mmol/L; and K, 1.1% and 1.1% at 27.0 and 41.0 mmol/L.
Automated office BP
Before having their BP measured, the pregnant women rested quietly at least 10 min, alone in the examining room, in order to eliminate the white-coat response seen in an office setting. Automated office BP was carefully measured with patients alone in the sitting position using an automated sphygmomanometer BP-203RV II (Omron-Colin Co, Ltd Tokyo, Japan), and SBP, DBP and the mean arterial pressure (MAP) were recorded. MAP was calculated using the formula: [MAP = DBP + (SBP − DBP)/3].
Statistical analysis
Data were analysed using the statistical program Stat Flex version 6.0 (ARTECH Inc, Osaka, Japan) and presented as means ± SD. Since there was one PE sample that showed outliers in UA/Cr, Na/Cr and K/Cr in the first trimester, we excluded this sample and analysed 24 samples of PE patients in the first trimester. The multiple logistic regression analysis, which is indispensable to compare the utilities of the different test values for this cross-sectional study, was used for all possible prognostic variables to evaluate the measured values of different urinary biochemical parameters and BPs in predicting PE. Contributions of the variables in the models were assessed using maximum likelihood ratio (LR) tests, and only terms that added significantly to the model (P < 0.05) were retained. The area under the curve (AUC) in the receiver operator characteristic (ROC) curve was used to compare the utility of these parameters, yielding values from 0.5 (no predictive power) to 1.0 (perfect prediction). The sensitivity, specificity and LR were used to select the cut-off points for prediction of PE. The cut-off points were decided using maximum-likelihood method. Significance was established at P < 0.05.
Results
Clinical outcomes
The clinical outcomes are shown in Table 1. There was an only significant difference (P = 0.019) between NPT women and PE patients in the newborn weight (g).
Urinary biochemical parameters
Table 2 shows urine biochemical parameters in NTP women and PE patients during and after pregnancy. Only urinary Cr concentration was higher in PE patients than in NTP women in the first trimester of pregnancy. In ROC analysis of urinary Cr in the first trimester of pregnancy, the AUC was 0.77 (95% confidence interval [CI] 0.65–0.89) (Figure 1). The cut-off point, the sensitivity, the specificity and the LR were 249 mg/dL, 29%, 99% and 50.2, respectively.
ROC curves for the diagnosis of PE in the first trimester of pregnancy. The AUC in the ROC of the combination of urinary Cr and SBP-derived multivariate logistic regression analysis is 0.85 (95% CI: 0.74–0.96). Each ROC curve was created using (•) EP, (○) SBP alone, and (×) urinary Cr alone. ROC, receiver operator characteristic; PE, pre-eclampsia; AUC, area under the curve; CI, confidence interval; EP, estimated probability of belonging to the PE group calculated using both SBP and urinary Cr; SBP, systolic blood pressure; Cr, creatinine Urinary biochemical parameters in NTP women and PE patients
Note: Data are presented as mean ± SD NTP women, normotensive pregnant women (control); PE patients, pregnant patients who developed pre-eclampsia *P < 0.05, ***P < 0.001 compared with NTP women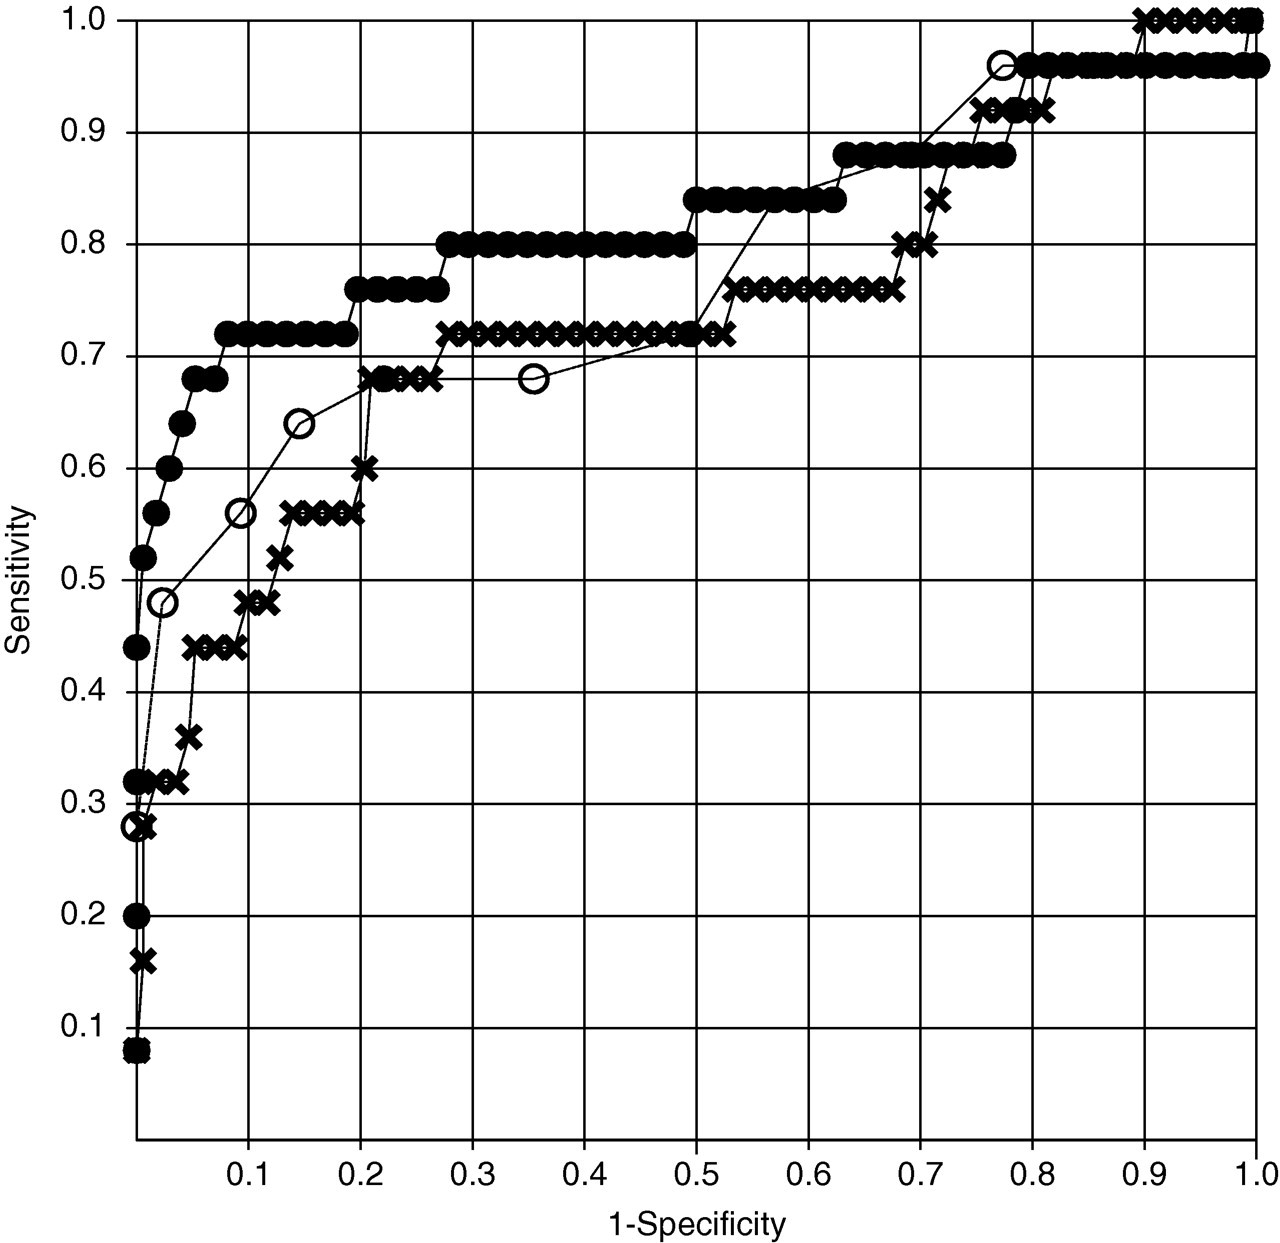
In the second trimester of pregnancy, urinary IP/Cr was lower in PE patients than in NTP women. In ROC analysis of urinary IP/Cr, the AUC were 0.78 (95% CI: 0.69–0.87) (Figure 2a). In the third trimester of pregnancy, TP/Cr and Malb/Cr ratios were higher in PE patients than in NTP. In the postpartum period, a urinary Malb/Cr ratio was higher in PE patients than in NTP women.
ROC curves for the diagnosis of PE in the second (a) and third (b) trimester of pregnancy. The AUCs in the ROC of the combination of urinary IP/Cr and SBP-derived multivariate logistic regression analysis are 0.91 (95% CI: 0.86–0.97) (a) and 0.96 (95% CI: 0.92–1.00) (b), respectively. Each ROC curve was created using (•) EP, (○) SBP alone, and (×) urinary IP/Cr alone. ROC, receiver operator characteristic; PE, pre-eclampsia; AUC, area under the curve; CI, confidence interval; EP, estimated probability of belonging to the PE group calculated using both SBP and urinary IP/Cr; SBP, systolic blood pressure; Cr, creatinine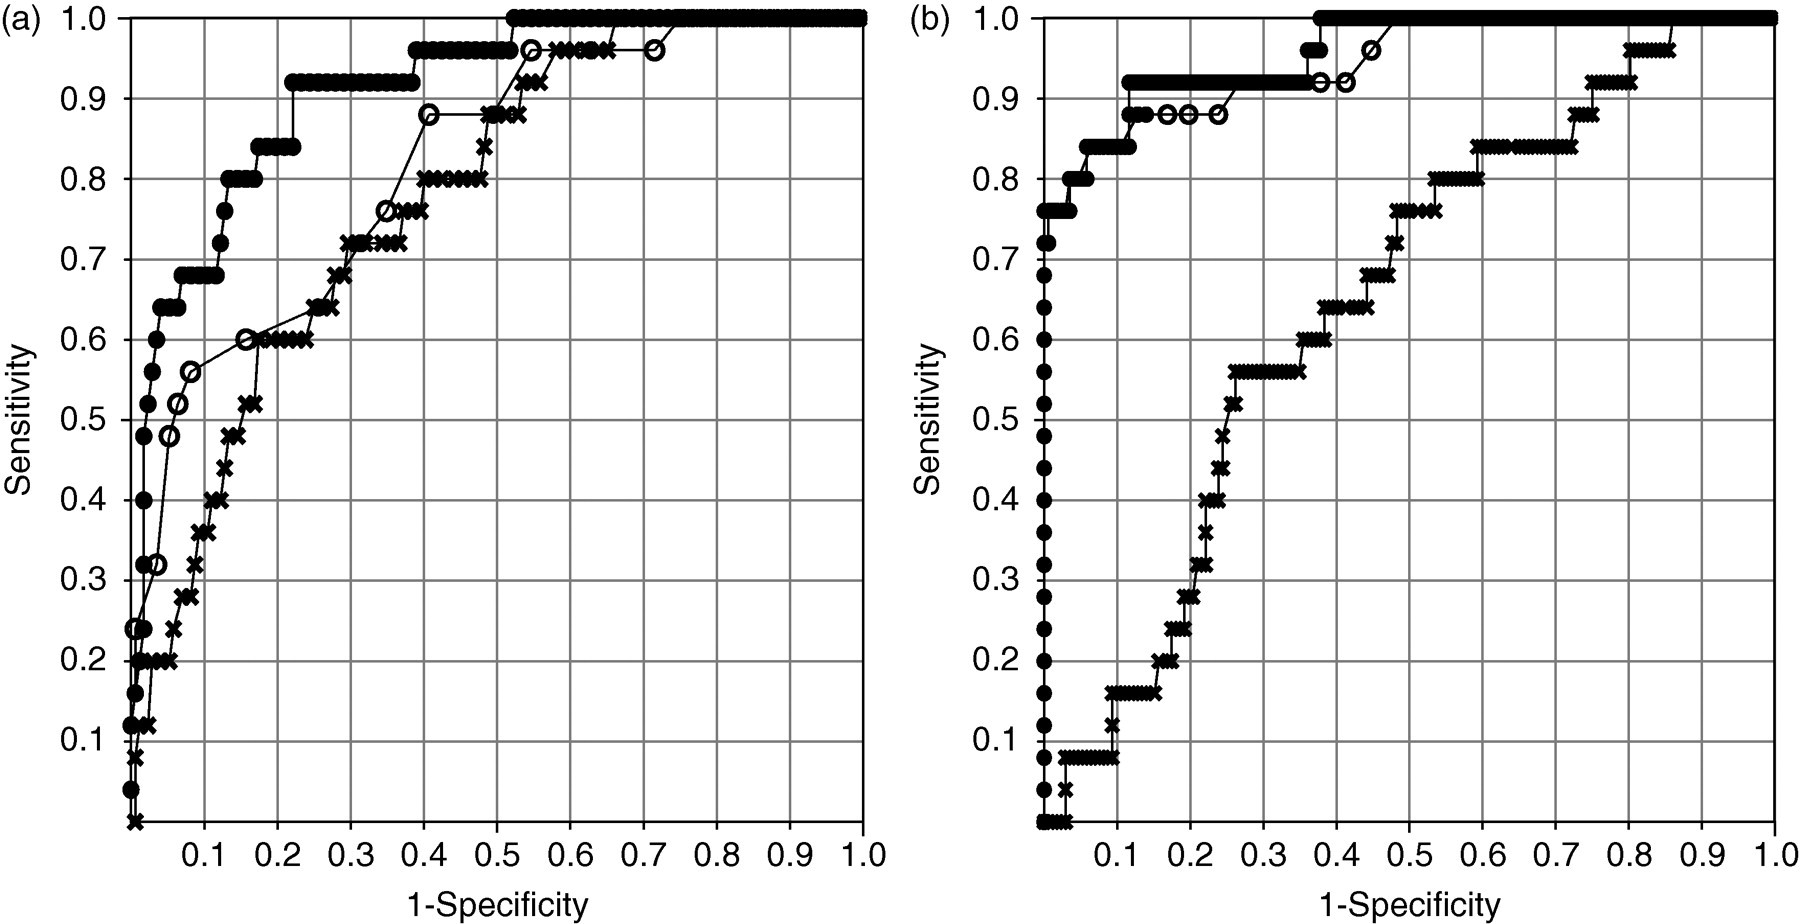
Automated office BP
Office BP in NTP women and PE patients
Note: Data are presented as mean ± SD NTP women, normotensivepregnant women (control); PE patients, pregnant patients who developed pre-eclampsia; SBP, systotic blood pressure; DBP, diastolic blood, pressure; MAP, mean arterial pressure
*P < 0.05, **P < 0.01 and ***P < 0.001 compared with NTP women
Multiple logistic regression analysis
A multiple logistic regression analysis showed that the combinations of urinary Cr and SBP in the first trimester and of urinary IP/Cr and SBP in the second trimester of pregnancy were useful for predicting or diagnosing PE. In the first trimester of pregnancy, the formula used to calculate the estimated probability (EP) of PE was as follows: P = 1/(1 + e −x ), x representing a value based on SBP and urinary Cr: x = −19.045 + 0.1232 (SBP) + 0.01642 (urinary Cr). The SBP and urinary Cr were expressed in mmHg and mg/dL, respectively. The AUC in the ROC curve created using EP was 0.85 (95% CI: 0.74–0.96) (Figure 1). In the second trimester, x = −17.634 + 0.14117 (SBP) − 7.6127 (urinary IP/Cr). The SBP and urinary IP/Cr were expressed in mmHg and corrected value, respectively. The AUC in the ROC created using EP was 0.91 (CI: 0.86–0.97) (Figure 2a). In the third trimester, multiple logistic regression analysis showed that the SBP alone was significant for predicting or diagnosing PE. When we set the critical value of P to 0.10, both SBP and urinary IP/Cr were retained. However, the AUC in the ROC created using EP, which was calculated by SBP and urinary IP/Cr, was 0.96 (95% CI: 0.92–1.00) and did not differ from that created using SBP alone 0.95 (95% CI: 0.90–1.00) (Figure 2b).
Additionally, using the parameters found as independent factors for predicting PE in multiple logistic regression analysis, we performed two-dimensional analysis of urinary Cr and SBP in the first trimester of pregnancy in NTP women and PE patients (Figure 3). When used 249 mg/dL in urinary Cr and 128 mmHg in SBP as their cut-off points, the combination in the first trimester increased the accuracy (sensitivity 75% and specificity 95%) in predicting PE, as compared with that of urinary Cr (29%, 99%) or SBP (50%, 98%).
Two-dimensional analysis using urinary Cr and SBP in the first trimester of pregnancy in NTP women (○) and PE patients (•). PE, pre-eclampsia; SBP, systolic blood pressure; Cr, creatinine; NTP, normotensive pregnant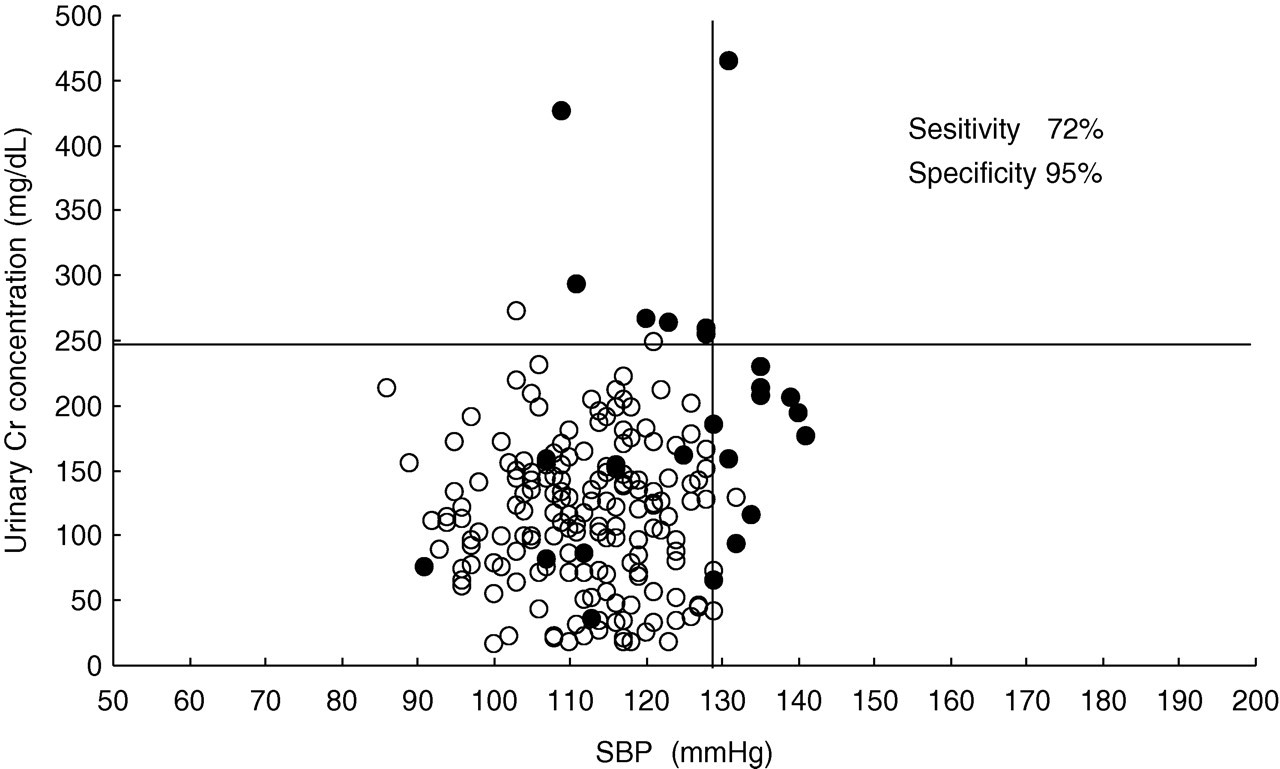
When used 0.468 in urinary IP/Cr and 128 mmHg in SBP as their cut-off points in the second trimester, the combination increased the accuracy (sensitivity 92% and specificity 74%) in predicting PE, as compared with that of urinary IP/Cr (72%, 67%) or SBP (44%, 95%).
Discussion
In evaluating urinary biochemical parameters, we found that only Cr concentration differed significantly in the first trimester of pregnancy. Urinary Cr concentration was higher in PE patients than in NTP women, and this finding was consistent with the results of Izumi et al. 24 Urine was collected at a certain time (between 10:00 and 12:00 h), and Cr concentration in spot urine showed no significant intra- or inter-day variations, 25 and so the Cr concentration in spot urine in the first trimester of pregnancy is considered to be useful for predicting PE. The reason why Cr excretion in spot urine samples increased in the first trimester of pregnancy in patients who develop PE in the second half of pregnancy is unknown. One possible mechanism is concentration of urine in PE patients, and another is increased excretion of Cr and/or creatine in PE patients. It is well known that Cr and creatine are excreted more in urine in pregnancy and that creatine converts easily to Cr in acid solution (pH ≤ 6.0). 26 There is a similar report in another disease, showing the change in Cr concentration in spot urine. 26 However, the relations between these possible mechanisms and the pathogenesis of PE are not clear.
We also found that only urinary IP/Cr ratio was lower in PE patients than in NTP women in the second trimester of pregnancy. This may be explained by the finding that serum vitamin D (1,25-(OH)2D) was lower in PE patients than in normal pregnant women, 27 since vitamin D (1,25-(OH)2D) increases the absorption of Ca and IP from small intestine and their concentrations in serum.
We also found differences in urinary TP/Cr and Malb/Cr ratios in the third trimester, but the third trimester of pregnancy is too late for predicting and preventing the development of PE. Furthermore, several earlier studies on urinary Ca/Cr, 4–7,28–30 TP/Cr, 8,9,30 Malb/Cr 10,11,29,31 NAG/Cr 11,32,33 and β 2-mG/Cr ratios 11,34 in the second or third trimester of pregnancy have produced different results. We did not find significant differences in these biochemical parameters, except for urinary TP/Cr and Malb/Cr ratios.
Although PE is a multisystem disorder, elevated BP is usually the first clinical sign. However, when BP is measured using a mercury sphygmomanometer, it is difficult to differentiate hypertension because of white-coat hypertension. 35,36 However, Hermida et al. 17–20 performed 48-h ABPM and clarified that SBP, DBP and MAP were higher in PE patients than in NTP women in the first trimester of pregnancy. In addition, Hermida et al. 17–20 and other groups 36,37 showed the same results with 24-h ABPM. The latest American Heart Association report mentions that home BP and 24-h ABPM are useful for the evaluation of the BP status of patients, but ABPM may not be convenient for routine BP measurement because it is time-consuming, expensive and uncomfortable for patients.
Recently, automated devices for BP measurement have been developed that enable patients to measure their own BP, while they rest quietly, alone in the examining room. 21 This automated office BP measurement is a major advancement towards the goal of eliminating the white-coat response in an office setting. Furthermore, Myers and Godwin 21 reported that the automated office BP values are better than routine office BP measurements with 24-h ABPM for predicting the risk of future cardiovascular events. Therefore, in this study, we used this automated device that enables pregnant women to measure their own BP while resting quietly in the examining room. We obtained results similar to those of previous reports with 24-h ABPM, 17–20,36,37 in which SBP, DBP and MAP were higher in PE patients than in NTP women in the first trimester of pregnancy. These data indicate that automated office BP measured by patients themselves using an automated device in the first trimester of pregnancy is useful for the prediction of PE.
It is very interesting that urinary Cr and SBP were independent for predicting the development of PE. The reason is unknown, but this means that the combination increases the usefulness for predicting PE as compared with the single application. In fact, the results of multiple logistic regression analysis also indicated that combination of urinary Cr and SBP in the first trimester of pregnancy and that of urinary IP/Cr and SBP in the second trimester of pregnancy were useful for prediction of PE. In the third trimester, the AUC of ROC curve for predicting PE created by SBP alone (0.95) was not different from that created by both SBP and urinary IP/Cr (0.96). It indicated that, in most cases, the PE has developed in the third trimester and it could be clearly predicted using SBP alone.
In conclusion, the combination of urinary Cr and SBP in early pregnancy and the combination of urinary IP/Cr and SBP in mid pregnancy is useful for the prediction of PE.
DECLARATIONS