
Abstract
Background
Previous studies have shown a risk of subsequent major adverse cardiovascular events (MACEs) in patients with suspected acute coronary syndromes (ACSs) and elevated cardiac troponin. The aim of this study was to compare prognostic utility of high-sensitivity troponin with contemporary troponin assays in such patients.
Methods
In total, 332 patients with suspected ACS were investigated between November 2006 and April 2007; all were followed for two years. Blood samples were analysed to compare Roche Elecsys high-sensitivity troponin T (hsTnT), Abbott Architect troponin I 3rd generation (TnI 3) and Roche Elecsys troponin T (TnT), for the prediction of MACE (composite of cardiovascular death, non-fatal myocardial infarction and revascularization).
Results
Sixty-eight patients (20.5%) experienced MACE between discharge and two years. Receiver operating characteristic (ROC) curve derived area under the ROC curve (95% confidence intervals) for baseline hsTnT were 0.70 (0.63–0.76), TnI 3 0.66 (0.59–0.73) and TnT 0.61 (0.53–0.69). hsTnT (P = 0.001) was superior to TnT and TnI 3 trended (P = 0.094) to superiority but were equivalent to each other. hsTnT best stratified patients with cumulative event rates for two-year MACE of 35.6% for levels ≥99th percentile, 17.9% for levels between the limit of detection (LOD) and 99th percentile and 5.4% for levels <LOD compared with TnI 3: 33.0%, 31.1% and 10.9%, respectively. TnT had MACE rates of 36.7% when ≥99th percentile and 15.4% when <99th percentile (=LOD).
Conclusions
hsTnT outperformed contemporary TnI and TnT assays for the prediction of MACE at two years. Those with levels below the LOD for hsTnT identified a group of patients at very low risk for adverse events.
Introduction
Troponin is the major criterion for the diagnosis of non-ST elevation acute myocardial infarction, but previous studies have also shown a relationship between increases in cardiac troponin values in patients with suspected acute coronary syndromes (ACSs) and the risk of subsequent major adverse cardiovascular events (MACEs) including even ‘low level’ increases. 1–7 For example, in the Fast Revascularization during InStability in Coronary disease (FRISC) II subgroup analysis, comparing the results of several troponin T (TnT) and I (TnI) assays measured at an average 37 h post-presentation, 10–12% of patients with adverse events at one-year follow-up were identified only by the troponin assay that had the highest analytical sensitivity. 8
Previously available troponin assays have been unreliable at the lower end of the range, with many assays unable to achieve a 10% coefficient of variation at the 99th percentile of a reference population, as recommended in the 2007 definition of acute myocardial infarction (AMI) 9 resulting in reduced clinical sensitivity of the assay. 10 There has now been development of high-sensitivity troponin assays to increase the analytical, and thus clinical, sensitivity for detection of myocardial injury.
The patients recruited in the FRISC trials were at much higher risk than those typically seen in an emergency department (ED) chest pain cohort and the troponin measurements taken after a delayed time period. The aim of our investigation was to determine whether serial measurement of a high-sensitivity assay for TnT (samples taken at 0 and 6–24 h post-presentation), provided prognostic utility beyond that of contemporary TnT and TnI assays in a cohort of patients presenting to the ED with chest pain, including in those with detectable levels of troponin in the reference range (above the limit of detection, LOD, but below the 99th percentile).
Methods
Details of the methodology for this study can be found in Aldous et al. 11
Patients were followed for two years for adverse events post-discharge from index admission (this study was not aimed at assessing the diagnostic accuracy of the assays and therefore index admission events were not included for analysis of prognostic power) by means of the New Zealand death registry, patient notes review, ‘National Events Search’ and where information was missing, by telephone call to the general practitioner. Events at two years were analysed and the prognostic utility of each assay at baseline and follow-up and were calculated both for overt rises in troponin (≥99th percentile) and for detectable values within the reference range (between LOD and the 99th percentile). The use of a delta troponin (change in troponin value from baseline to follow-up sample) was also analysed.
Adjudication
All outcomes were reported using a predefined structured adjudication process. Patient risk factors and events were largely based on American College of Cardiology (ACC) definitions 2001 12 and the re-definition of AMI in 2007 9 amended to include results of coronary angiography and to contend with patients seen in operational practice (Table 1).
Outcome definitions
Biochemical assays
Please refer to Aldous et al. 11
Statistical analysis
Troponin assay results were compared for their prognostic utility using cut-off points of the 99th percentile and the LOD. Continuous variables are presented as medians (interquartile range) and categorical variables as numbers and percentages. Receiver operating characteristic (ROC) curves were constructed and areas under the ROC curve (AUC) calculated to compare their ability to predict adverse events. The time to event was assessed by Kaplan–Meier survival curves with differences between groups determined by the log-rank test. Hazard ratios (HRs) were determined, and using Cox proportional hazard modelling (with troponin <LOD as reference), were adjusted according to patient characteristics by the forward conditional method and also by index admission MACE. All hypothesis testing was two-tailed and P values of less than 0.05 were considered to indicate statistical significance. All statistical analyses were performed with the use of SPSS for windows (
Results
A total of 332 patients with sufficient sample to measure all assays at both time points were investigated (recruitment is shown in Figure 1 of Aldous et al. 11 ). Baseline characteristics are shown in Table 2. Follow-up data at two years were available for all patients and adverse events are shown in Table 3.
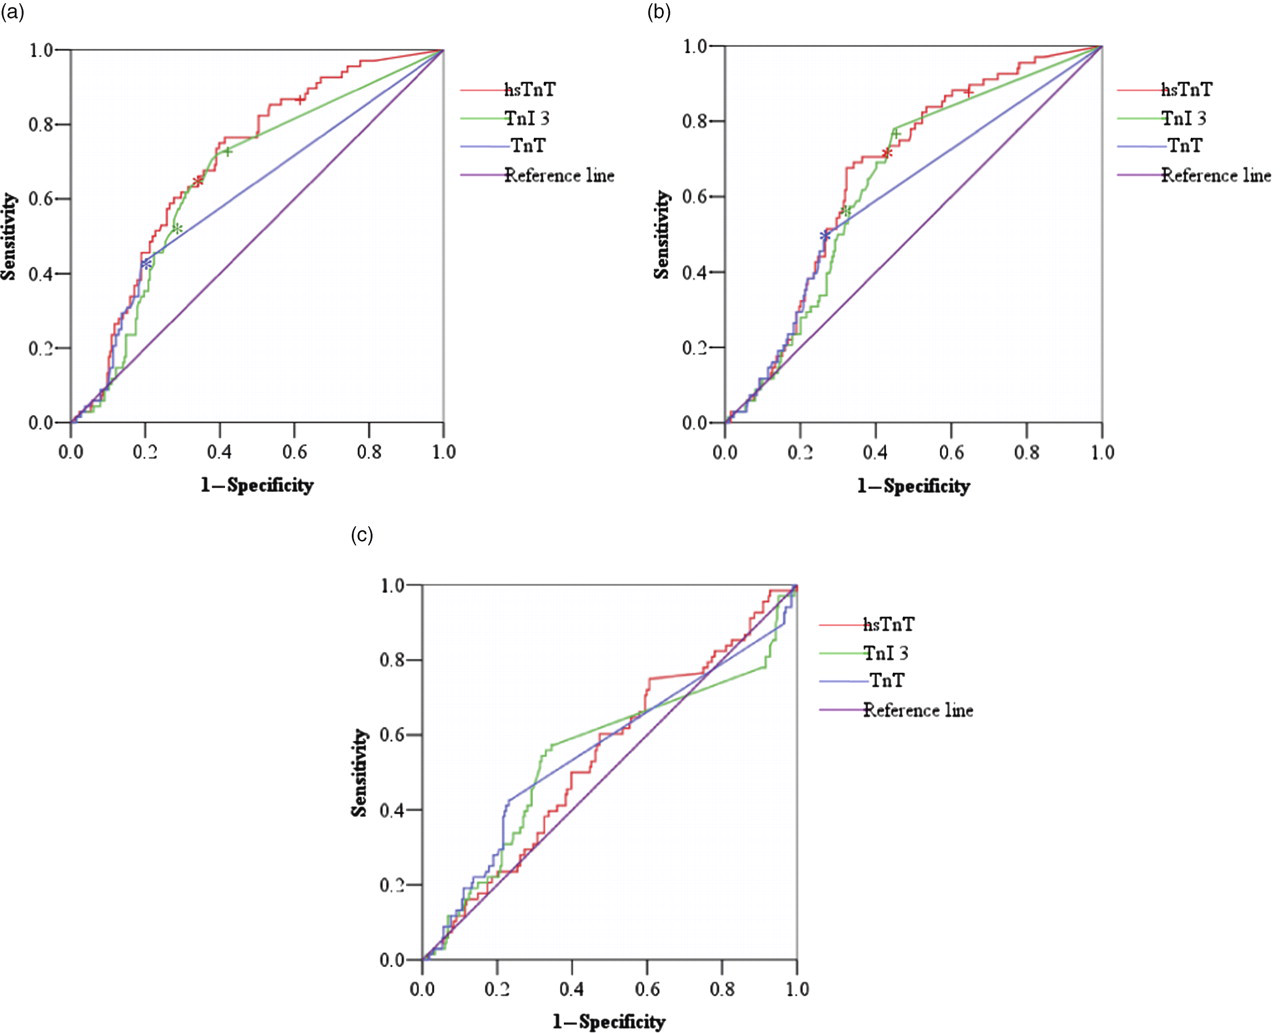
ROC curve analysis comparing prognostic power of troponin assays: (a) baseline troponin, (b) follow-up troponin and (c) delta troponin. ROC, receiver operating characteristic. *99th percentile; + limit of detection (NB 99th percentile and LOD are the same for TnT)
Patient characteristics
MACE, major adverse cardiovascular events; N/A, not applicable
Adverse events at two years
*MACE, major adverse cardiac events – composite of cardiovascular death, non-fatal AMI, revascularization; AMI, acute myocardial infarction
The MACE rate by 30 days was 4.2%. When the 99th percentile was utilized, Roche Elecsys high-sensitivity TnT (hsTnT) identified 11 of the 14 (78.6%) patients experiencing 30-day MACE using the baseline sample and 12 (85.7%) if both samples were used. Abbott Architect TnI third generation (TnI 3) identified 10 (71.4%) and 10 (71.4%) patients and Roche Elecsys TnT 10 (71.4%) and 11 (78.6%) patients, respectively. The MACE rate by two years was 20.5%. hsTnT identified 43 of the 68 (63.2%) patients experiencing two-year MACE using the baseline sample and 47 (69.1%) if both samples were used. TnI 3 identified 34 (50.0%) and 40 (58.8%) patients and TnT 29 (42.6%) and 34 (50.0%) patients, respectively.
There were 124 patients experiencing MACE on admission, with TnI 2 adjudicating the diagnosis of AMI; 41 of these patients went on to have further MACE by two years (37 of whom had raised TnI 2). Of those 41 patients, 34 (82.9%) were identified by hsTnT, 33 (80.5%) by TnI 3 and 30 (73.1%) by TnT. Of those who did not have MACE on index admission (and therefore TnI 2 was <99th percentile), 27 went on to experience MACE; 13 (48.1%) of these TnI 2 negative patients were identified by hsTnT, 6 (22.2%) by TnI 3 and 6 (22.2%) by TnT.
ROC curve analysis
The relationship between troponin concentrations and two-year MACE are shown in Figure 1 and Table 4.
ROC generated AUC of biomarkers for prediction of MACE
ROC, receiver operating characteristics; AUC, area under the curve; CI, confidence intervals; MACE, major adverse cardiovascular events
Baseline troponins had the higher AUCs (although comparison of baseline and follow-up values were not statistically different, P > 0.1 for all) and were therefore used in all subsequent statistical analyses. All troponins predicted MACE. Comparing AUC for two-year MACE, hsTnT out-performed TnT (P = 0.001) and TnI 3 was trending to superiority (P = 0.094), but there was no significant difference between hsTnT and TnI 3. The TnI 2 assay, used for adjudication of AMI on index admission, had an AUC for MACE of 0.65 (0.57–0.72).
AUCs for all adverse events are shown in Table 5. All troponins were statistically predictive of two-year cardiovascular death. hsTnT and TnI 3 were predictive of non-fatal AMI and revascularization but TnT was not significantly different from the line of non-discrimination.
ROC curve generated AUC for all adverse events using baseline troponin
ROC, receiver operating characteristics; AUC, area under the curve; CI, confidence intervals; AMI, acute myocardial infarction
The baseline sample was taken a median of 3.7 h (interquartile range, 1.9–8.0) from symptom onset. The time from baseline sample to follow-up sample was taken a median of 9.4 h (interquartile range 6.3–13.3) from baseline sample. A dynamic change in troponin (% delta) from baseline to follow-up sample for all assays was not significantly different from the line of non-discrimination and therefore had no predictive value (Table 4).
Kaplan–Meier event-free survival analysis
Kaplan–Meier two-year MACE-free survival curves are shown in Figure 2, again demonstrating that all troponins predicted two-year MACE. All troponins also predicted death (P < 0.001 for all), non-fatal AMI (P = 0.001, 0.006 and 0.035 for hsTnT, TnI 3 and TnT, respectively) and revascularization (P = 0.035, 0.010 and 0.006, respectively). Figure 2 also demonstrates how those with troponin concentrations detectable in the reference range in assays with sufficient analytical sensitivity also predict adverse events, particularly for TnI 3, with a more graded event rate for hsTnT. This analysis could not be done for TnT as the LOD and 99th percentile are the same.
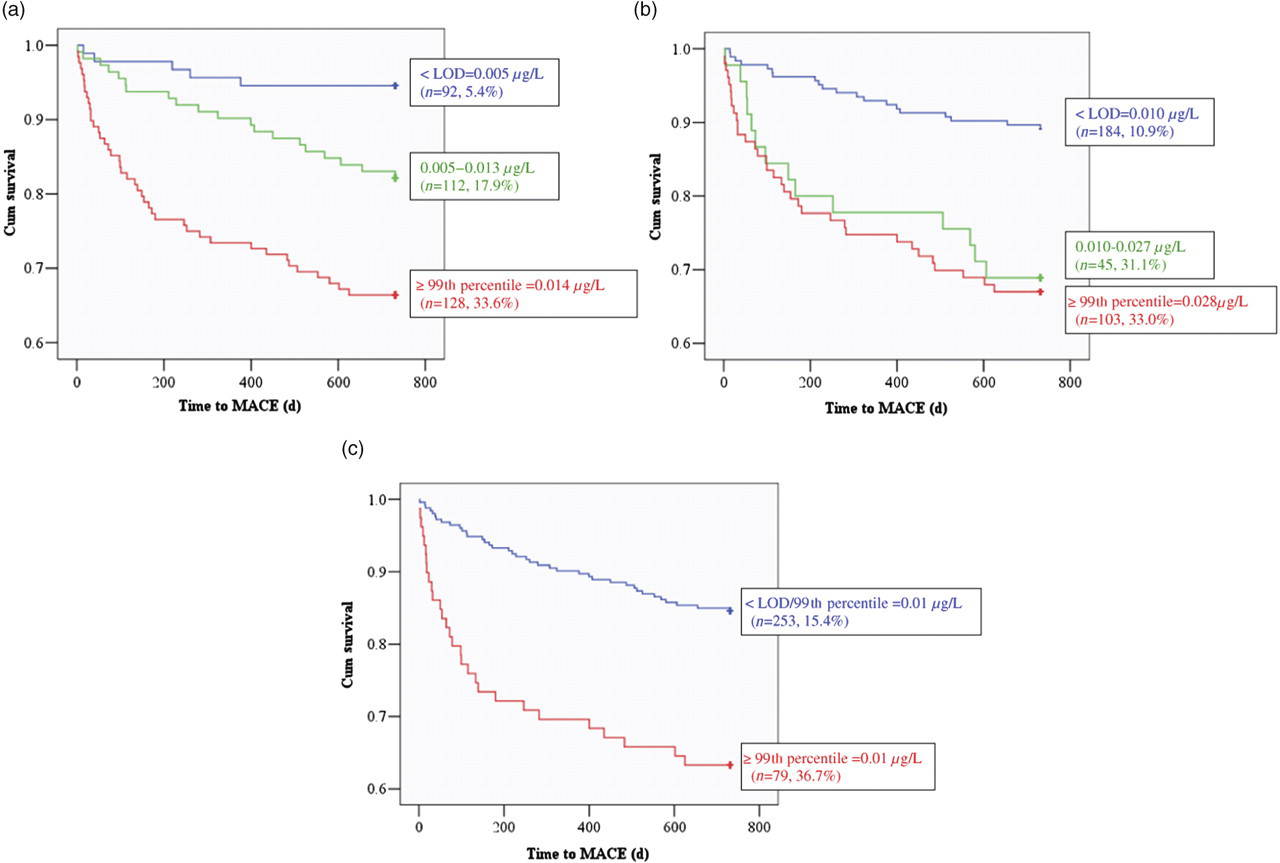
Two-year major adverse cardiovascular event (MACE)-free survival curves: (a) hsTnT (P < 0.001), (b)TnI 3 (P < 0.001) and (c) TnT (P < 0.001)
Cumulative event rates and hazard ratio analysis
Cumulative two-year MACE rates for overt rises (≥99th percentile), detectable levels in the reference range (between LOD and 99th percentile) and undetectable troponin (<LOD) are shown in Table 6 with their respective hazard ratios as adjusted by index admission MACE. hsTnT and TnI 3 conveyed prognostic utility even when adjusted for index admission diagnosis of MACE. TnT was trending to prognostic utility (P = 0.076). The TnI 2 assay, used for adjudication of AMI of index admission, had an HR for follow-up MACE adjusted by index admission MACE of 2.0 (0.8–4.9, P > 0.1). Again the assays were stratified by troponin values showing that even those with detectable levels in the reference range of hsTnT and TnI 3 have prognostic utility. Applying a delta criterion or a rise in troponin of ≥20% to any patient with a peak troponin ≥99th percentile was not predictive of two-year MACE (HR were not raised and P > 0.1 for all). Patients with hsTnT or TnI 3 below the LOD were less likely to have a prior history of ischaemic heart disease than those with levels above the LOD, but all other characteristics were similar.
Cumulative event rates and adjusted hazard ratios for MACE
LOD, limit of detection; MACE, major adverse cardiac events; SE, standard error; N/A, not applicable
*LOD = 99th percentile for TnT
Discussion
We report the utility of the newer hsTnT compared with contemporary troponin assays for evaluation of prognostic utility in patients presenting to the ED with chest pain.
Although there is good data in regard to the prognostic importance of troponin elevations in patients with ischaemic heart disease, 2–5,13–18 the critically ill 18,19 and in outpatient cohorts, 20,21 this is the first report we are aware of to show similar findings in an ED population. These data validate for the first time the fact that even ‘high normal’ values of these higher sensitivity troponin assays are predictive of subsequent cardiovascular events in these patients, consistent with prior data in other settings, 2–5,13–18 indicating a graded relationship between the magnitude of troponin elevations and prognosis.
Troponin ≥99th percentile and prognosis
All the troponin assays under investigation were predictive of MACE, consistent with other studies 4,5,16,17,22 using various cohorts, troponin assays, composite outcomes and follow-up time periods. Because of these study differences, it is difficult to directly compare assays between studies.
Cumulative event rates showed the clear prognostic utility of hsTnT above TnI 3 as well as TnT, although ROC curve analysis only showed superiority over TnT. This may have resulted from an under-powering in sample size. In addition, despite a troponin assay (TnI 2) being used in adjudicating admission AMI, contributing to the admission adjudication of MACE, all assays identified patients that went on to experience MACE in the follow-up period that were not identified by the original TnI 2 assay, with the most additional patients being identified by hsTnT. Statistical analysis confirmed that this prognostic utility was significant for hsTnT and TnI 3, suggesting that assays with high analytical sensitivity best predict adverse events long term.
Few studies have compared higher sensitivity assays with contemporary troponin assays and these have shown only modest differences. For example, Keller et al. 21 found that the Siemens Troponin I ultra above the 99th percentile had an adjusted HR of 1.96 versus a standard TnT result above the 99th percentile of 1.91 for 30-day composite of death, myocardial infarction, stroke or hospital admission because of cardiovascular reasons or need for unplanned percutaneous coronary intervention within one month after index event. Prior studies have mainly focused on short-term outcomes, and certainly the number of events in our patients in the short term (data not shown) was small, making differences between assays difficult to extrapolate. We therefore focused on long-term outcomes. In comparison with a study by Kavsak et al., 15 which did have long-term follow-up, adjusted HR for composite of two-year death and non-fatal AMI were 4.37 for Beckmann Coulter AccuTnI and 4.32 for Beckmann Coulter hsTnI using the 99th percentile cut-off point, which is higher than that found in the current study for TnI 3 or TnT but lower than that found for hsTnT. It is probable that the signal for short-term events is large, but for longer-term outcomes, smaller changes in troponin are more likely to have long-term significance and therefore the assays that are more sensitive in detecting troponin at the lower end of the range appear to have an advantage, as shown in this study.
Delta troponin and prognosis
The use of a delta troponin, shown to improve specificity for the diagnosis of AMI, 17 in patients with a delta or rise in troponin of ≥20% and a peak troponin concentration ≥99th percentile, did not provide useful prognostic information for long-term follow-up. However, as there were variable time intervals from presentation to baseline sample and variable intervals from baseline to follow-up sample, the degree of apparent change in troponin values may be underestimated. Also, a recent study by Vasile et al. has shown that the level at which a delta in hsTnT exceeds the biological and analytical variation was 84% for short-term changes (between 0 and 4 h). This suggests that many patients achieving a 20% delta do so because of biological and/or analytical variation and not because of myocardial damage, which would reduce the test performance of a delta criterion. 23 Nevertheless, despite such potential limitations, these data imply that a delta troponin is unlikely to be a helpful strategy for identifying those at risk of long-term adverse events as suggested by Kavsak et al. 24 who also looked at long-term prognosis, confirming that an acute change in troponin did not appear to be prognostically informative. Conversely, Apple et al. 17 found that adding the criterion of an increase in troponin of >30% improved risk stratification for cardiac events or death in the short term.
Troponin <99th percentile and prognosis
Minor rises in troponin have been shown to predict adverse events. In this study, even those with detectable levels in the reference range of both hsTnT and TnI 3 were predictive of two-year MACE and hsTnT was superior at stratifying risk. Apple et al. 4 calculated 60-day event rates of 11.1% (relative risk 3.9) in this group compared with 2.8% in those with no detectable troponin and 42% (relative risk 8.9) in those with troponin over the 99th percentile. However, Apple and Kavsak et al. both found that detectable levels in the reference range did not predict adverse events with statistical significance, unlike this study which showed clear prognostic utility. 15,17 Because high-sensitivity assays detect values within the reference range (and because of the relationship between the magnitude of elevations and prognosis), these detectable but normal values only begin to manifest their predictive importance long term. More research is required to better understand these findings and the intervention necessary for such patients.
The key benefit of using a high-sensitivity assay here seems not only that those with elevations in hsTnT ≥99th percentile have an increased risk and to a lesser degree, those with detectable levels in the reference range, but that those without detectable hsTnT have extremely low risk for adverse events. Therefore, measurement of hsTnT could be used as a ‘rule out’ tool to identify those at low risk of adverse events and this could perhaps supplant other more expensive investigations such as provocative testing. Venge et al. 22 showed that when using a high-sensitivity TnI assay, there were many patients experiencing death or AMI by one year not identified by using a cut-off of the 99th percentile, but no patient with values below the median of normal healthy population experienced these outcomes, again demonstrating the high negative predictive value of these lower cut-offs. However, with the current expert opinion suggesting that an assay cannot be defined as high sensitivity unless at least 95% of healthy individuals have measurable troponin, 22,25 the cut-off value to identify lower-risk patients needs to be validated as the number of patients with values <LOD become fewer. In addition, the endpoints used in this study do not include unstable angina or recurrent chest pain which are an important cause of morbidity; hsTnT may not be as proficient at stratification if such factors were included.
Conclusions
hsTnT outperformed contemporary TnI and TnT assays for the prediction of adverse cardiovascular events up to two years, in patients presenting to the ED with chest pain. Patients with detectable values within the reference range for hsTnT and TnI 3 were also found to be prognostically important and more particularly, those with levels below the LOD identified a group of patients at very low risk for adverse events. Delta troponins were not shown to be useful.
Limitations
In addition to the limitations already described, this is a relatively high-risk population with index admission ACS rates higher than that seen in our institution from audit data (with ACS rates of approximately 30–35%), suggesting a selection bias, although baseline characteristics and two-year MACE rates (approximately 20% in our institution) are similar. This may, however, introduce a spectrum bias leading to an overestimation of overall test performance. This possibility should be taken into consideration if applying our findings to a lower risk population. The timing of follow-up samples was highly variable although this would be consistent with operational practice. The assay used to define non-fatal AMI changed from TnI 2 to TnI 3 during the follow-up period.
DECLARATIONS