
Abstract
Aim
To describe differences in biochemistry test request rates (adjusted for practice size) between general practices and to investigate whether differences in HbA1c and thyroid function test request rates are related either to the practice prevalence of hypothyroidism and diabetes or to Quality and Outcome Framework (QOF) scores.
Methods
Information on test request rates, prevalence of diabetes and hypothyroidism, and QOF data over a one-year period were obtained from 58 practices covering a population of 284,609 patients. Spearman's rank correlation tests were used to investigate relationships between adjusted test request rates.
Results
There was wide variability in adjusted test request rates (lowest for HbA1c and highest for immunoglobulins). The ranking of practices for different tests was highly correlated. There was no relationship between adjusted test request rates for HbA1c and thyroid function and the reported prevalence of diabetes and hypothyroidism, respectively, nor was there any relationship with QOF scores in diabetes and hypothyroidism.
Conclusions
There is wide variability in test request rates in general practice that do not appear to be related to disease prevalence or crude clinical outcome measures.
Background
The use of laboratory tests has increased significantly in the UK over the last 10 y. 1,2 This increase has occurred in requests from both secondary and primary care. National initiatives in the UK such as the introduction in 2004 of the new General Medical Services (nGMS) contract are thought to have had an impact on test increases in primary care. 3 The nGMS contract through the Quality and Outcome Frameworks (QOF) offers incentives for the achievement of defined targets in the management of a range of common chronic diseases. 4 Such targets include maintaining a register of patients with certain conditions (e.g. diabetes mellitus and hypothyroidism), performance of relevant monitoring blood tests at a specified frequency (e.g. HbA1c and thyroid function) and the attainment of treatment targets in a defined proportion of patients.
In parallel with these developments, there has been increased availability of clinical management guidelines for a range of chronic conditions including diabetes and thyroid disease, both of which require laboratory testing for diagnosis and monitoring. 5–7 In theory at least, the availability of such guidelines should promote harmonization and reduce variability in practice by health-care teams. Despite this however, there is good evidence of wide variation in test requesting practice. 8–11 The reasons for this are not clear but appear unrelated to the demographic or socioeconomic characteristics of the practices and more probably reflect variations in the clinical practice of individuals or health-care teams. 9 It is unclear to what extent such variation is related to clinical outcomes, i.e. whether health-care teams which test more frequently have higher rates of disease detection or better disease management.
The aims of the current study were twofold: firstly, to define variability of primary care test requesting in a N. Ireland Health and Social Care Trust catchment area for a range of commonly request clinical biochemistry tests; secondly, to study the test requesting patterns for two specific conditions (diabetes mellitus and thyroid disease) and their relationship to QOF clinical indicator scores in hypothyroidism and diabetes.
Methods
This study took place in the Western Health and Social Services Board Area in N. Ireland. Information on practice size lists and prevalence of diabetes mellitus and hypothyroidism was obtained from the Family Practitioner Unit of the Western Health and Social Services Board. QOF scores for individual practices were obtained from the N. Ireland Department of Health website. 4
Information on the total number of requests made by individual practices was obtained from the laboratory databases of the Altnagelvin (Londonderry), Tyrone County (Omagh) and Erne (Enniskillen) hospitals for the following clinical biochemistry tests/test groups: electrolyte profile, liver profile, lipid profile, thyroid profile (FT4 and TSH), HbA1c (measured using a Diabetes Control and Complications Trial aligned assay), urine albumin/creatinine (ACR) ratio, prostate-specific antigen (PSA) and immunoglobulins. 12 This information was reviewed from the period 1 June 2007 to 31 March 2008. A common clinical chemistry request form (optical mark readable) was used by all three laboratories. All the above tests/profiles (with the exception of ACR and immunoglobulins) are listed on the form and are requested by marking a box adjacent to the test required. In contrast, requests for ACR and immunoglobulin are made by writing out the test name in a separate area of the request form.
Test request rates were adjusted for the total number of patients in each practice and expressed as tests per 1000 patients (adjusted request rate), with the exception of HbA1c for which requesting rates were expressed as tests per 1000 patients with diabetes. To explore the relationship between request rates for different tests within and between practices, Spearman's rank correlation was used. The adjusted electrolyte request rate was arbitrarily chosen as the comparator as it was the single most commonly requested test.
Interpractice variability in test requests was expressed by an ‘index of variability’ calculated as the top decile divided by the bottom decile of adjusted test request rates. Spearman's rank correlation was performed to test the relationship between adjusted requesting rates and the prevalence of diabetes and hypothyroidism and QOF clinical indicator scores.
Results
Information was obtained on 58 separate general practices comprising a total of 284,609 patients. For some practices based in multipractice health centres it was not possible to obtain accurate information on test request numbers specific to those particular practices (e.g. the request was recorded on the laboratory information system by the name of the health centre rather than the individual practices within the health centre). In such cases, the data for individual practices within the health centre were amalgamated to give a health centre output. This resulted in data being available for 49 units (i.e. 45 individual practices and 4 health centres comprising 5, 4, 2 and 2 practices). Data involving QOF clinical indicator scores were computed only for the 45 practices on which test request data were available.
There was large between-practice variability for all tests studied (Table 1). The index of variability was lowest for HbA1c at 2.8 and highest for immunoglobulins at 19.8.
Between-practice variability in test request rates
ACR, albumin/creatinine ratio; PSA, prostate-specific antigen
*Index of variability calculated as the top decile divided by the bottom decile of adjusted test request rates
The ranking of practices for adjusted request rates for different tests was studied using Spearman's rank correlation (Figure 1). When analysed against adjusted electrolyte requests as the comparator there were strong correlations found with the adjusted request rates for each of liver profile, lipid profile, thyroid profile, PSA (Figure 1) but not for immunoglobulins (r value = 0.3 [confidence interval −0.03 to 0.58]) or ACR (r value = 0.23 [confidence interval −0.06 to 0.49]).
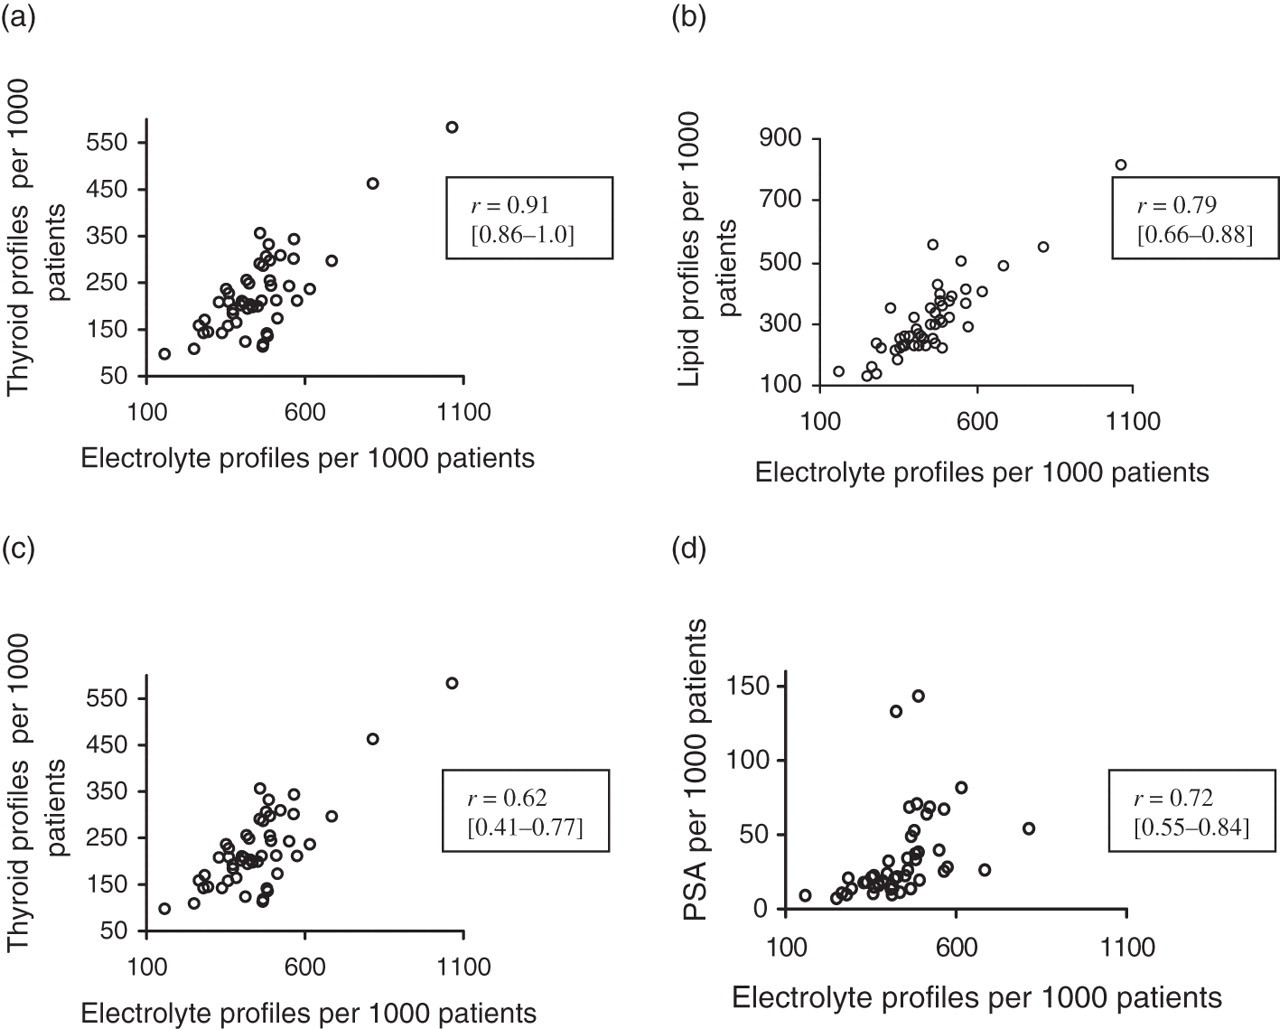
Scatter graphs of practice standardized requests for liver profiles (a), lipid profiles (b), thyroid profiles (c) and prostate-specific antigen, PSA (d) plotted against standardized electrolyte profile requests with Spearman's rank correlation coefficients (confidence interval)
The reported prevalence of diabetes in the practices varied from 1.75% to 5.1%, (mean 3.31%). The median number of HbA1c requests per patient with diabetes was 1.8 (Table 1). All practices attained maximum QOF points under clinical indicator DM 5 (‘The percentage of diabetic patients who have a record of HbA1c or equivalent in the previous 15 months’). All but seven practices attained the maximum 11 points available under DM 7 (‘The percentage of patients with diabetes in whom the last HbA1c is 10% or less’), range 8–11. All but three practices attained the maximum 17 points available under DM 20 (‘The percentage of patients in whom the last HbA1c is 7.5% or less’). There was no correlation between the number of HbA1c tests performed and the proportion of patients in the practice with an HbA1c < 7.5% (r 2 = 0.022).
The reported prevalence of hypothyroidism varied from 1.60% to 5.8% (mean 2.98%). There was no correlation between the prevalence of hypothyroidism and the adjusted thyroid profile request rate (r 2 = 0.04). All practices achieved the maximum one point available under QOF clinical indicator Thyroid 1 (‘The practice can produce a register of patients with hypothyroidism’) and all but one practice attained the maximum seven points available under QOF clinical indicator Thyroid 2 (‘The percentage of patients with hypothyroidism with thyroid function tests recorded in the previous 15 months’).
Discussion
This study found significant differences in adjusted test request rates between practices with an index of variability that ranged from 2.8 for HbA1c to 19.8 for immunoglobulins (Table 1). Furthermore, the ranking of individual practices in adjusted test request rates were highly correlated for electrolyte, liver, lipid and thyroid profiles and PSA, suggesting that some practices are ‘high requestors’ and others ‘low requestors’. The high correlations found may reflect in part the design of the laboratory request form in which all of the above tests are specifically listed. The finding of high levels of variability between practices is in keeping with previous research both in the UK and elsewhere. 9–11
We investigated whether variation in requesting might be associated with differences in disease detection and clinical outcomes. We chose to study diabetes and hypothyroidism for two reasons. Firstly, the relevant tests (HbA1c and thyroid function tests) are specific to these conditions, i.e. they have no role in the management or diagnosis of any other condition unlike tests such as electrolytes or lipids which may be appropriate in a range of clinical settings. Secondly, there are widely available clinical guidelines relating to the diagnosis and management of diabetes and hypothyroidism and which in particular advise on the appropriate frequency of biochemical testing. 5–7
HbA1c is a test that is used exclusively for the monitoring of diabetes mellitus. Although more recently it has been proposed as having a role in the diagnosis of diabetes, at the time of data collection it was not advocated as a diagnostic test in the UK. 13 It provides a measure of glycaemic control over a three-month time window and guidelines suggest that it should be measured at least twice per year in patients with stable glycaemia and up to four times per year in patients where therapy has changed or who are not meeting glycaemic targets. 6 The relevant QOF clinical indicator is less demanding: ‘The percentage of diabetic patients who have a record of HbA1c or equivalent in the last 15 months’ (DM 5). 4 In view of the explicit guidelines on testing frequency it is perhaps unsurprising that HbA1c had the lowest index of variability of all the tests studied.
The median number of HbA1c measurements performed per patient with diabetes was 1.75 (range 0.9–3.4) and well within the QOF target (a measurement within the previous 15 months) but for the majority of practices the reported figure is less than the more demanding guideline target of two measurements per year (for patients with stable glycaemia). 4,6 It is possible that a proportion of patients with diabetes were attending hospital diabetes clinics, i.e. were logged as having diabetes in the practice register but having HbA1c measured at the hospital clinic and the results of the latter communicated to the GP. The number of HbA1c measurements per patient with diabetes may therefore be an underestimate.
There was no link between the number of HbA1c measurements performed per patient with diabetes and QOF Indicator DM 20: ‘The percentage of patients in whom the last HbA1c is 7.5% or less (or equivalent test/reference range depending on local laboratory) in the last 15 months’. 4 The relationship between the frequency of HbA1c measurement and glycaemic control is likely to be complex and this finding is therefore difficult to interpret. Patients with satisfactory and stable glycaemic control may be tested less frequently, whereas those with unsatisfactory glycaemic control and who are undergoing intensification of therapy may be tested more frequently. However, the fact that the great majority of practices attained maximum points for the QOF clinical indicators DM 7 (‘The percentage of patients with diabetes in whom the last HbA1c is 10% or less’) and DM 20 (‘The percentage of patients in whom the last HbA1c is 7.5% or less’) suggests that management of glycaemia was generally very good. 4 There is therefore no reason to believe that there were major differences between practices in the level of glycaemic control of their patients that might explain a 2.8-fold variability in HbA1c testing.
Thyroid disease is common (estimated prevalence of 0.5% to 2.0% for both hypo- and hyperthyroidism), generally of insidious onset and may present with a range of non-specific symptoms and signs. 7,14 It is therefore unsurprising that thyroid testing (for both diagnostic and monitoring purposes) is commonly performed, with an estimated 10 million thyroid function tests performed per year in the UK in 2003. 15 Hypothyroidism (but not hyperthyroidism) is listed in the QOF framework. The QOF clinical indicator requires that ‘The practice can produce a register of patients with hypothyroidism’ (Thyroid 1). 4 For hypothyroidism it is recommended that thyroid tests should be checked at least once per year as part of long-term follow-up. 7 The relevant QOF clinical indicator captures: ‘The percentage of patients with hypothyroidism with thyroid function tests recorded in the previous 15 months’ (Thyroid 2). 4
Since QOF captures data only on hypothyroidism, it is unclear what proportion of thyroid function tests was requested for the diagnosis and monitoring of hyperthyroidism.
Although there was a surprisingly large variation in the reported prevalence rates of hypothyroidism between practices (mean 2.98%; range 1.6–5.8), no correlation was detected between the prevalence of hypothyroidism and thyroid function test request rates. A relationship might have been expected, firstly, because a lower threshold for testing (and therefore more frequent testing) might have resulted in an increased detection rate and secondly, a higher prevalence would be associated with an increase in subsequent monitoring tests. Given that almost all practices attained maximum points for the two QOF thyroid clinical indicators, variability in testing did not appear to be linked to outcomes.
The results of this study suggest that there may be considerable potential for the rationalization of test ordering to minimize variation and so improve the consistency, efficiency and cost-effectiveness of patient investigation and monitoring. Approaches to ensuring more appropriate testing might include: guideline dissemination and education, electronic order systems with decision support and embedded retest interval rules, request vetting by the laboratory, feedback to users on their requesting rates and tests costs. Although a detailed appraisal is beyond the scope of this paper, it is worth noting that the implementation of demand management initiatives has often proved challenging and yielded variable success. 16,17
In summary, we found a wide variability in test request rates between practices that appear unrelated to disease prevalence or crude clinical outcome indicators. This suggests that despite the availability of good-quality clinical guidelines, there is still wide variation in testing practice that appears unrelated to clinical need or outcomes and may reflect instead differences in behaviour by individual clinicians when managing similar clinical problems
DECLARATIONS