
Abstract
Background
Arterial blood gas analysis (ABGA) is a useful test that estimates the acid–base status of patients. However, numerically reported test results make rapid interpretation difficult. To overcome this problem, we have developed an algorithm that automatically interprets ABGA results, and assessed the validity of this algorithm for applications in clinical laboratory services.
Methods
The algorithm was developed based on well-established guidelines using three test results (pH, PaCO2 and [HCO3 −]) as variables. Ninety-nine ABGA test results were analysed by the algorithm. The algorithm's interpretations and the interpretations of two representative web-based ABGA interpretation programs were compared with those of two experienced clinicians.
Results
The concordance rates between the interpretations of each of the two clinicians and the algorithm were 91.9% and 97.0%, respectively. The web-based programs could not issue definitive interpretations in 15.2% and 25.3% of cases, respectively, but the algorithm issued definitive interpretations in all cases. Of the 10 cases that invoked disagreement among interpretations by the algorithm and the two clinicians, half were interpreted as compensated acid–base disorders by the algorithm but were assessed as normal by at least one of the two clinicians. In no case did the algorithm indicate a normal condition that the clinicians assessed as an abnormal condition.
Conclusions
The interpretations of the algorithm showed a higher concordance rate with those of experienced clinicians than did two web-based programs. The algorithm sensitively detected acid–base disorders. The algorithm may be adopted by the clinical laboratory services to provide rapid and definitive interpretations of test results.
Introduction
Arterial blood gas analysis (ABGA) is a test that can assess a patient's acid–base status, oxygenation status and ventilatory status, and is used as a useful emergency test by clinicians. 1–4 According to the ABGA result, a patient's acid–base status is classified according to one of the following four categories: metabolic acidosis, metabolic alkalosis, respiratory acidosis and respiratory alkalosis. In many cases, however, a patient's acid–base status cannot be precisely classified into only one of the aforementioned four categories. Instead, test results may fall into a combination of two or more types of acid–base condition, and even one acid–base disturbance can present a broad range of test results, depending on the extent of compensation. Thus, interpretation of the ABGA results depends heavily on the judgement of experienced clinicians. Currently, most clinical laboratories report only numeric values for the ABGA results, and clinicians who are not specialists have difficulty interpreting the results and appropriately assessing a patient's status for pertinent therapeutic action. Several web-based programs have been developed to help interpret the results of ABGA tests. The currently available programs were designed to allow a detailed interpretation by the introduction of categories that reflect the extent of compensation for the four existing categories. 5–7 The web-based programs for interpreting ABGA test results, however, frequently fail to interpret mixed or compensated acid–base disorders. In addition, their application in the context of hospital information systems (HISs) is difficult. Thus, it is difficult to apply web-based interpretation assistance in clinical laboratories. Given this, an algorithm for the automatic interpretation of ABGA results would be useful for managing patients because it allows for the prompt and accurate interpretation of test results. In this context, the authors have developed an algorithm for the automatic interpretation of ABGA results by compensating for the shortcomings of existing web-based programs designed for the same purpose. We have assessed the validity of the algorithm by applying it to the interpretation of test results from clinical specimens.
Materials and methods
Development of an algorithm for the automatic interpretation of ABGA
Three values (pH, PaCO2 and [HCO3 −]) were used as inputs in the algorithm, and the literature guidelines were used as reference during development of the algorithm. 1–4,8 The algorithm was designed so that it would interpret ABGA results into 13 types of acid–base statuses: partially compensated or uncompensated forms of metabolic acidosis, metabolic alkalosis, respiratory acidosis, respiratory alkalosis, combined metabolic and respiratory acidosis, combined metabolic and respiratory alkalosis, compensated respiratory acidosis or metabolic alkalosis, compensated respiratory alkalosis or metabolic acidosis and normal acid–base status. The reference ranges for pH, PaCO2 and [HCO3 −] were defined as 7.35–7.45, 4.7–6.0 kPa and 22–26 mmol/L, respectively, as described in the literature (Figure 1).
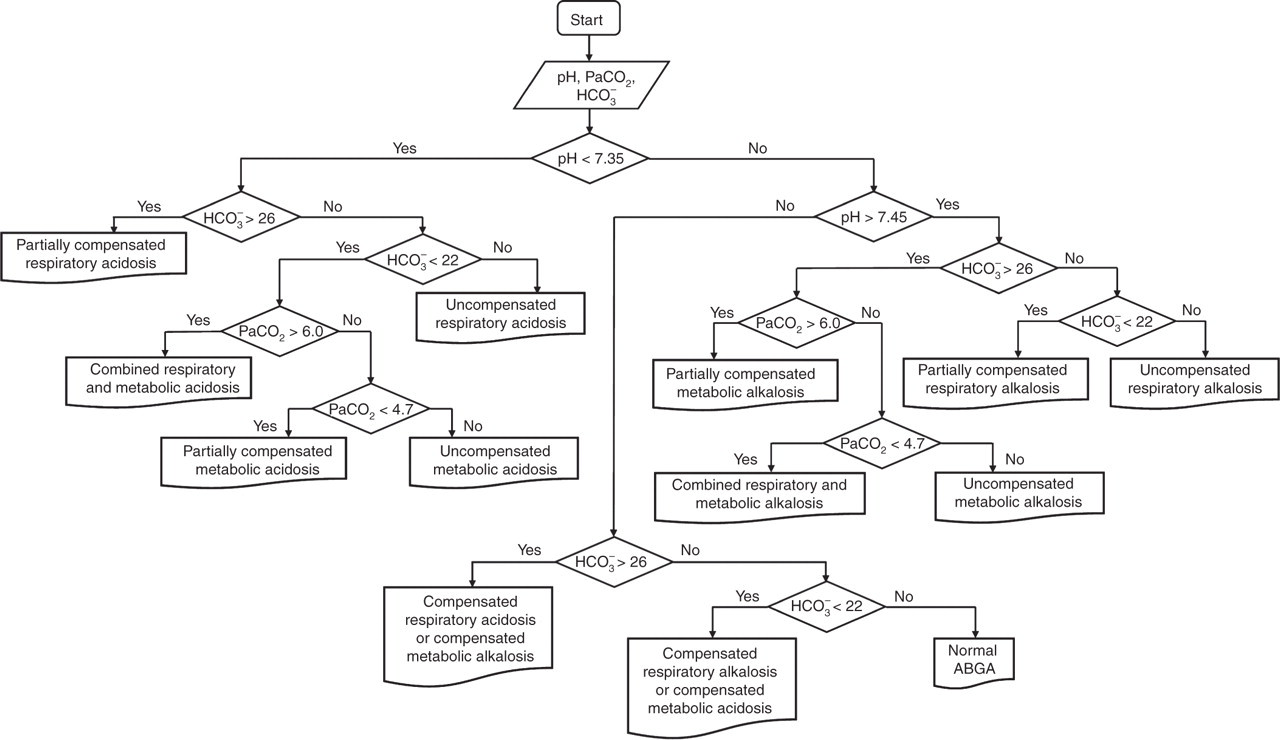
Algorithm for the automatic interpretation of ABGA test results (PaCO2 in kPa and HCO3 − in mmol/L)
Assessment of the developed algorithm for the automatic interpretation of ABGA results
Ninety-nine ABGA test results were randomly selected and analysed. Two experienced clinicians, who were on the board of internal medicine with six postgraduate years of experiences and were working as clinical fellows, were asked to interpret the results. Their subspecialties were pulmonology and nephrology. The 99 results were interpreted by the algorithm described here and by the two representative web-based programs designed for the interpretation of ABGA results. The web-based programs tested here were the Altitude (
Results
Comparison of the interpretations by the two clinicians
Of the total 99 ABGA test results, 89 (89.9%) coincided (concordance), six (6.1%) partially coincided (partial concordance) and four (4.0%) did not coincide (discordance) with the interpretations by the clinicians. Of the six ABGA test results that were found to be in partial concordance, two were interpreted as normal or compensated acid–base disorders by one clinician and as compensated acid–base disorders by the other clinician; one was interpreted as a normal or compensated acid–base disorder by one clinician and as a normal condition by the other clinician; two were interpreted as combined acid–base disorders by one clinician and as single uncompensated acid–base disorders by the other clinician; and one was interpreted as a combination of a partially compensated acid–base disorder and an uncompensated acid–base disorder by one clinician and as a single uncompensated acid–base disorder by the other clinician. The four ABGA test results that were found to be in discordance with the interpretations of the clinicians were interpreted as compensated acid–base disorders by one clinician and as normal by the other clinician (Table 1).
Cases in which the interpretations of the two experienced clinicians showed discrepancies
PC, partial concordance; DC, discordance
Assessment of the interpretations by the developed algorithm and by the web-based programs for ABGA interpretation in comparison with the interpretations of the two clinicians
The interpretations made by the proposed algorithm coincided with clinician A's interpretation in 91 (91.9%) of the total 99 ABGA test results. The interpretations made by Altitude and Manuelsweb coincided with clinician A's interpretation in 56 (56.6%) and 76 (76.7%) cases, respectively. The interpretations made by the proposed algorithm coincided with clinician B's interpretation in 96 cases (97.0%) out of the total 99 ABGA test results, whereas those made by Altitude and Manuelsweb coincided with clinician B's interpretation in 56 (56.6%) and 72 (72.7%) cases, respectively. Taken together, the interpretations by the proposed algorithm showed the highest concordance rates of 91.9% and 97.0% with the interpretations of clinicians A and B, respectively, followed by Altitude (56.6% and 56.6%, respectively) and Manuelsweb (72.7% and 76.7%, respectively). Among the 89 ABGA test results for which the two clinicians' interpretations were concordant, the interpretation by the proposed algorithm was also concordant with the clinicians' interpretation. In contrast, the interpretations by Altitude and Manuelsweb showed discordance with those of the clinicians in 24 (27.0%) and 10 (11.2%) cases, respectively. Of the interpretations by Altitude that did not coincide with the clinicians' interpretations, 80.6% (25/31) and 84.0% (25/29) were due to failure in interpretation (mild derangement). Of the interpretations by Manuelsweb that did not agree with the clinicians' interpretations, 78.9% (15/19) and 88.2% (15/17) were due to failure in interpretation (unable to determine) (Table 2).
Comparison of interpretations of a total of 99 ABGA results by the algorithm, the web-based Altitude program and the web-based Manuelsweb ABGA interpretation program with those made by two experienced clinicians
Analysis of the cases in which the clinicians' interpretations did not agree with the interpretation of the developed algorithm
Ten ABGA test results prompted clinicians' interpretations that did not coincide with the interpretation of the proposed algorithm. Two of the 10 ABGA test results were interpreted as compensated acid–base disorders by the proposed algorithm, as normal or compensated acid–base disorders by one clinician (partial concordance) or as compensated acid–base disorders by the other clinician (concordance). One of the 10 ABGA test results was interpreted as normal by the proposed algorithm, as normal or compensated acid–base disorder by one clinician (partial concordance) and as normal by the other clinician (concordance). One of the 10 ABGA test results was interpreted as an uncompensated respiratory acid–base disorder by the proposed algorithm, as a combined acid–base disorder by one clinician (partial concordance) and as an uncompensated metabolic acid–base disorder (discordance) by the other clinician. Two of the 10 ABGA test results were interpreted as uncompensated acid–base disorders by the proposed algorithm, as uncompensated acid–base disorders by one clinician (concordance) and as combined acid–base disorders by the other clinician (partial concordance). Lastly, four of the ABGA test results were interpreted as compensated acid–base disorders by the proposed algorithm, as normal by one clinician (discordance) and as compensated acid–base disorders by the other clinician (concordance). Taken together, seven of the 10 ABGA test results produced interpretations that were not concordant due to a disagreement in interpretation of a condition as normal or compensated acid–base disorder and three of the 10 ABGA test results produced interpretations that were not concordant due to a disagreement in interpretation of a condition consisting of combined or uncompensated acid–base disorder (Table 3).
Cases in which discrepancies arose between the interpretations by the algorithm and two experienced clinicians
PC, partial concordance; DC, discordance; Co, concordance
Discussion
The components of an ABGA test include pH, PaCO2, PO2, [HCO3 −], base excess and oxygen saturation, all of which are reported as numeric values. Clinicians interpret ABGA results with consideration for a variety of overarching factors, such as the patient's clinical history and ventilator use. Guidelines for interpreting ABGA results have been described in many studies. 2,3,9,10 In general, the conditions mainly responsible for a change in pH are defined as the primary disorder. If the primary disorder is metabolic, the expected value of PaCO2 is calculated, and if the primary disorder is respiratory, the expected value of [HCO3 −] is calculated to evaluate the degree of compensation offered by the respiratory system or the kidney. 3 There are no uniform guidelines, however, for interpreting ABGA results, and some studies have even suggested pH as the criterion for evaluating the degree of compensation. 2,9,10 Thus, interpretation of ABGA results is time consuming and difficult, requiring interpretation by experienced clinicians.
Web-based programs for interpreting ABGA results employ a simple categorization approach that applies existing interpretation guidelines. First, the programs determine the primary disorder by assessing the factor that more strongly affects pH: PaCO2 or [HCO3 −]. Subsequently, the web-based algorithms assess the degree of compensation by examining the changes in PaCO2 or [HCO3 −] that would be required to move towards normalizing the pH. If the pH falls within the reference range, it is categorized as completely compensated; a pH in an abnormal range, even with changes towards normalization, is categorized as partially compensated. Web-based programs are designed such that they cannot definitively identify combined or compensated ABGA results. Therefore, many results are interpreted as ‘unable to determine’ or ‘mild derangement’. The use of existing web-based programs for the interpretation of ABGA results in clinical practice may produce confusion due to failures in interpretation. 5–7,11
To compensate for this shortcoming, the authors designed an algorithm in which changes in [HCO3 −] and PaCO2 towards a normal acid–base status are interpreted as a combined acid–base disorder. As such, the algorithm showed higher concordance rates (91.9%, 97.0%) with each of the two clinicians' interpretations than did two representative web-based programs, Altitude and Manuelsweb. These programs showed, respectively, 56.6%, 56.6% and 72.7%, 76.7% concordance rates with clinicians A and B. In addition, the proposed algorithm produced clear interpretations in all cases, whereas the web-based programs produced frequent discordance with the interpretations of the clinicians due to failures in interpretation.
In this study, two clinicians participated in the interpretation to provide an accepted standard of comparison, and the interpretations of the two clinicians showed an 89.9% concordance rate. Of the 10 ABGA test results for which the interpretations of the two clinicians were not in concordance, seven disagreements were due to different interpretations of the normal status or the compensated acid–base disorder. If we consider that the pH values fell within the reference range, the interpretations of the aforementioned seven ABGA test results can be considered clinically concordant. Thus, only three ABGA test results had interpretations that were not clinically concordant; in these cases, one clinician interpreted the measured values as a combined acid–base disorder and the other clinician interpreted the values as an uncompensated acid–base disorder (partial concordance). Excluding these three ABGA test results, the clinical concordance rate of the interpretations by the two clinicians can be considered as 97.0%. The three cases that incurred different interpretations constituted partial concordance because the interpretations differed only partially. Therefore, the interpretations by the two clinicians were in good concordance, indicating that the evaluation of the developed algorithm was appropriate.
Given the high concordance rate of the interpretations by the two clinicians, the interpretations drawn by the proposed algorithm and those drawn by the two clinicians were compared, and 89/99 (89.9%) results were perfectly matched. Of the 10 ABGA test results that produced differing interpretations by the two clinicians and by the developed algorithm, seven ABGA test results differed by interpretation of a normal status or a compensated acid–base disorder, and three ABGA test results differed by interpretation of a combined or an uncompensated acid–base disorder. Even with these results, the acidosis/alkalosis status was accurately assessed. As for those 10 results, the developed algorithm did not fail to detect acid–base disturbances and was more sensitive to detecting acid–base disturbances in that it yielded a small set of false-positive results and no false-negative results. Thus, the high sensitivity of the algorithm developed for detecting acid–base disorders did not compromise the evaluation of the baseline acid–base status of a patient. In addition, given the slight difference in clinical significance between the normal acid–base status and the compensated acid–base status, the algorithm can be modified to comprehensively cover almost the full range of compensated acid–base disturbances by modifying the definitions of compensated acid–base disorder and normal status. This modification is expected to enhance the convenience associated with application of this algorithm to clinical practice (Figure 2).
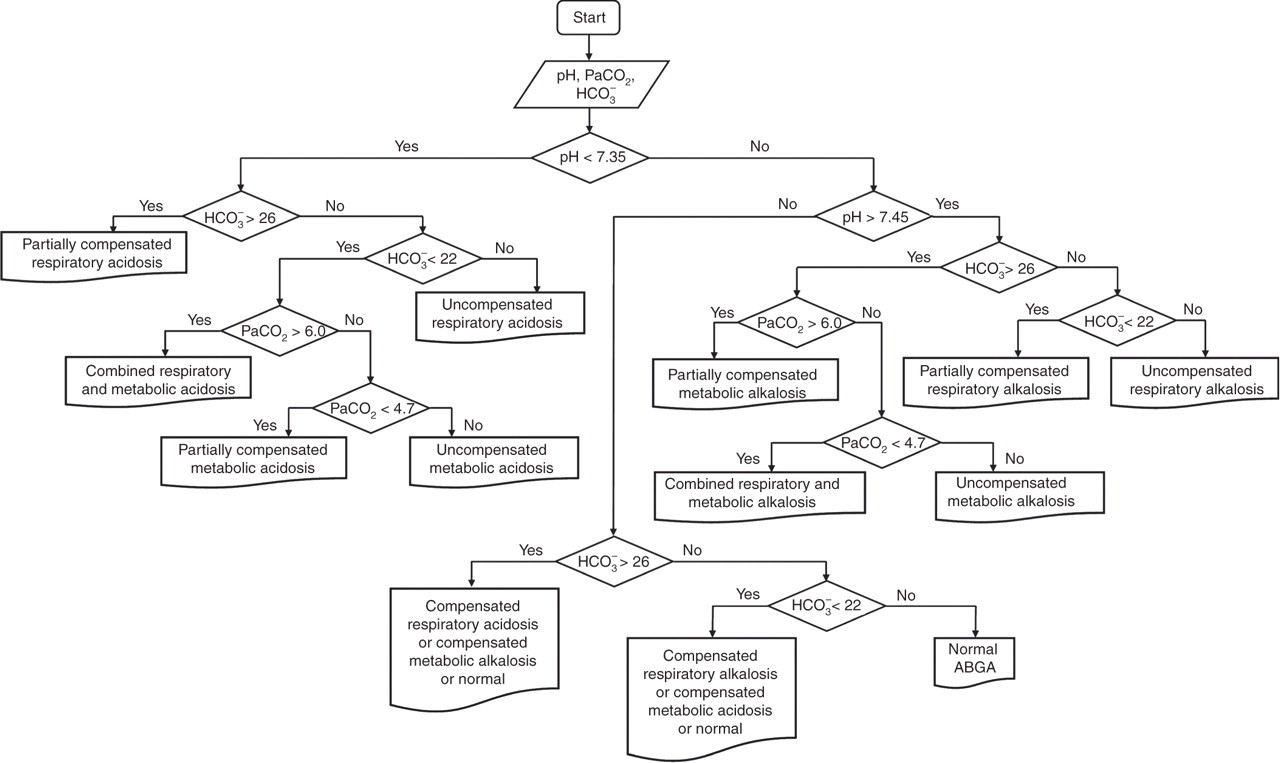
Modified algorithm for the automatic interpretation of ABGA test results (PaCO2 in kPa and HCO3 − in mmol/L)
However, as we mentioned above, the definite assessment of a patient's status heavily depends on clinical information as well as ABGA test results. Therefore, the algorithm mentioned here should only be used as an aid to a full clinical assessment of a patient's acid–base status.
In conclusion, the algorithm described here was developed to automatically interpret ABGA test results. The algorithm showed a higher concordance rate with the interpretations of well-trained clinicians than did the interpretations presented by two web-based programs, and the algorithm was more sensitive to acid–base disorders. Additionally, the proposed algorithm may be easily applied in the HISs used in hospitals. Therefore, we expect that this algorithm will prove useful in clinical laboratory services that provide rapid and definite interpretations of test results.
DECLARATIONS