
Abstract
Many routine hospital and clinical research assays have relied upon immunoassay procedures to achieve sensitive measurements of a range of important analytes. Some of the methods have been developed in-house but increasingly commercial kits and automated analysers have become commonplace. The accuracies of these methods are under question in health care. Mass spectrometry (MS) is potentially a more accurate technique with the ability to demonstrate specificity. An introduction of the basic analytical aspects of liquid chromatography (LC)–MS/MS leads on to the validation of the method before general use. LC coupled with MS and tandem mass spectrometry (MSn) is being adopted in a number of hospital laboratories for the quantitative analysis of a number of analytes from physiological matrices, but standards for development and validation of such assays are not easily available. Most assays can be regarded as in-house methods and herein may lay the failure so far for mass spectrometric methods to improve quality of results between laboratories for an analyte using the same technology. Manufacturers are taking on board the experience of clinical laboratories with kits containing all or most of the disposable items and reagents. A number of documents and guidelines have been consulted. These documents are expensive to purchase, are often very long and not easy to read. This review highlights the specific requirements for introduction of a tandem mass spectrometric test for small molecules into a routine hospital laboratory. A number of experiments need to be planned and executed in order to describe a new quantitative method in terms of selectivity, accuracy, imprecision, sensitivity and stability. The introduction of a quantitative method based on tandem MS requires careful validation. This review has distilled out important points from a number of key documents in order to provide a working validation guideline for clinical laboratories. In a supplementary file a working document for assembling the assay validation is proposed.
Introduction
Liquid chromatography (LC)–mass spectrometry (MS)/MS is a powerful hyphenated technique that is increasingly becoming part of the clinical chemistry laboratory hardware for the analysis of small molecules, 1,2 most often in the guise of a ‘triple quadrupole’ instrument. Compounds separated in the LC are ionized and then filtered in an MS according to mass-to-charge ratio (m/z). Most of the small molecules of clinical interest will have one charge, hence m/z equates to mass. A collision cell partially pressurized with neutral gas molecules before the second MS generates fragments ions that are subsequently mass analysed in the second MS. This combination (LC–MS/MS) offers the ability to specifically quantify an analyte (or several analytes) at low concentration in the presence of other components in a complex (physiological) sample. The signal from the analyte is compared with the response from a known amount of an internal standard that is usually a stable isotopically labelled analogue of the analyte. The method validation must demonstrate that the accuracy and specificity of the analysis are acceptable for use. Some of these procedures can be taken beyond what is achievable in ligand-binding assays. The costs of tests using these methods can compete with immunological assays because the reagent costs for LC–MS/MS are considerably less. However, suitable internal standards are needed.
Applications to hundreds of peptides and proteins have been published (see Anderson 3 for review to 2009) but will not be included in this treatise, though the principles of validation will be similar. Two examples illustrate features of protein analysis using LC–MS/MS. Plasma renin activity has been determined by measurement after an incubation of the sample to allow renin to cleave angiotensin I from angiotensinogen in the sample and then measure the product by LC–MS/MS. 4 The collision-induced spectrum of angiotensin I is dominated by an [M + 2H]2+ at m/z 649 and a singly protonated product ion of the 1–6 amino acids at m/z 784. An internal standard had a valine residue in the sequence substituted for the isoleucine at position 5 creating a mass difference of 14 amu. Parathyroid hormone (PTH) with 84 amino acids has been determined using LC–MS/MS by measurement of the N-terminal 1–13 peptide after trypsin digestion. 5 PTH is first isolated by immunocapture using a murine monoclonal antibody to PTH 44–84 bound to polystyrene beads. The internal standard was an 15 N-labelled PTH. Peptides from a trypsin digest have the amino terminus and the C-terminal residue, lysine or arginine as potential sites for protonation. In the case of PTH, a triply charged precursor ion and a doubly charged product ion were detected. Proteins will be more of a challenge to clinical laboratories than the analysis of small molecules described here.
Method development
An ideal method for tandem MS is based on pseudo-isotope dilution analysis, usually with a stable isotope-labelled analogue of the target compound.
2
Calibration of the analysis will require a pure preparation of the analyte that can ideally be brought to match the matrix of a biological sample. Depending on the requirement of the clinical test, then serum, plasma or urine containing none of the analyte will be preferred to solution in buffer or solvent. A serum or plasma ‘stripped’ of the analyte by charcoal adsorption is often used, but, in the context of LC–MS/MS methods, there may be distinct differences in the behaviour of the calibrants in that form compared with clinical samples. In order to develop a tandem mass spectrometric method, a number of operational factors need to be considered before a full validation of results is attainable. The components include:
Internal standard selection; Sample preparation; Introduction of sample to LC; LC conditions; Ionization; MS conditions; Data analysis.
Internal standard
The internal standard material compound is added to the sample at the earliest stage in the analytical process to act as a measure of recovery in the isolation of components, generation of ions and mass selection. Care should be taken to achieve equilibration with the analyte throughout the sample. An analogue with three or more isotopic labels (typically deuterium or carbon-13) is usually regarded to be the most effective internal standard in a quantitative assay for small molecules. This enables distinction of the molecular ion of the internal standard from natural isotope peaks at M + 1 and M + 2 of the analyte. Synthesis of deuterium-labelled internal standards is often by acid- or base-catalysed exchange or catalytic reduction. The stable label should be attached to non-labile sites (i.e. not at hydroxyl, carboxyl or amino positions). Carbon-13-labelled compounds are usually more expensive. For proteins and peptides, stable isotope labels incorporate nitrogen-15 or oxygen-18 atoms. Leukotrienes with three 13C atoms and one 15 N atom in the cysteinyl residue proved easier to prepare than deuterium-labelled standards. 6 Where derivatives of the analyte are prepared for an LC–MS/MS analysis then internal standards can be prepared using labelled derivatizing reagents. 7
The deuterium labelling should be stable on storage of the material and during sample processing to ensure that the standard does not degrade within the time frame of the experiment and needs to be verified during the method development for each step (e.g. storage, sample preparation and autosampler waiting time). The internal standard should be pure (ideally >95% but can be as low as >85% with appropriate verification) and must have minimal contamination with the target analyte. The analyte and internal standard essentially behave in an identical manner chemically in all aspects of sample treatment and mass spectrometric analysis. Suppression (or augmentation) of ionization by the presence of other compounds at the point of delivery to the source of the mass spectrometer is, however, an important matter discussed later in the review and the internal standard should behave like the analyte here. In low-resolution chromatography the analogue and natural compound are unlikely to be significantly separated. In some cases, a compound structurally related to the analyte may have to be used as internal standard, which may elute separately from the compound of interest, thus losing any carrier effect of a true internal standard. An isomer, homologue or derivative of the analyte may be used in this regard. A demethylated or hydroxylated analogue as internal standard should be avoided because these are common transitions of metabolites of the analyte. The analysis of immunosuppressants, for example, can use ascomycin as an internal standard when quantifying tacrolimus and related drugs.
8
Assay performances can also vary significantly with the internal standard used.
9,10
For example, lower quantification results for sirolimus were recorded when a
Sample preparation
Samples for analysis by a mass spectrometer, when in conjunction with LC, will usually have to undergo minimal, but often at least some preliminary, pretreatment. Sample preparation before LC/MS analysis may include protein precipitation (PPT), solvent extraction (liquid:liquid; LLE), solid-phase extraction (SPE), ultrafiltration and microdialysis. 12,13 A simple extraction would be ideal. When an analyte is present at high concentration in a biological fluid, a dilution of the sample (e.g. with PPT, zinc sulphate solution) may be an effective treatment alone. If urine is being analysed by dilution then the electrolyte content needs to be standardized. PPT does not remove lipids, phospholipids or fatty acids. In PPT, methanol is often superior to acetonitrile, 14 which may be fortunate as supplies of acetonitrile have been uncertain. If the solvent is changed then the characteristics of the new method must be established. The recent difficulty in supplies of acetonitrile has led to changes in methods. If using LLE then the volatility of the solvent may have to be considered if speed is needed in the procedure. Ethyl acetate, hexane, n-butyl acetate, iso-propyl ether, tertiary butyl methyl ether and toluene all evaporate quickly. A range of normal- and reverse-phase (RP) sorbents are available for SPE with applications based on polarity and charge of the analytes. Particle size can influence the length and breadth of flow in the sorbent. Turbulent-flow chromatography is a recently adopted size-exclusion chromatography that retains the analyte(s) through the RP or anion-exchange column chemistry but excludes the high-molecular-weight portions of the matrix, along with the salts. Depending on batch size of the analysis, the handling of tubes or 96-well plates may be manual or automated using pipetting stations and robotic systems. Extracts from SPE have been demonstrated to be relatively cleaner than with PPT and LLE. 15,16 SPE procedures can proceed for one sample while an earlier extract is going through the separation and MS analytical step, thus increasing productivity. Immunoaffinity techniques might also be used to significantly enhance selectivity, though molecular imprinted polymers may also serve to approach that goal. Flow switching and back flushing of SPE and turbulent-flow columns can be incorporated within the experimental system design and direct injection of plasma is possible for some analytes. Plasma-free metanephrines, for example, can be analysed with automated on-line weak cation exchange SPE cartridge extraction, high-performance liquid chromatography (HPLC) and multiple reaction monitoring (MRM) in positive electrospray ionization (ESI) mode. 17
Liquid chromatography
A combination of column and eluting solution that gives symmetric peaks with peak widths around five seconds, adequate retention and selectivity is the aim. 18 The solution of the sample injected into the LC needs to be compatible with the mobile phase of the LC, and must also be of an appropriate composition so that the target analyte is retained on the separation medium. The sample should be loaded to the injector of the LC in a small volume (although in some cases larger samples have been used in order to achieve appropriate levels of detection through sample concentration) and in a ‘weak’ solvent in the context of the chromatographic mechanism being employed. In order to achieve economical use of a tandem mass spectrometer, an autosampler will be an essential piece of hardware. This needs regular maintenance to avoid carryover, inaccurate injection volume and failure during a batch process. A guard column or filter may be placed ahead of the LC column, but this may lead to peak broadening.
In the LC some separation of sample components can be achieved. For simplicity, the LC column is typically operated on-line to the MS. LC stationary phases come with many different chemical affinities (e.g. normal phase, RP, ion exchange, ion pair and size exclusion), but in LC–MS/MS methods RP with non-polar C8- or C18-bonded silica, stationary phases are the most widely used for physiological extracts.
Ultraperformance LC (UPLC) columns are very narrow (less than 2 mm with sub 2 µm packing) and need pumps capable of delivering higher-pressure solvent flow (1000 bar; 15,000 psi) than for conventional columns (400 bar/600 psi), but yield improvements in separation efficiency and shortened analysis times if used appropriately. With UPLC, peak widths of the order of a second or so can be achieved. Hydrophilic interaction liquid chromatography is a new technique that combines silica- or polar-bonded stationary phases and mobile phases, with the target compound being eluted at higher aqueous concentrations of mobile phase (a sort of ‘reverse reverse phase’ so near a normal phase). 13 Capillary columns produce sharper peaks and thus enhance sensitivity.
LC solvents of the highest chemical purity should be used in an LC/MS/MS method, except where the use of lesser quality solvents can be shown not to affect the quality of results and the operational downtime of the instrument. Acetonitrile and methanol dominate but ethyl acetate and iso-propanol are sometimes used. The composition of the eluent influences LC retention and MS ionization. 19 Water should be particle free, chemically clean and of 18 MΩ resistivity. Chlorinated solvents such as chloroform and dichloromethane can in atmospheric pressure chemical ionization (APCI) – see later – be explosive and generally should be avoided because of toxicity and coating of the MS source elements with non-conductive layers. Tetrahydrofuran is little used in clinical LC–MS. High pH may be needed to elute hydrophobic phospholipids. The separation of mixtures by RP-HPLC usually needs gradient elution with modifiers of pH and ion pairs. Retention times can be manipulated to separate the analyte from interferences. In an assay for tobramycin, for example, heptafluorobutyric acid was used as an ion-pair reagent. 20
Ammonium acetate, ammonium formate and hydrogen carbonate at low concentrations can be used as buffering additives, and volatility of the buffering agents is highly desirable in LC–MS/MS methods to avoid excessive source contamination and subsequent performance deterioration, particularly over the course of large batches. The use of non-volatile buffers (e.g. phosphate and borate) is not recommended. A 0.1% trifluoroacetic acid (TFA) in water and acetonitrile system is widely used for peptides and proteins, though the levels of TFA in the mobile phase can significantly compromise the sensitivity in some applications. 21
The demand for short run times (to maximize throughput or minimize turnaround time) has necessitated use of short LC columns with little or no chromatographic separation. The length of the column, column temperature, loading of bonded phases, flow rate and transit time of the analytes can influence degradation within the column. Interferences can be encountered from isomeric and isobaric components. Glucuronide conjugates can undergo hydrolytic conversion in the electrospray. 22 Catecholamines lose water very easily in the source. Problems are encountered in sensitivity, peak shape, retention time and level of background noise. Two useful papers discuss remedies. 22,23 A strategy for column replacement needs to be established based on usage in relation to the cleanliness of sample extracts.
Ionization
Advances in the instrumentation to generate ions are the basis for highly successful developments in MS. Three recent reviews cover this in detail. 18,24,25 In ESI, a gas (typically nitrogen or air) is used to assist in the nebulization of the eluent from the LC system as it enters into the mass spectrometer ion source through a narrow capillary. A potential is applied to the tip of the spray, and ionization occurs in the strong electric field that is generated between the sprayer and the entrance to the mass spectrometer vacuum system. A trace of formic acid in the solvent will assist positive ion formation and a trace of ammonia or a volatile amine will help negative ion formation. A (heated) desolvation gas is also directed at the spray in order to aid in solvent evaporation from the droplets which concentrates the ionic charge, eventually leading to the formation of gas-phase ions. Positive ESI typically forms hydrogen ion (proton) adducts, but other forms are encountered depending on the nature of the LC eluent. In atmospheric pressure ionization (API with chemical assistance to ionization, APCI), the LC eluent is heated to achieve vaporization of the sample, and this spray is passed over a corona discharge needle that helps in the formation of gas-phase ions through a process akin to the traditional chemical ionization that has been used in mass spectrometers for some years. Atmospheric pressure photoionization (APPI) extends the ionization range to more non-polar analytes (such as steroids) than either ESI or APCI can ionize. A UV lamp is used as a source of photons. In the context of APPI, most LC solvents are photoionizable compounds that assist the chemical ionization of the analyte. 26 As a general rule, polar compounds (charged in solution) should be tried with ESI and non-polar compounds with APCI. Steroids can work as well by ESI as APCI, so this has to be resolved by testing.
MS analysis
The discussion here is limited to tandem quadrupole instruments which predominate in current clinical applications. The mass spectrometric properties of the analyte and the candidate internal standard are first studied in full scan mode so as to identify the molecular (related species) ion, adduct ions and fragmentation of the molecule after ionization. Positive and negatively charged ions are produced in the ionization process, and both polarities should be investigated according to the chemical functionality of the target molecule. Analysis of positive ions is more prone to interference from chemical noise than the negative mode. The formation of dimers (or other clusters) is sometimes encountered in positive-ion mode; by using the negative-ion mode this dimerization may be reduced, 22 but care must be taken with solvent (mobile phase) selection, e.g. TFA can significantly suppress signals in negative ionization mode. Electrochemical reactions can occur both in and after the capillary of an electrospray instrument but can also happen in the LC column depending on the instrument set-up and grounding. 27 Since the mass spectrometer monitors mass-to-charge ratio, the ions detected will not be the same as mass if the ion has multiple charges. Usually small analytes are analysed as singly charged ions, but in peptides and proteins the presence of multiple charges enables large molecules to be detected within the 1000 or 2000 m/z range of most mass spectrometers. The first MS (Q1) is operated in scan mode by varying RF voltage and DC potential applied to the analytical quadrupoles. The collision cell, Q2, is typically operated in a broad (RF-only) filter mode. The cell is partially pressurized with neutral gas molecules such as nitrogen or argon. Q3 isolates the reaction products. In newer instruments, MS scans are affected by keeping the collision cell pressurized, operating Q1 and the cell in RF-only mode, and scanning Q2 – allows faster scan speeds. Collision-induced dissociation within Q2 will be influenced by the nature and pressure of the gas, the design of the collision cell and the collision energy applied to the cell. Sometimes there can be fragmentation before Q1 through collision with residual atmosphere in the source. This is influenced by column flow, potential and pressure in the source, and these can be changed to slow down the ions and reduce fragmentation.
The relationship between precursor ion and product ions generated in the collision cell needs to be established. Fragmentations that include common losses (e.g. loss of water) should be avoided wherever possible as these can be non-specific for the target analytes. A quantitative analysis using a tandem mass spectrometer is based on selected reaction monitoring (SRM). In SRM mode of operation, Q1 and Q3 are static (Figure 1). The conditions for ion generation in the ion source are largely compound specific. Optimization of the ionization should be verified periodically (daily and weekly). When common fragment (product) ions from both the analyte and the internal standard are being monitored, care must be taken to optimize the timings of transitions monitored and the delay period so that cross-talk between the two compounds (caused by incomplete clearance of the collision cell between successive transitions) is avoided. This too has been reduced by recent improvements in cell design. For a quantitative measurement, a chromatographic peak needs to be defined with at least 10 data points, so the individual component analysis (dwell) time and detector cycling time may need to be adjusted to achieve that. The signal for the analyte is calculated relative to the signal response from the internal standard. The software will integrate peak areas, which must be done reproducibly and take consistent account of chromatographic background noise. When monitoring more than one analyte (MRM) the process is repeated specifically for each compound according to the elution time.
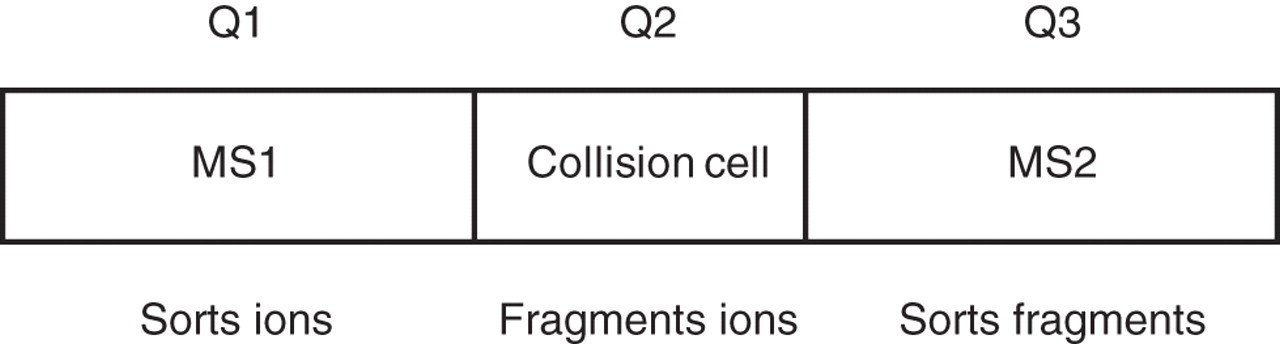
Schematic of a tandem mass spectrometer. In principle two mass spectrometers (MS1 and MS2) are linked with a collision cell. Three quadrupoles (Q1, Q2 and Q3) achieve this in a tandem mass spectrometer by sorting ions, generating fragment ions and sorting fragment ions, respectively
Optimization of source and collision conditions should be part of daily performance qualification. Most of the above operations are available within the software provided with a particular instrument. The status of gas flows, voltages, temperatures and vacuum is continuously monitored in all instruments, and warnings are displayed to alert the operator to an ‘out-of-range’ condition. If the instrument is not attended continuously by an operator then a batch process may be automatically aborted to avoid wasting prepared samples. Instrument tuning for MRM may be an automated option although a skilled operator may be able to make some refinements, such as collision energies, to further optimize the tune. Typically though, the conditions defined during a method development phase will not vary (significantly) during day-to-day operation unless a fault condition develops. The mass spectrometer can have the mass scale automatically calibrated against a reference preparation. The calibration must be appropriate for the type of measurements to be undertaken and should be defined in the standard operating procedure (SOP) in consultation with the manufacturer's recommendations. The timeframe for validity of mass scale calibration should be defined according to local guidelines.
In the method development phase, the ion source temperatures and gas flows are optimized for the solvent flow rate and composition. It is strongly recommended that more than one precursor/fragment transition (quantifier and qualifier) is monitored to demonstrate specificity of the quantitative analysis although one parameter can usually be monitored after optimization. 28 All instrument settings are typically stored in the analytical record for a particular measurement.
Data analysis
When the analysis of a batch of samples is complete all the data should be carefully reviewed for anomalies and corrective action in the following:
Retention times of analyte and internal standard should be reproducible. The ratio of retention times in a sample relative to the ratio with reference solutions should not exceed 2.5% in LC.
28,29
If not acceptable this can be due to injector or column problems. Peak shapes should be examined for symmetry. Peak shapes (fronting/tailing, symmetry) and peak widths should be examined for consistency since deviations are evidence for possible interferences that need to be investigated; Changes in chromatographic baseline suggest matrix effects or LC flow or composition changes; The data should be examined for signs of detector saturation in standards or samples. A flat topped or inverted peak is a sign of saturation. The sample should be diluted until no saturation is observed; There should be clear blanks when no sample is injected bearing in mind that low-intensity, broad peaks can arise from late-eluting material (possibly from a previous injection). Carryover should be tested with a blank sample or low-level sample run after a high-level sample; Calibration curve is ideally linear in the analytical reportable range or working range. This can be confirmed with regression analysis; Lower limit of quantification (LLOQ) – signal-to-noise (S/N) ratio as expected at coefficient of variation (CV) < 20% and accuracy 80–120%; Quality controls – need to meet a defined level of acceptability to local guidelines and regulations (for example within 2 SD of mean); SRM transition ratios (the relative abundance of two transitions) in samples within the batch should not exceed 15%; Accuracy is demonstrated by a comparison with a published, working or reference method. Recovery of 95–105% of added material is a good target.
The measurement of peak areas or heights can be used in the quantitative analysis. The software packages with the instrument will do these effectively as a matter of course. The analyst will have options for a number of further manipulations including ability to smooth data if noisy and selection of peak-start and peak-end points, deciding where to integrate partially resolved peaks. The SOP should define the local standards for acceptability within the assay and all manipulations must be recorded. It is essential that practices do not deviate from those used in the validation.
Validation of the method
LC/MS/MS methods need verification beyond the procedures normally accepted for routine assays (for example, using immunoassay). A validation must provide objective evidence in order to declare the method as being fit-for-purpose, as well as exhibiting appropriate performance characteristics. The measurements must be supported with levels of confidence on the results. Any assay requires validation of the method prior to the introduction for clinical use. Such validation must include:
Selectivity; Accuracy; Imprecision; Sensitivity; Stability.
Selectivity (what is being measured?)
Confirmation of analyte identity is required. Three methods have been used:
Retention time; The monitoring of multiple mass transitions and calculation of their relative intensities (relative ratio) is the usual approach. At least one ion response ratio for quantifier and qualifier transitions should be calculated; Mass transitions under different fragmentation conditions can be used.
Fragmentations that include common losses (e.g. loss of water) should be avoided wherever possible as these can be non-specific for the target analytes.
Are there any interferences in the analysis?
Interferences in tandem mass spectrometric methods are encountered and lead to changes in the efficiency of analyte ionization. 30 These are called matrix effects. 31–35 The analyte, on eluting from the LC, is transferred to the gas phase and forms ions, typically through an atmospheric ionization process. The efficiency of ionization can be affected by the presence of other components in the sample eluting at the same time as the compounds of interest. For example, phospholipids in sample extracts are well-known potential interferents, and some can be monitored in positive-ion electrospray with SRM of m/z 184 to m/z 184 and neutral loss scan of m/z 141 and in negative mode with precursor ion scan of m/z 153. 36,37 If necessary, the extraction and chromatography can be changed to keep phospholipids away from the quantitation area for any analyte. 15,38
There can be material in vials and blood collection tubes that also affect signal generation. 39 Plastics may pose particular problems 40 with sample contamination from chemicals in the polymerization and reagents used in steps of the manufacturing process such as release agents (e.g. oleamides) that assist in removal of the plates/tubes from the moulds. In 2008 the literature on interferences was thoroughly surveyed 41 and a number of website addresses are given in that publication for further information. A spreadsheet can be accessed from a digital object identifier document (doi:10.1016/j.aca.2008.04.043). Some changes in composition of the sample can occur on storage.
Some of the interference problems can be addressed when optimizing extraction of the target analyte from biological samples. Both suppression and enhancement of ionization by sample components have been reported, and must be accounted for during method development. 16 One way of minimizing ionization effects is to use a stable isotope-labelled internal standard which is chemically the same as the analyte (therefore will chromatograph and ionize in the same way as the target analyte, but will have a different mass) and is likely to be affected equally as the analyte – this needs to be verified through appropriate experimentation. Additional contamination may arise from within the solvent flow path of the LC/MS system (tubing, gas lines and switching valves), solvent impurities, plasticizers and silicones.
Three methods have been used to demonstrate sample interference:
The least sensitive method is to use the MS in full scan mode to identify a potential interfering compound from the mass spectrum; The response of the analyte in a buffer solution containing a known concentration of the target compound can be compared with the response in a sample extract spiked with the analyte; A postcolumn infusion test has also been used in order to demonstrate the phenomenon.
42
An infusion pump is used to deliver a constant amount of the analyte into the LC eluate entering the MS (Figure 2). The MS is operated in SRM mode. Sample extracts are injected into the LC. If a sample component is present the detector signal will vary – the aim is to demonstrate that at the elution position of the analyte there is no signal suppression (Figure 3). Care should be taken to demonstrate absence of ‘late eluting’ interferences. Sample extracts should include:
– Patient samples. One group has argued that matrix effects should be investigated in biological samples from at least five different sources
43,44
with and without fortification. Concomitant medications may be a problem not limited to the drugs themselves, the dosing vehicle and packers can also lead to signal changes in the analysis;
45
– Patient samples with high concentrations of analyte should be tested at dilution for parallelism. The analysis of diluted samples may be conducted as follows (other combinations in relation to the number of samples can be found in the EP7A document
30
). Identify a sample with analyte concentration close to upper limit of assay range and identify a sample with analyte concentration close to lower limit assay range. Prepare equally spaced dilutions. An example is shown in Table 1, e.g. analyse four replicates of each dilution. Record values and standard errors. Perform polynomial regression (Y = b
0 + b
1
X + b
2
X
2 + b
3
X
3), second- and third-order polynomial variables not significantly different from zero. The t-value should be less than critical value at 95% confidence level; – Samples from patients being prescribed typical drug treatments – the dosing solution vehicle should be considered for any matrix effect in addition to the drug itself and its metabolites. Use of over-the-counter drugs such as aspirin, ascorbic acid, dextromethorphan, pseudoephedrine, salicyclic acid and ibuprofen can also lead to interferences in some assays; – Samples collected with different anticoagulants; – Lipaemic and haemolysed samples; – Comparisons of solvent extraction, SPE and PPT; – Matrix samples with and without addition of potential interferents. For steroids this may involve testing of many steroids and their isomers of the same molecular weights (isobaric), although fragmentations may be different so product ions may not be a feature of all. The drug fenofibrate has the same mass transition as in cortisol (m/z 363 to 121). Omeprazole sulphone, a metabolite of omeprazole, has been reported to interfere in cortisol analysis by LC–MS/MS.
46
Metabolites of steroid drugs should also be tested – tetrahydroprednisone and dihydroprednisolone also have the same transitions as cortisol. Computer searches are available on the Internet to identify potential interfering substances ( – Replicates of certified reference materials if available should be analysed at least six times. The mean value should be within 15% of the target unless near LLOQ when 20% is acceptable.
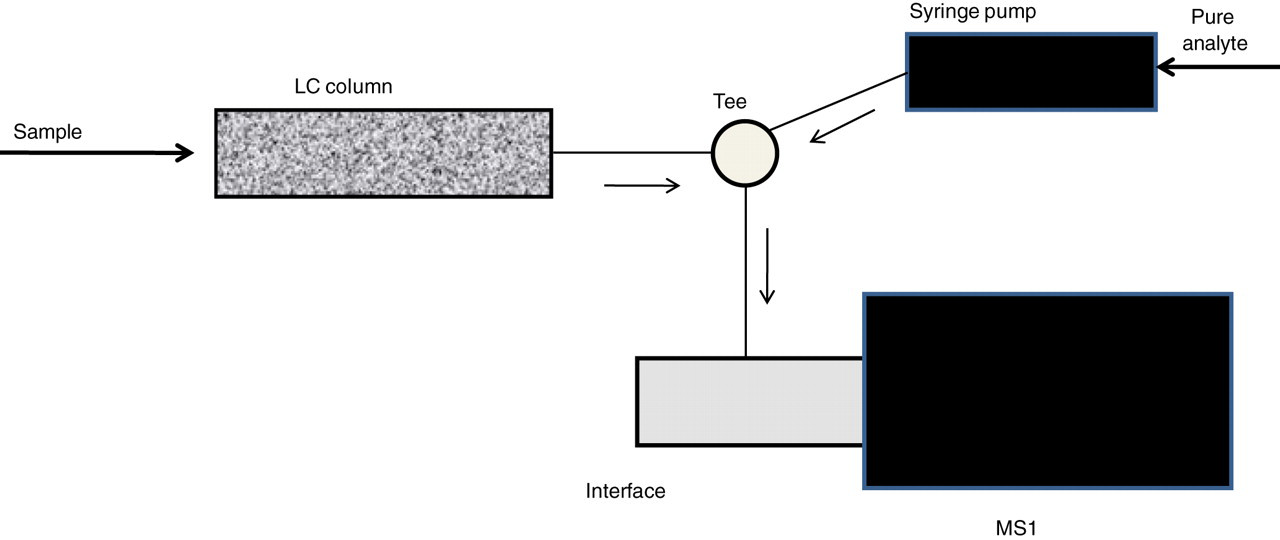
Postcolumn infusion technique. Postcolumn infusion system – pure analyte from the syringe is continuously mixed with the effluent of a sample eluting from the LC column. LC, liquid chromatograph
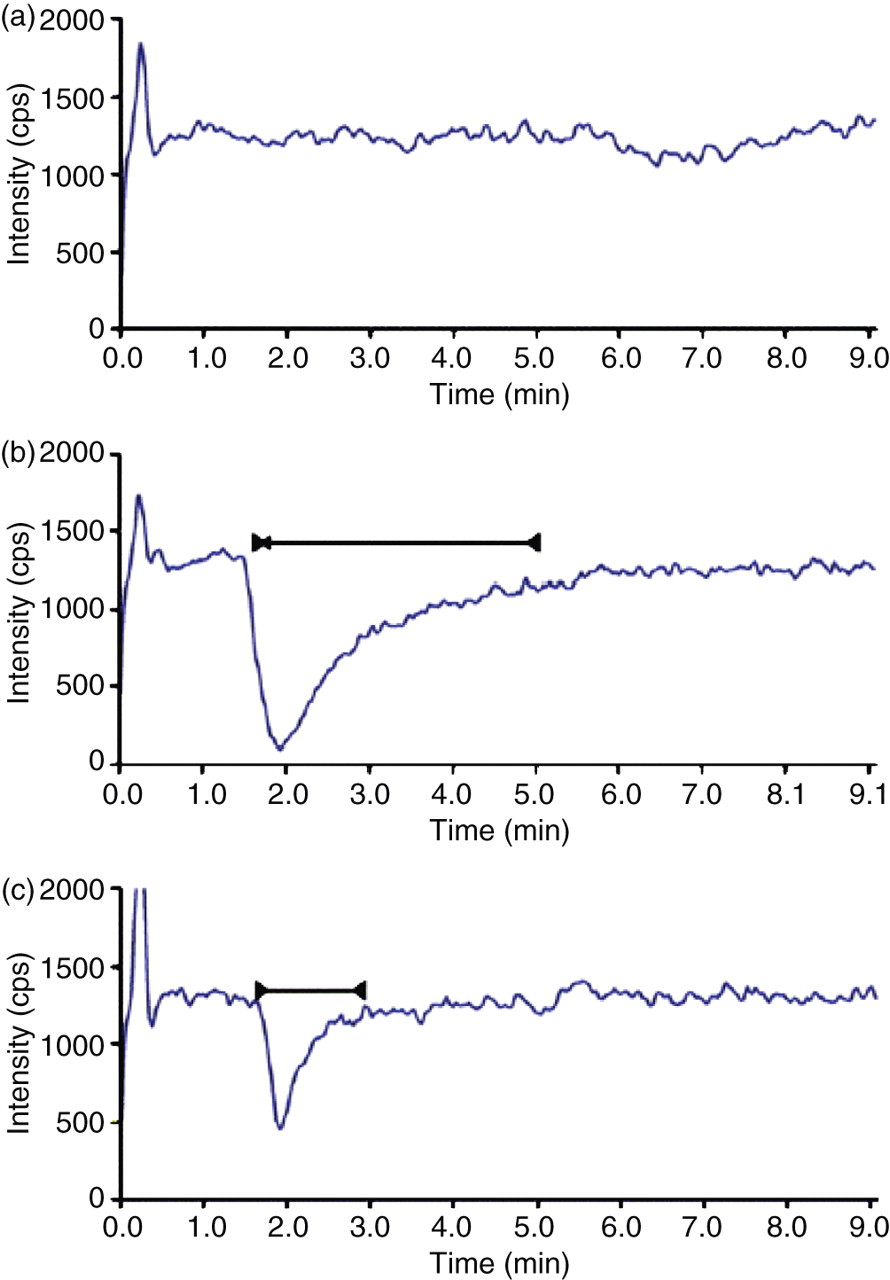
Chromatograms when analyte infused continuously postcolumn with injections onto the LC of (a) no sample, (b) a sample extract by protein precipitation and (c) a sample after SPE. The solid lines indicate areas where ionization is influenced by matrix effects; the analyte should elute after this region. (Redrawn from ref. 33 .) LC, liquid chromatograph; SPE, solid-phase extraction
Proportions of low and high samples to check linearity of responses
Relative retention times
In most cases, deuterium-labelled compounds elute marginally before their equivalent analyte (for example, d3-testosterone and testosterone have retention times of around 2.92 and 2.94 min, respectively, in the method reported by Cawood et al. 50 ). Differences in physicochemical properties are attributed to the fact that deuterium atoms have a stronger binding to carbon than hydrogen. However, minimal differences in retention times (<0.05 min) should not affect the quantification.
Standard curve
As with many bio-analytical methods (chemical and ligand binding), a standard curve is plotted of relative response signal against relative concentrations as the reference points for comparison of results from biological samples. 51 Ideally the standard curve should be prepared in the sample matrix at a minimum of five concentrations in addition to the blank matrix (matrix without added internal standard) and a zero standard (matrix with added internal standard). The reportable concentration range of the assay should encompass the target analyte concentrations expected in patient investigations. The amount of internal standard is usually set near the middle of the calibration curve (or at the upper therapeutic limit). The mathematical formula for response according to concentration of analyte and goodness of fit should be calculated. The linear response range for the assay should be determined; the line can be determined from least-squares regression. The response can be assumed to be linear if the correlation coefficient (r-squared) is greater than 0.99. The plot should not be forced through the origin, though some calculations use 1/x weighting. A plot of least-squares residuals can be performed and this will display the distance of the observations from the fitted line. If there is a lack of reproducibility the method needs to be re-examined. In some cases, a quadratic relationship between response and concentration may be found. Non-linear calibration curves can be the result of dimer and cluster formation. 22 This can be prevented by the addition of cationic modifiers to the electrospray solution, and is worth investigating since staff in non-expert laboratories may not cope well with second-order calibration curves.
If the internal standard has a mass increment of only 2 Da then this may be detected in the second isotope increment (13C2) of the analyte. 52 Isotopic impurity of the internal standard may work in the opposite direction – an unlabelled compound in the internal standard being detected in the ion for the analyte. If a result is above the measurable range the validity of the result should be checked by appropriate dilution to check if the result is in the calibration range, but the choice of diluent is sometimes a problem and this may not be straightforward.
Lower limits of assay performance
The limit of detection is the point where an analyte can be detected but not necessarily quantified 53 (Figure 4). For the lowest standard in the calibration, the analyte response over five injections should be distinct from the results for the blank. The lower limit of detection (LLOD) is the lowest concentration at which the peak for the analyte is detected with an S/N ratio of 3 (or as defined locally) and the mean result of the lowest standard is above the plus 3 SD of the blank results. The LLOQ is the analyte concentration when the S/N ratio is 10 with less than 20% imprecision and 80–120% accuracy. These criteria at lower concentrations than the lowest standard are determined by serial dilutions of the low standard. Sensitivity of assays can be improved by changes in ionization technique and potentials, adduct formation, switching modality of ions and derivative formation. 54
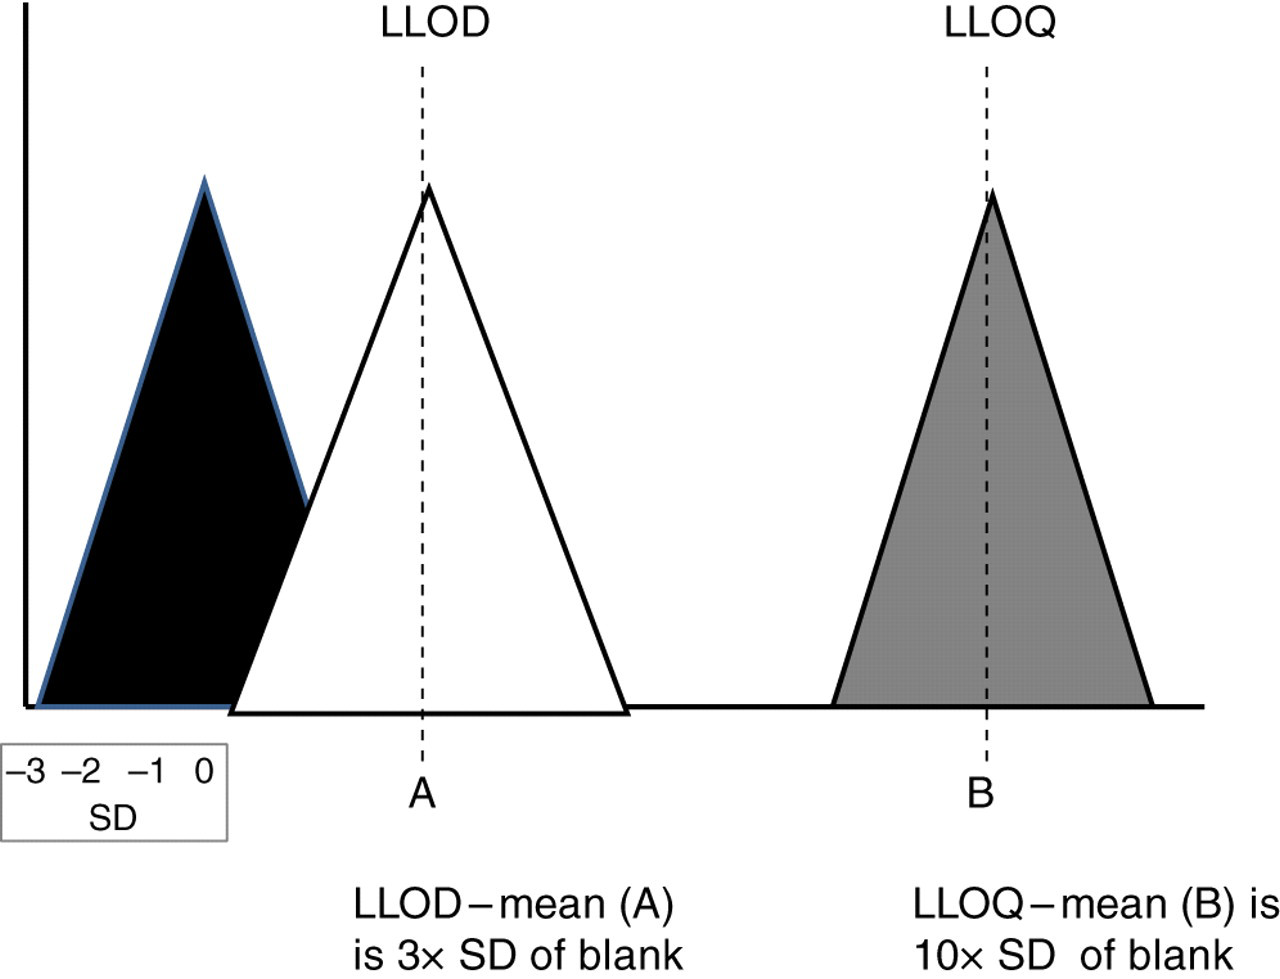
Lower limits of detection and quantification (LLOD and LLOQ). SD is the standard deviation of the results. Ranges of results are illustrated for blank (black triangle), low-level sample at LLOD (white triangle) and sample at LLOQ (grey triangle). LLOD, lower limit of detection; LLOQ, lower limit of quantification
Repeatability (precision)
A preliminary precision test 55 suggests taking a mid-range sample with 20 replicates. Then determine standard deviation and % CV. Acceptance criteria would be results with <10% CV. The precision of a method is the closeness of individual results when the procedure is applied repeatedly to extracts of a sample. For a thorough precision evaluation, the intra-assay precision of the assay is determined from five replicates of low (L), medium (M) and high (H) level samples or QC samples. In some assays where there is a decision point, an additional QC near that concentration should be considered. These should be at concentrations within the range of reference and pathological results. An order of analysis of these samples can be M, H, L, M, M, L, L, H, H, M. 56 The inter-assay precision is determined over five consecutive batches using the high, medium and low QC samples. Intra-assay CV should be less than 10%. Inter-assay variation should be less than 10%. On each day for five days perform two separate assays with QC and 10 patient samples in duplicate. The order of analysis should be changed. Plot preliminary QC charts after first two days; plot all subsequent results on the charts. Examine the data for outliers – if result is ±3 SD investigate and if ±4 SD reject the result. Calculate imprecision. Test acceptance criteria would be met when results are within 15% CV.
Accuracy
Accuracy is the agreement of results to an accepted reference value. This can be tested in a number of ways such as
Comparison of results with reference method; Analysis of certified reference material; Comparison of calibrators; Spiked blank samples and determination of the percentage of recovery; Spiked samples and determination of the percentage of recovery.
Mean values should be within 5–10% of the target values. Difference plots, Bland–Altman plots and Deming regression analysis may be used.
Recovery as a measure of accuracy is assessed by comparing the concentrations of analyte in blank matrix before and after addition of known amounts of the analyte. Performance in external quality assurance (EQA), unfortunately in most cases, does not address accuracy unless circulated samples are a set of basal and spiked matrix of the above type. Comparison of results with others using the same technology has been a feature of EQA and will be valuable with MS methods only to judge whether the technology is leading to less variation of analyte results. 57 If this improvement is found then laboratories will be succeeding in approaching the harmonization and transferability of data needed to improve patient care.
Patient samples can be spiked with known amounts of analyte. Six patient samples with low analyte concentration could each be spiked to one, two and four times concentration of the analyte. All samples should then be assayed in triplicate. Mean recoveries can be calculated. Acceptance criteria are met when results are 90–110%.
Reference intervals
Ideally for a new method the range of results found under normal circumstances needs to be established. This is a time-consuming and costly process because volunteers have to be selected and recruited to agree to provide the necessary samples. It may be necessary to get approval from a research ethics committee and patient consent. Up to 120 samples may be needed to define a reference range for a normal group, and the data should be examined by parametric and non-parametric statistics. A range may be defined as the limits of the results, mean ±2 SD or a range from 5% to 95% confidence limits. Results by MS can be significantly lower than immunoassay methods owing to the improved selectivity of the MS technique. It is therefore not wise to use a reference range for an immunoassay for an MS method. Results with a reference method are more likely to be applicable. 58–60
Stability
A system suitability check sample should be used regularly (batch, daily) to confirm stability of peak area, peak height, peak width and S/N ratio (basically to ensure that the system is working within the expected parameters). Food and Drug Administration guidelines are worth consulting. 61
Carryover
Carryover can be assessed by injecting a high-level sample before a blank at several points in the analytical run. The analyst needs to be aware of carryover, and inter-injection wash cycles should be adjusted to ensure that any carryover does not significantly affect the determination. The calibration curve can be run from low to high concentrations then high to low concentrations to see if the outcomes are the same. Discrepancies in the two approaches should be investigated.
A carryover test would need a 10-fold dilution of a sample that has an analyte concentration close to upper limit of analytical range. Run the diluted sample repeatedly for 10 injections. Then run the diluted and reference sample injected alternately 10 times each. Using the independent sample t-test compare the mean of the results for the diluted sample injected sequentially with the samples injected alternately.
Proficiency testing
Performance of internal QA and external QA should be charted over time. For internal quality control (IQC), two or more clinically relevant concentrations should be run throughout the validation. The performance should be charted. Criteria for acceptance are results within 2 SD of the means. The assay should be tested in an external quality assurance programme when available. When there are insufficient users of the method for group data the results should be compared with a reference method or GC–MS target values.
Ruggedness
LC columns, reagents and standards will need to be changed with frequencies that depend on workload and the cleanliness of the injected material. LC columns may be changed regularly on the basis of numbers of samples to avoid column failure in the middle of a batch of samples. Procedures need to be in place to document batches and suppliers of all items and check for differences in results when there are changes. Additionally, different production batches of columns, standards and solvents should be checked to ensure consistency of results. A number of situations have been reported in which changing of solvent batches has caused significant problems owing to interferences from the solvents. Instability of standards in solution have been revealed (e.g. ascomycin in acetonitrile). 8,62 Methanol used in HPLC eluting solutions can cause ion suppression. 63
Stability of samples
Tests should also be conducted to confirm no changes in samples during the preparation stages. For example, when using 96-well plates there can be interaction of solvents with the plate materials, leading to distortion by heat during derivatization or evaporation of solvents. When frozen samples need to be transported to the laboratory then stability from time of despatch to receipt in the laboratory needs to be confirmed.
Stability of samples in freezer
Prepared samples should be tested for stability while they are awaiting analysis in the system autosampler. Stability should be ensured for longer (say 2×) than the anticipated storage time, to ensure that samples do not degrade prior to analysis. For example, prepare sufficient (pooled) samples for 1000 injections and run them in a single run, looking for decay in response of internal standard or target analyte signal (also monitor the ratio) over time. Three patient pools can be prepared and divided into five aliquots. Freeze the aliquots. Thaw at intervals of one week and one month. Assay four replicates in each batch. Perform Student's t-test on results. Accept where change <±10% of initial. Results are not acceptable when >±15% of initial.
Stability of stock solutions
Light, especially direct natural sunlight, will rapidly degrade the calciferols. 64 Care must be taken when evaporating solutions of many compounds to prevent losses and adsorption to container walls. Temperatures above 35°C for extended periods should be avoided. Under certain circumstances, deuterium-labelled compounds are prone to exchange of deuterium for hydrogen and this may compromise their suitability as internal standards, 65 but this may be due to the chemistry of the particular label. Deuterium should not be substituted in hydroxyl or amino groups. Deuterium at the carbonyl group of an aldehyde group will not exchange but, if attached to the carbon adjacent to the carbon with an aldehyde or ketone group, can exchange. Stability of the internal standards needs to be tested.
Stability of processed samples (pre-LC/MS analysis)
When ready for analysis there may be instrument problems that prevent immediate processing. A validation experiment should be performed where a set of samples is divided with one set for immediate analysis and the second set injected after storage to confirm stability (see above). Samples should be kept on the autosampler for 24 h and re-run. The delayed processed results should be compared with the results from injections of the samples immediately after preparation.
Validation of dilution protocol
Samples can be diluted with analyte-free, similar matrix or dissimilar matrix (for example, buffer or water or saline with and without albumin).
Conclusions
An LC–MS/MS method can be judged to be viable when the method validation findings meet the standards described in this paper. Few published methods would come up to this standard yet. Two papers on tacrolimus and vitamin D determination are worth citing as a model validation covering issues addressed in the current paper. 66,67 To standardize the outcome of the process, laboratories may find it useful to summarize the information in a form designed for the purpose of assay verification (see Supplementary information). This document should be adjusted by deleting parameters not relevant to the instrumentation. A laboratory may need to be prepared for instrument failure samples and have a contingency plan to run samples on a different MS. Even using an identical model there may be differences in the results obtained. 68 Portability of the method between systems within the laboratory should nevertheless be tested in order to maintain a service for clinically critical assays (therapeutic drug monitoring for example) or a change in sample workload. Fault finding will be a challenge for staff using tandem MS and collaboration with manufacturers and user groups is to be encouraged. Many new users of the technology have to master basics in the principles and application of the LC and sample preparation issues, but problems within the MS/MS may be more difficult for them to recognize.
The use of commercial kits should lead to improvements in inter-laboratory performance, 66,69 although there are differences in performances of the same instruments 68,70 such that optimization of the particular instrumentation is required. LC–MS/MS has the potential to overcome problems with immunoassay. 71–74
LC–MS/MS will now become more widespread in clinical laboratories. There is a need for more stable isotope-labelled compounds. Reference ranges from LC–MS/MS methods for many small analytes are likely to change because of the increased analytical specificity. Users of these methods need to be trained and be prepared to act on any unexpected observation. In some cases other instruments such as time-of-flight analysers will have a place in specialized clinical laboratories. Protein analysis using this technology will also lead to more specific analysis. Biomarkers will come out of developments in genomics and proteomics. The analysis of proteins needs to cover a wide range of concentrations and in some cases isolation of protein or peptides may need immunological techniques and this in turn may limit the applications because of protein modifications translationally (due to polymorphisms) and post-translationally.
DECLARATIONS