
Abstract
Background
A simple method for the measurement of LDL particle sizes is needed in clinical laboratories because a predominance of small, dense LDL (sd LDL) has been associated with coronary heart disease. We applied dynamic light scattering (DLS) to measure lipoprotein particle sizes, with special reference to sd LDL.
Methods
Human serum lipoproteins isolated by a combination of ultracentrifugation and gel chromatography, or by sequential ultracentrifugation, were measured for particle size using DLS.
Results
The sizes of polystyrene beads, with diameters of 21 and 28 nm according to the manufacturer, were determined by DLS as 19.3 ± 1.0 nm (mean ± SD, n = 11) and 25.5 ± 1.0 nm, respectively. The coefficients of variation for the 21 and 28 nm beads were 5.1% and 3.8% (within-run, n = 11), and 2.9% and 6.2% (between-run, n = 3), respectively. The lipoprotein sizes determined by DLS for lipoprotein fractions isolated by chromatography were consistent with the elution profile. Whole serum, four isolated lipoprotein fractions (CM + VLDL + IDL, large LDL, sd LDL and HDL) and a non-lipoprotein fraction isolated by sequential ultracentrifugation were determined by DLS to be 13.1 ± 7.5, 37.0 ± 5.2, 21.5 ± 0.8, 20.3 ± 1.1, 8.6 ± 1.5 and 8.8 ± 2.0 nm, respectively.
Conclusions
The proposed DLS method can differentiate the sizes of isolated lipoprotein particles, including large LDL and sd LDL, and might be used in clinical laboratories in combination with convenient lipoprotein separation.
Introduction
Previous studies have reported the relation of small, dense LDL particles (sd LDL) with coronary heart disease. 1–5 The predominance of sd LDL among the LDL subclasses has been reported to indicate a three-fold increase in the risk of myocardial infarction. 1 The sd LDL (d = 1.044–1.063 kg/L) is small in size compared with the counterpart of LDL (or large LDL, d = 1.019–1.044 kg/L). Several methods have been reported for the evaluation of LDL particle sizes, such as high-performance liquid chromatography (HPLC), 6 gradient gel electrophoresis (GGE), 7 electron microscopy (EM) 8 and nuclear magnetic resonance (NMR). 9,10 Hirano et al. 11 reported that sd LDL-cholesterol levels had a significant inverse correlation with the LDL particle sizes determined by GGE. These previous methods, however, are time-consuming, laborious, and/or difficult to apply to many samples. Although a commercial sd LDL-cholesterol reagent is currently available, 7 the information provided about the particle sizes of the lipoproteins targeted by this reagent has been thus far insufficient. 7
Dynamic light scattering (DLS) is a method that can estimate the mean nanoparticle size in fluids by measuring the intensity fluctuation of scattered light. DLS is quickly performed (i.e. a few minutes) and easy to be used in small spaces such as in clinical laboratories. Previous studies have reported the use of DLS for measuring the sizes of lipoproteins, such as human LDL and chylomicron (CM) from human lymph. 12–14 However, the feasibility of using DLS to differentiate lipoprotein subclasses has not been investigated. In the present study, we isolated five lipoprotein fractions, including large LDL and sd LDL, using two separation methods: gel filtration after ultracentrifugation and sequential ultracentrifugation. DLS analysis of the isolated lipoproteins was evaluated to determine whether DLS can differentiate these lipoproteins, in particular, sd LDL from large LDL.
Materials and methods
Subjects
Blood was drawn from healthy men (n = 4; range = 22–23 y old) for the experiments using ultracentrifugation and Sepharose CL4B chromatography (Study 1). Blood was also obtained from healthy volunteers (n = 11; men:women = 7:4; mean age = 27.7 ± 12.1 y, range = 21–60 y) for the experiments using sequential ultracentrifugation (Study 2). All subjects had fasted overnight before blood drawing. Serum samples were obtained by centrifugation (2000
Clinical characteristics of the studied subjects
sd LDL, small, dense LDL
Data were expressed as the mean ± SD
Lipids and apolipoproteins
Lipids were measured by automated enzymatic methods using commercial kits (Denka Seiken Co, Ltd, Tokyo, Japan): T-CHO (S) for total cholesterol (TC), TG-EX for triglyceride (TG), LDL-EX (N) for LDL-cholesterol, HDL-EX (N) for HDL-cholesterol and sd LDL SEIKEN for sd LDL-cholesterol. Apolipoprotein A–I (apo A–I) and B (apo B) were measured by automated immunoturbidimetry using commercial kits (Apo A–I and Apo B Auto N Daiichi, Daiichi Pure Chemicals Co, Ltd, Tokyo, Japan).
DLS
Polystyrene latex (PS) beads (21 and 28 nm in diameter, Magsphere, Inc, Pasadena, CA, USA) were used for calibration of DLS. DLS measurement was conducted using a model FDLS-3000 (Otsuka Electronics Co, Ltd, Hirakata, Japan). A CONTIN algorithm was used for DLS analysis to obtain the weight-size distribution. 15,16 The laser light was irradiated at 100 mW power at 532 nm wavelength. The fluctuation in scattered intensity was measured at an angle of 90°, and accumulated 100 times over five minutes. The temperature was set at 25°C for experiments using the PS beads and at 37°C for the lipoprotein fractions. The PS beads were measured 11 times for the evaluation of within-run variation and three times on three consecutive days for the evaluation of between-run variation. Each lipoprotein fraction (1 mL), diluted by 10- to 20-fold in saline was contained in a 178 mm × 5 mmϕ glass tube (Optima Inc, Tokyo, Japan) and was measured by DLS. The average of three measurements was used for statistical analysis.
Ultracentrifugation and gel chromatography
Serum was added with a final concentration of 0.7 mmol/L 5,5′-dithiobis (2-nitrobenzoic acid) and 2.7 mmol/L EDTA-2Na (pH 7.4). The sample was adjusted with KBr to d = 1.225 kg/L and then centrifuged in a RPV-50 T rotor (Hitachi, Tokyo, Japan) at 40,000 rpm for 18 h at 15°C using a Hitachi Himac CP60E ultracentrifuge. 17 The total lipoprotein fraction (d < 1.225 kg/L) was obtained by aspiration and then applied to a Sepharose CL4B column (1.6 × 100 cm) in 5 mmol/L Tris-HCl buffer (pH 7.4) containing 0.15 mol/L NaCl, 0.27 mmol/L EDTA-2Na, and 3 mmol/L NaN3. The column was eluted at 4°C, and 3 mL fractions were collected under continuous monitoring of the absorbance at 280 nm. Each fraction was measured for apo A–I and apo B to confirm the distribution of LDL and HDL particles. Each tube bracketing the LDL and HDL fractions was subjected to DLS analysis.
Sequential ultracentrifugation
The lipoprotein fractions were isolated from serum by sequential ultracentrifugation according to the method of Hirano et al. 7 with some modifications. Briefly, ultracentrifugation was performed using a near-vertical tube rotor (MLN-80, Beckman Coulter, Fullerton, CA, USA) on a model Optima MAX (Beckman Coulter). Serum (2 mL) was adjusted to d = 1.019 kg/L and then centrifuged at 40,000 rpm for 20 h at 15°C. After isolating the top fraction (2.5 mL) containing d < 1.019 lipoproteins (CM, VLDL and intermediate-density lipoprotein [IDL]), the bottom fraction was adjusted with KBr solution to d = 1.044 kg/L and then centrifuged again at 50,000 rpm for 18 h at 15°C. After the top fraction (2.5 mL) containing large LDL was isolated, the bottom fraction was adjusted to d = 1.063 kg/L and centrifuged further at 50,000 rpm for 18 h at 15°C. After the top fraction (2.5 mL) containing sd LDL was isolated, the bottom fraction was adjusted to d = 1.225 kg/L and centrifuged further at 50,000 rpm for 20 h at 15°C. The top fraction (2.5 mL) containing HDL and the bottom fraction containing lipoprotein-free serum proteins, designated as the non-Lp fraction, were recovered. Lipoprotein separation was confirmed by polyacrylamide gel electrophoresis (LipoPhor, Jokoh Co, Ltd, Tokyo, Japan).
Statistical analysis
The sizes determined by DLS for the serum samples and the lipoprotein fractions isolated by the sequential ultracentrifugation were compared by non-parametric Kruskal–Wallis test. The particle sizes in the large LDL and sd LDL fractions were compared by Wilcoxon signed-rank test. The association between the serum TG levels and the particle sizes of the CM + VLDL + IDL fraction was tested by Spearman's rank correlation coefficient (Rs value). P < 0.05 was considered to be statistically significant.
Ethics
All individuals gave written informed consent to participate in this study. The study was approved by the ethics review board at the Faculty of Health Sciences, Hokkaido University (approval number 09-38).
Results
Beads
The particle sizes of PS beads determined by DLS were 19.3 ± 1.0 nm (n = 11) for the 21 nm beads and 25.5 ± 1.0 nm (n = 11) for the 28 nm beads. The coefficients of within-run variation for the 21 and 28 nm beads were 5.1% and 3.8%, respectively, and those of between-run variation (n = 3) were 2.9% (19.2 ± 0.5 nm) and 6.2% (26.0 ± 1.6 nm), respectively. The mean sizes estimated in DLS measurements were smaller than those provided by the manufacturer by approximately 10%. The experimental values were used for calibration in the following experiments.
Lipoproteins isolated by ultracentrifugation and gel chromatography (Study 1)
The DLS measurements for each lipoprotein fraction isolated from the total lipoproteins (d < 1.225 kg/L) by Sepharose CL4B chromatography are presented in Figure 1. Similar results were obtained for all subjects examined. The distribution of DLS measurements was consistent with the elution profile of lipoprotein classes. Elution fraction #44, corresponding to the peak of apo B, or the major apolipoprotein of LDL, showed a DLS measurement of 21.9 ± 0.5 nm (mean ± SD). Elution fraction #53, corresponding to the peak of apo A–I, or the major apolipoprotein of HDL, showed a DLS measurement of 8.6 ± 0.6 nm. Between the LDL and HDL peaks, the average particle size decreased gradually along with the elution fraction numbers, indicating that LDL and HDL particles co-eluted in these fractions. The large standard deviations in this sizes region were due to the less number of particles than other elution numbers.
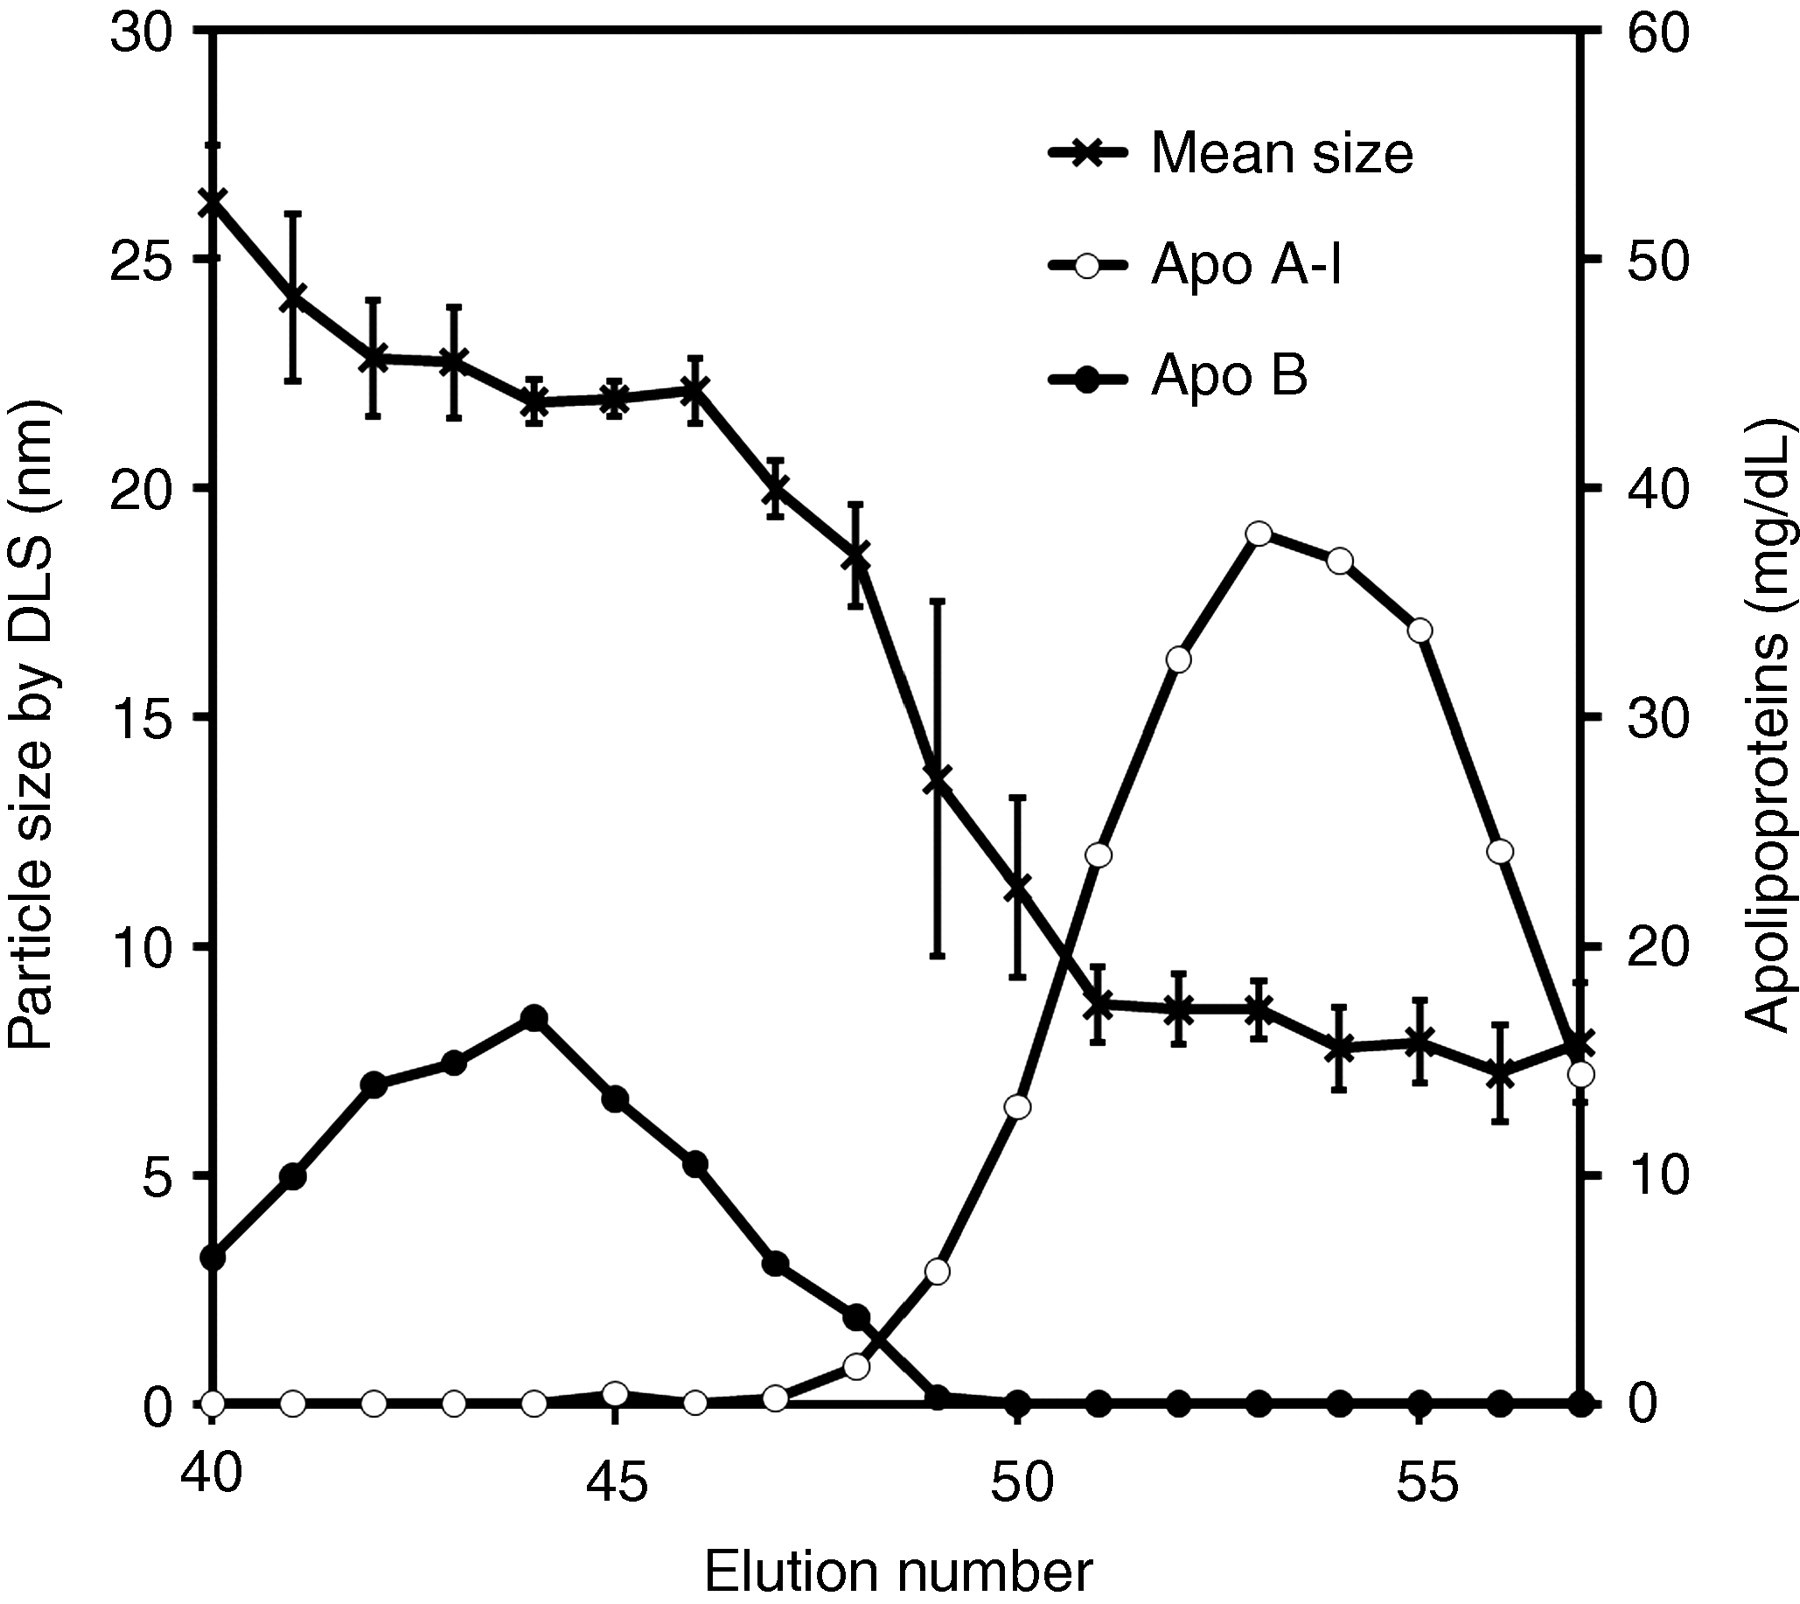
Elution profiles of apo B and apo A–I on the Sepharose CL4B column and lipoprotein size distribution measured by DLS. Lipoprotein particle sizes are expressed as the mean ± SD (n = 4). Apo B (closed circle, right scale); apo A–I (open circle, right scale); and lipoprotein particle sizes are measured by DLS (cross, left scale). DLS, dynamic light scattering
Lipoproteins isolated by sequential ultracentrifugation (Study 2)
The serum and lipoprotein fractions isolated by sequential ultracentrifugation, namely the CM + VLDL + IDL fraction (d < 1.019 kg/L), the large LDL fraction (d = 1.019–1.044 kg/L), the sd LDL fraction (d = 1.044–1.063 kg/L), the HDL fraction (d = 1.063–1.225 kg/L) and the non-Lp fraction (d > 1.225 kg/L), were well separated, as demonstrated by polyacrylamide gel electrophoresis (Figure 2). The average particle sizes determined by DLS for the 11 subjects were 13.1 ± 7.5 nm for serum, 37.0 ± 5.2 nm for CM + VLDL + IDL, 21.5 ± 0.8 nm for large LDL, 20.3 ± 1.1 nm for sd LDL, 8.6 ± 1.5 nm for HDL and 8.8 ± 2.0 nm for non-Lp (Figure 3), with significant differences among the fractions (Kruskal–Wallis test, P = 0.00000051). The particle sizes for the sd LDL fraction were significantly less than those for the large LDL fraction (P = 0.016). Similar particle sizes were obtained for the HDL and the non-Lp fractions. The particle sizes for the CM + VLDL + IDL fraction were correlated with serum TG levels (Rs = 0.93, P = 0.003, Figure 4).
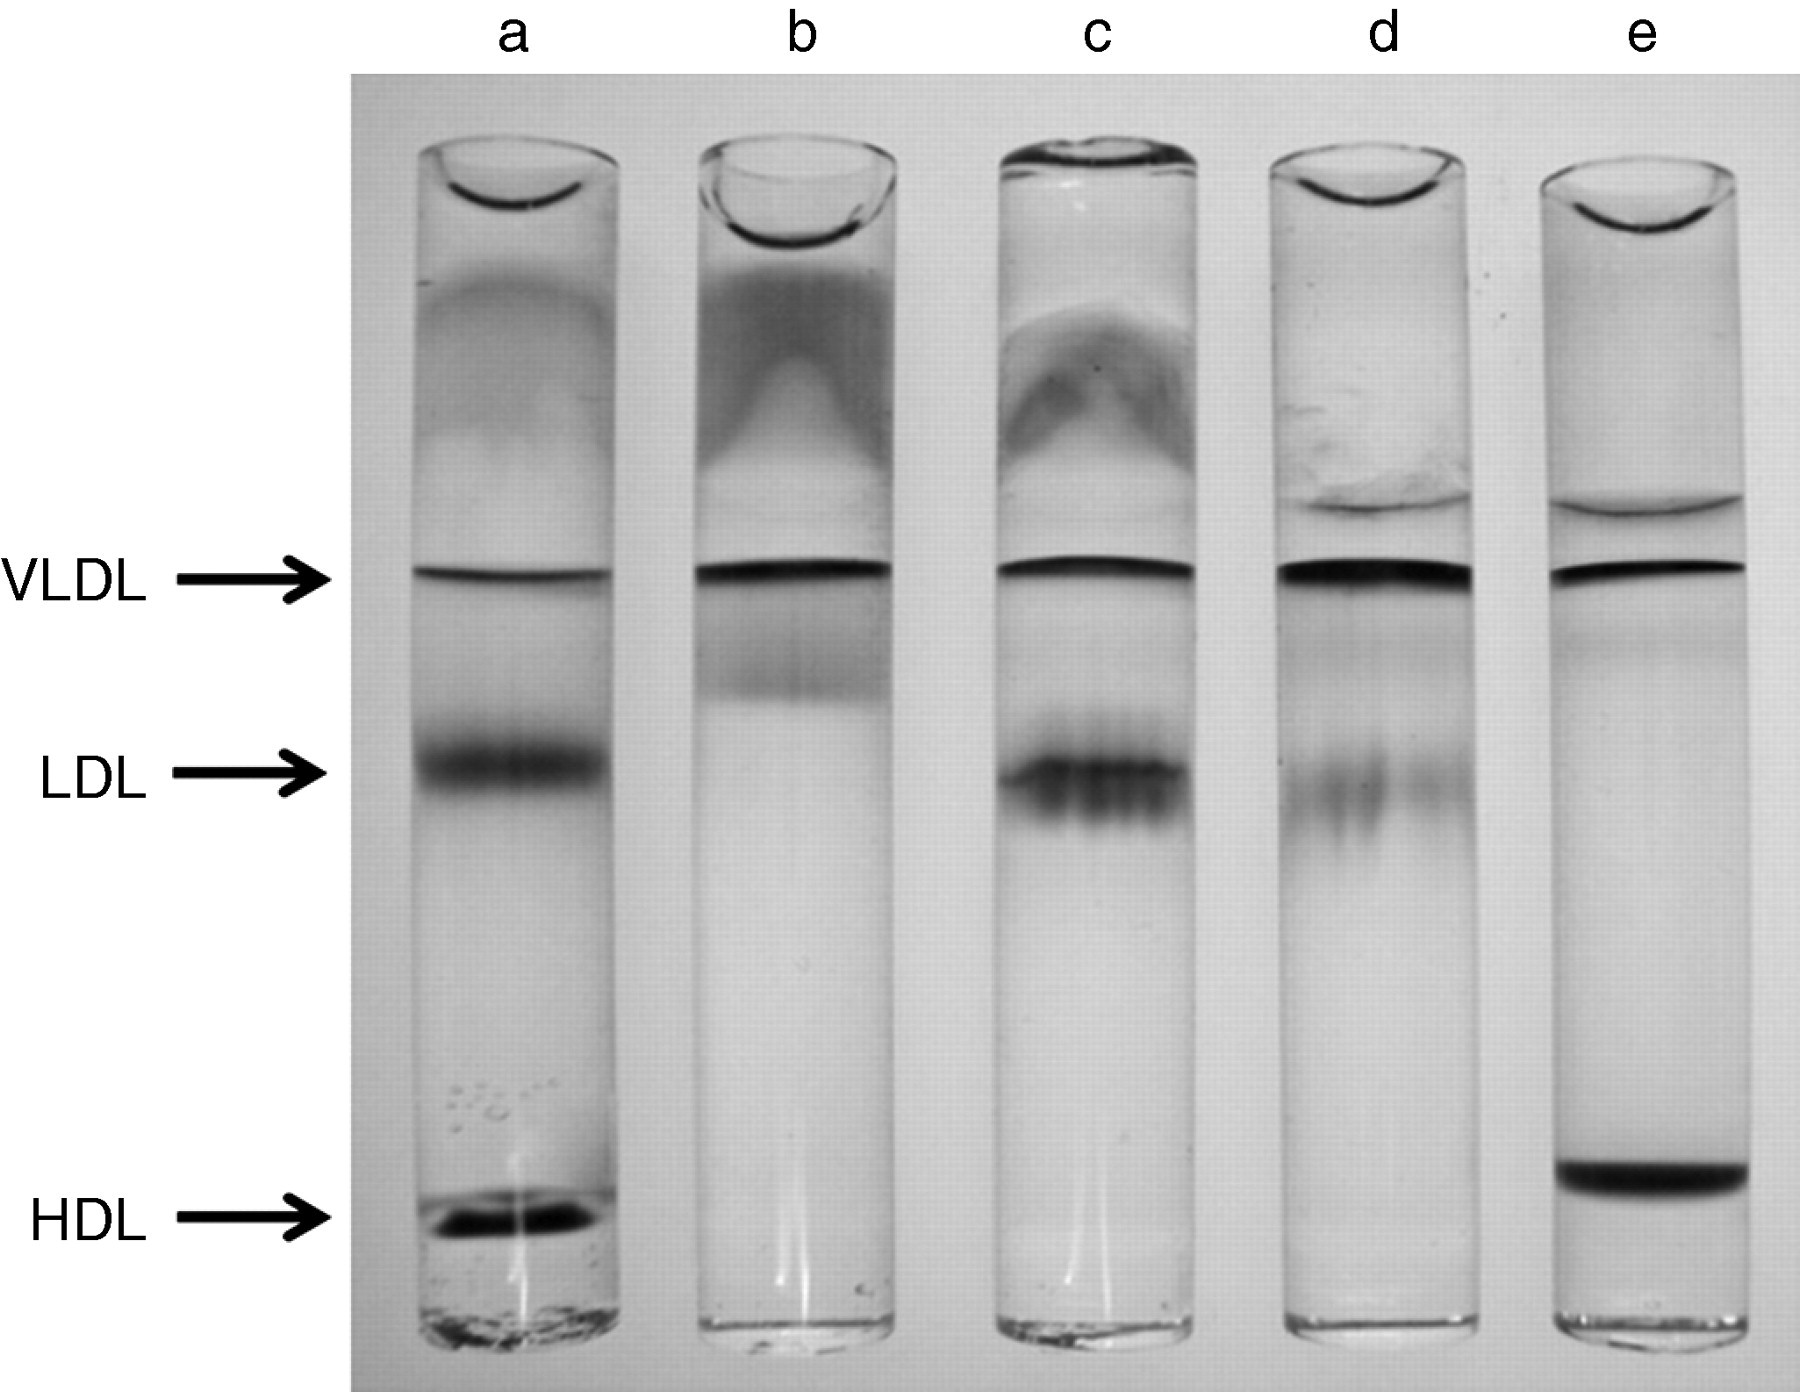
Typical electrophoretic patterns on polyacrylamide gel electrophoresis of lipoproteins isolated by sequential ultracentrifugation. a, Serum; b, CM-IDL fraction; c, large LDL fraction; d, sd LDL fraction; and e, HDL fraction. CM-IDL, chylomicron-intermediate-density lipoprotein
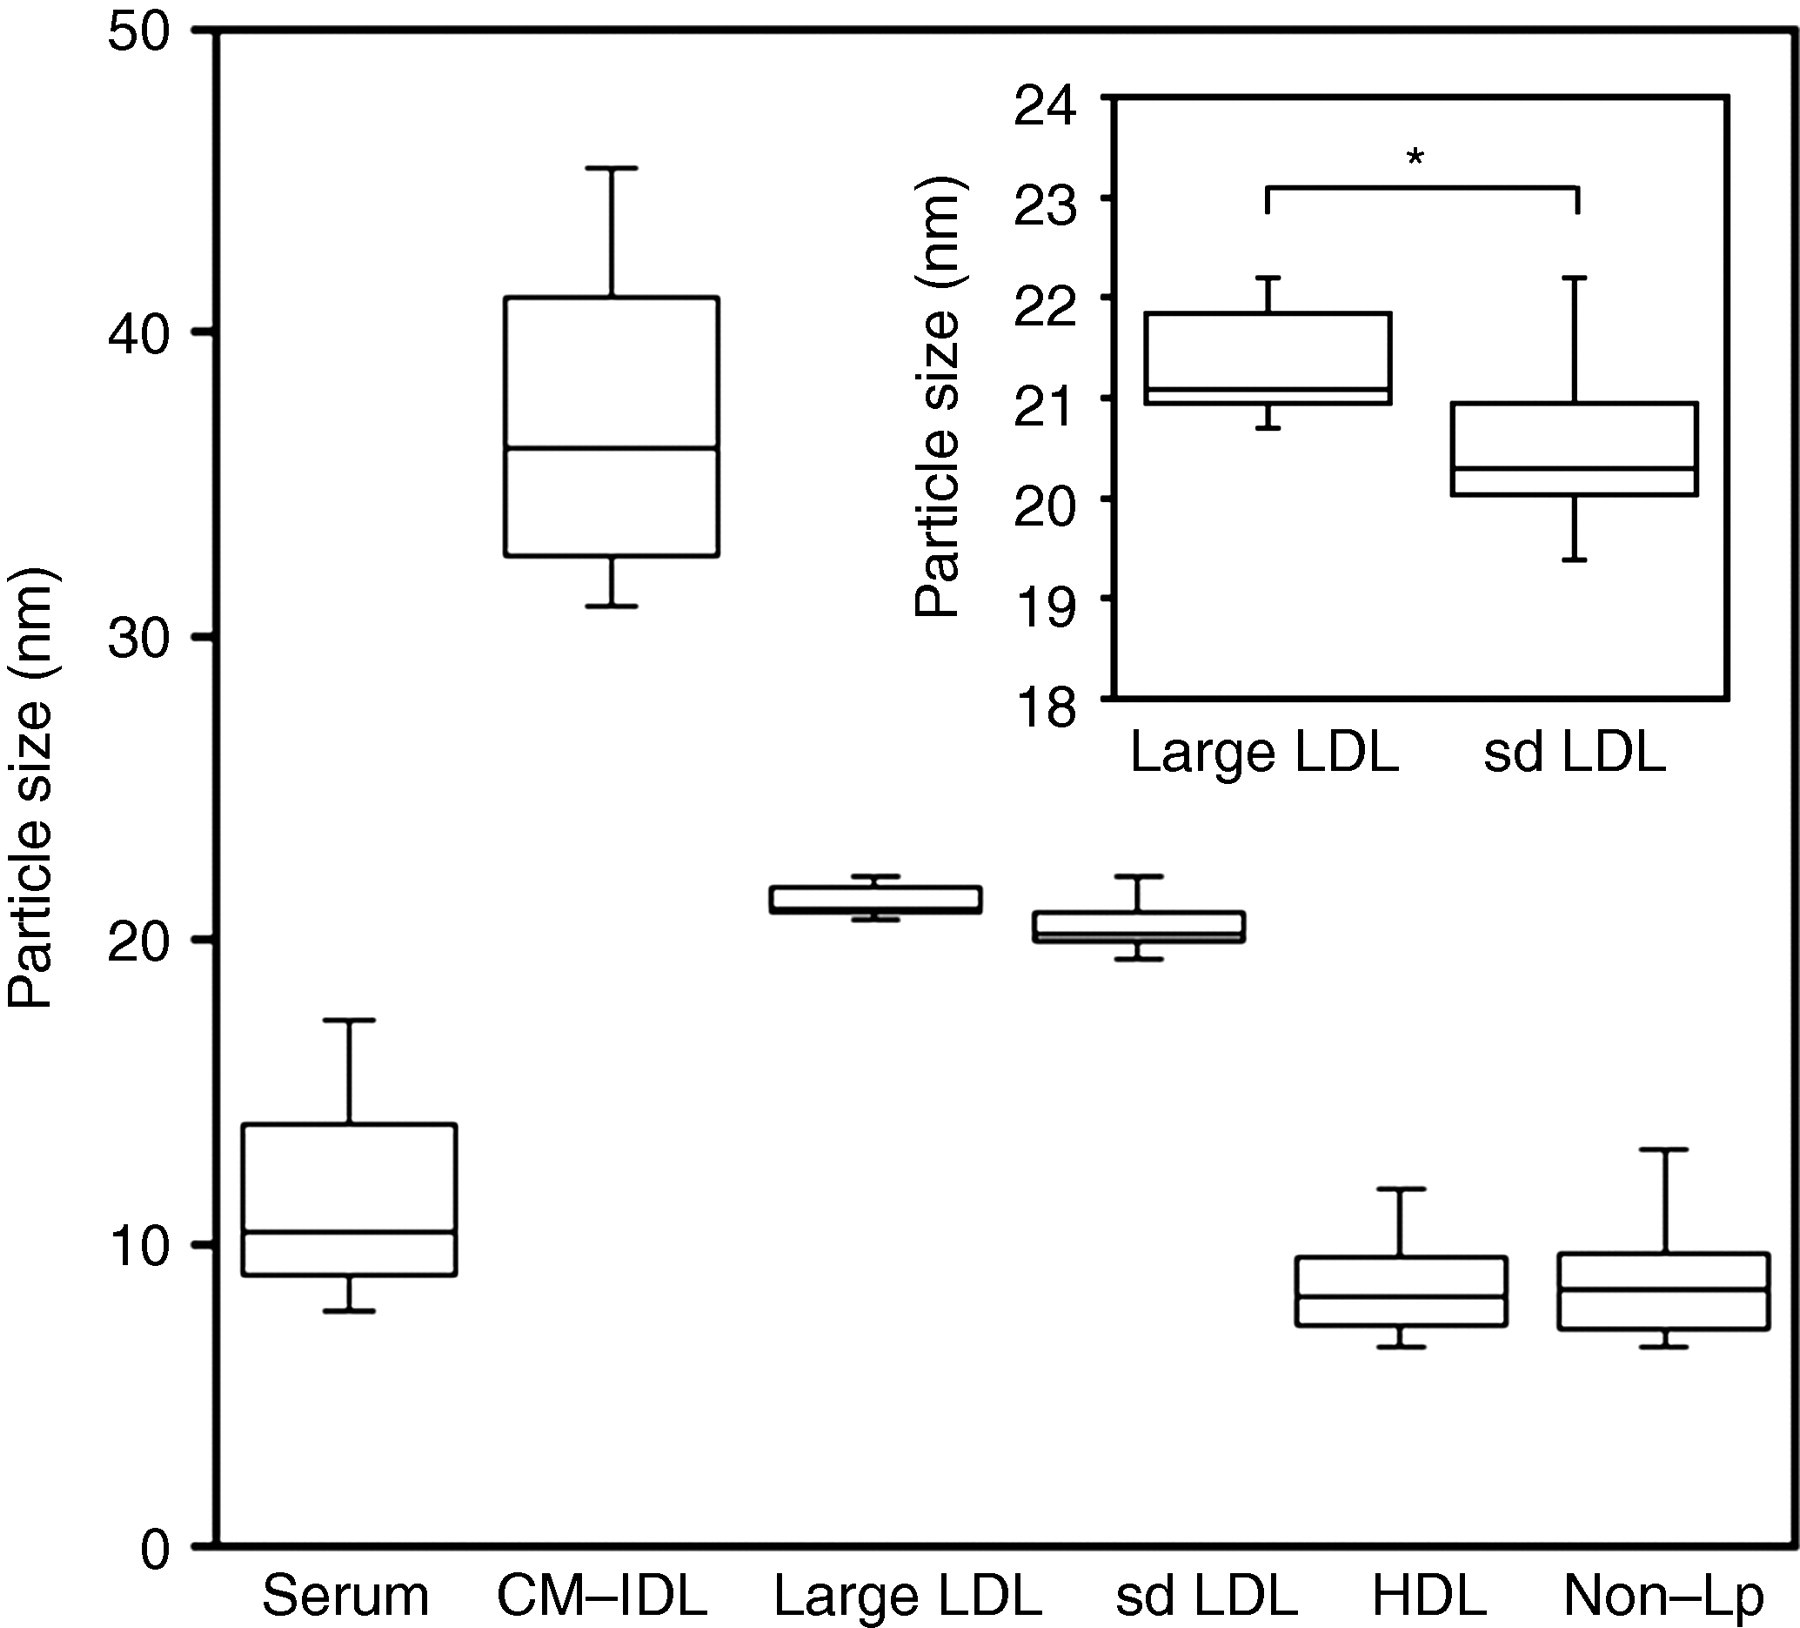
Lipoprotein particle sizes measured by dynamic light scattering after isolation by sequential ultracentrifugation (n = 11). The insert is the enlarged view for the large LDL and the sd LDL fraction (*P = 0.016). sd LDL, small, dense LDL; CM-IDL, chylomicron-intermediate-density lipoprotein
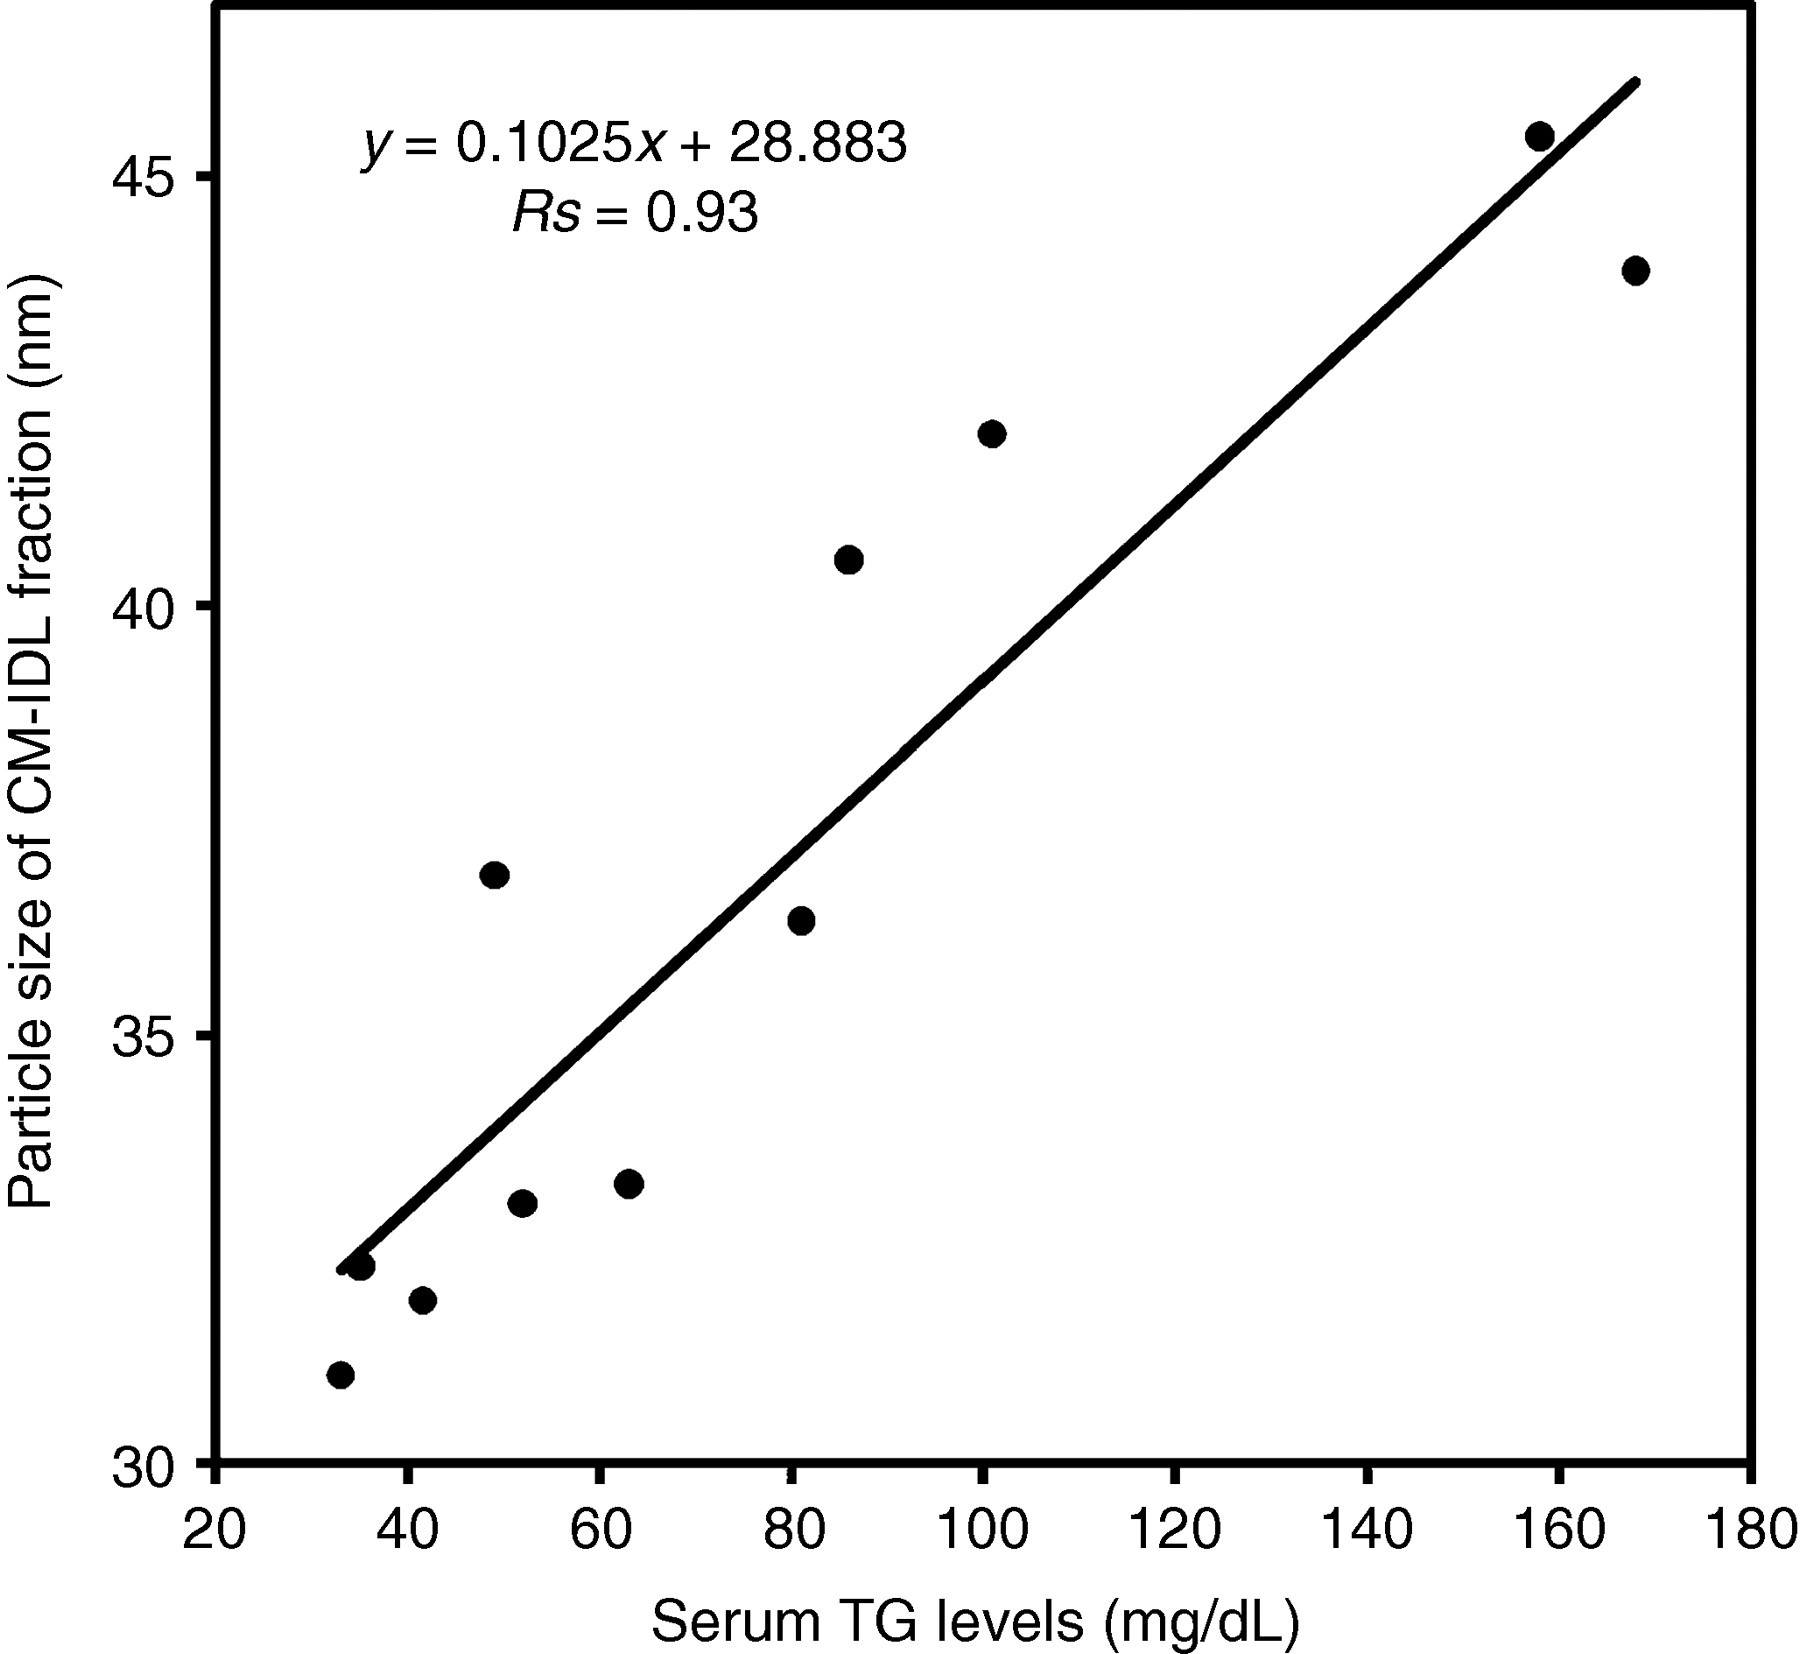
Correlation between the serum TG levels and the lipoprotein particle sizes of the CM-IDL fraction. The equation of regression line was y = 0.1025x + 28.883 (Rs = 0.93, P = 0.003). TG, triglycerides; CM-IDL, chylomicron-intermediate-density lipoprotein
Discussion
The estimation of particle sizes is possible by measuring the light-scattering intensity of the particles with the random movements, or Brownian motion. This method is called DLS, and has been applied to nanoparticles such as proteins, DNA, liposomes and detergent micelles. In our experimental system, particles ranging from 0.5 to 5000 nm in diameter are measurable. In general, DLS systems are small in size and easy to be set up on the benchtop, unlike other systems for measuring lipoprotein particle sizes, such as EM and NMR. Additionally, DLS is quick (i.e. analysis within a few minutes) and applicable to the particles in fluid, which is also advantageous for clinical use. One problem with DLS is that the larger particles have a greater effect on the total scattered intensity. 12,18 When a mixture of differently sized particles is measured, the average size estimated by the DLS measurement is susceptible to the change in large particles. Therefore, it is recommended to perform the DLS measurement with some separation technique to eliminate unnecessary large particles in biological specimens.
Our present experiments using the PS beads verified the reproducibility of DLS measurements. The discrepancy in the sizes of beads between our DLS measurements and the values provided by the manufacturer might be due to different methodological bases. Software for FDLS-3000 gives the size distribution of scatters against the size interpreted from the weight of the particles. It is referred to as the weight–size distribution. The size distribution against the size interpreted from the scattered light intensity is referred to as the intensity–size distribution. The weight–size distribution is much more sensitive for small particles compared with the intensity–size distribution. The latter has been reported to give larger mean sizes than the former. 15,16,19
The measurement of lipoprotein particle sizes has been conducted using GGE in many reports and by DLS in few reports. In a previous study using DLS, the LDL fraction isolated by ultracentrifugation was determined to have diameters of 22.9 ± 1.0 nm. 20 The particle sizes of LDL isolated by density gradient ultracentrifugation were reported as 23.1 ± 0.1 nm by DLS and 26.1 ± 0.1 nm by GGE, with a strong correlation between methods (r = 0.78). 12 GGE is known to give larger values than DLS, possibly because LDL can change its shape by interactions with the gel matrix and electric field. 8,12 The size of HDL isolated by a precipitation technique using polyethylene glycol was reported to be as large as 8.8 nm (mean) by DLS. 21 Other previous studies have reported LDL sizes of 21.1 ± 0.9 nm by NMR and 20–27 nm by EM, and HDL sizes of 9.1 ± 0.5 nm by NMR and 6–12 nm by EM. 22,23 Thus, the current results of 21.5 ± 0.8 nm for large LDL and 8.6 ± 1.5 nm for HDL are consistent with previous reports.
In addition to DLS and GGE, HPLC has been used for lipoprotein size estimation. Mean LDL and HDL particle sizes of 25.3 and 11.3 nm, respectively, have been reported. 24 In another study using HPLC, the LDL isolated by ultracentrifugation was measured as 25.5 ± 0.9 nm, with good correlation with the measurement by GGE in the same study (r = 0.88). 6 In terms of reproducibility, DLS (<6.2% in this study) is worse than HPLC (<1%) 6 and GGE (1–3.5%), 25–27 but seems acceptable for clinical use.
In the present study, we found no difference in the particle size between HDL and non-Lp (Figure 3). The non-Lp fraction contained many kinds of serum proteins, dominated by albumin and immunoglobulins. Most of these proteins are smaller than HDL, but some proteins, such as IgM, are as large as lipoproteins. Such large molecules should have raised the DLS measures for the non-Lp fraction.
Our CM + VLDL + IDL fraction actually contained only VLDL and IDL because the serum was sampled from normal young subjects after overnight fasting. The positive correlation between the serum TG levels and the DLS measurements for this fraction (Figure 4) indicates that the elevation of serum TG levels is associated with the increase in particle sizes of VLDL and IDL. Hence, the DLS measurement for TG-rich lipoproteins is useful to detect the delay in TG-rich lipoprotein metabolism.
In a previous study using GGE, the LDL sizes were compared between subjects with preponderance of large buoyant LDL (called pattern A by the authors) and the rest (pattern B); 28 the LDL diameters were 26.8 ± 0.3 and 25.1 ± 0.4 nm for patterns A and B, respectively. In our study, the diameters for the large LDL and the sd LDL fractions were 21.5 ± 0.8 and 20.3 ± 1.1 nm, respectively. As described above, this discrepancy can be explained by methodological differences. In a previous study using cryo-EM, the LDL particle sizes for the patterns A and B were 20.1 ± 1.7 and 17.9 ± 1.5 nm, respectively, which are similar to our results. 8 To the best of our knowledge, this is the first report of DLS measurements of isolated sd LDL.
In conclusion, DLS analysis is feasible for the measurement of particle sizes of isolated lipoprotein fractions. When DLS is coupled with a convenient isolation technique, the accurate and precise measurement of lipoprotein particle size could be possible in clinical laboratories. Further study on the clinical application of DLS is ongoing in our laboratory.
DECLARATIONS