
Abstract
Backgound
Serum 1,5-anhydroglucitol (1,5-AG) is a known marker reflecting recent glycaemic control. In this study, we examined serum 1,5-AG levels in chronic liver disease (CLD) patients with and without diabetes mellitus.
Methods
Eighty patients with CLD were compared with 667 subjects without CLD. Glycaemic control of the CLD patients was evaluated by estimated glycated haemoglobin (HbA1C) calculated using the equation by Rohlfing et al. from mean plasma glucose because CLD patients have apparently low HbA1C.
Results
When the study participants were divided into subgroups stratified by HbA1C levels, the CLD patients whose estimated HbA1C levels were less than 7.0% showed significantly lower 1,5-AG than their counterparts of the control subjects. Stepwise multivariable analysis revealed that estimated HbA1C was the significant explanatory variable for 1,5-AG in the CLD patients. However, in the CLD patients with estimated HbA1C less than 5.8%, only hepaplastin test was the significant explanatory variable for 1,5-AG.
Conclusions
Serum 1,5-AG levels are low irrespective of plasma glucose levels in the CLD patients with and without diabetes. The CLD patients who had low serum 1,5-AG levels were associated with deteriorated liver function.
Introduction
Since liver is an important organ regulating plasma glucose level, patients with chronic liver diseases (CLD) such as chronic hepatitis and liver cirrhosis frequently have abnormality of glucose metabolism. 1 Glucose tolerance test revealed that as much as 70–90% of CLD patients showed impaired glucose tolerance and 30–60% of these patients showed diabetes mellitus. 2 It is important to maintain a good glycaemic control status because it has been revealed that CLD patients whose plasma glucose level is inadequately controlled offer poor prognosis. 3
Currently, several measurements such as glycated haemoglobin (HbA1C), glycated albumin (GA), fructosamine and 1,5-anhydroglucitol (1,5-AG) are used as clinical markers for glycaemic control. However, it is demonstrated that CLD patients have apparently low HbA1C 4–6 due to shortened lifespan of erythrocytes, 7 which is caused by hypersplenism. Furthermore, since ability of albumin synthesis is impaired and half-life of serum albumin is prolonged in CLD patients, their serum GA levels appear to be high relative to glycaemia. 8,9 In addition, serum fructosamine is shown not to reflect glycaemic control properly in these patients. 6 Our previous studies suggest that CLD-HbA1C calculated from measured HbA1C and GA levels is a useful marker for glycaemic control in CLD patients. 10
Serum 1,5-AG is also a useful marker to detect accurately a slight change in plasma glucose levels without delay. 11 Yamagishi and Ohta 12 have reported that serum 1,5-AG levels are low in patients with liver cirrhosis. Their study included only patients with liver cirrhosis whose urinary glucose was negative. To our knowledge, there has been no study conducted so far investigating serum 1,5-AG levels in CLD patients complicated with diabetes mellitus. Thus, in this study, we examined serum 1,5-AG levels in CLD patients including those complicated with diabetes mellitus.
Methods
Patients and controls
We studied 80 patients with CLD (45 male and 35 female patients, mean age: 60.4 ± 9.2 years) hospitalized at Fukui-ken Saiseikai Hospital between January 1995 and December 1995 whose plasma glucose levels have been evaluated to be stabilized. 13 Patients who were unable to intake foods, those with renal disorders, those with excessive stress (fever, pain and diarrhoea) and those treated with interferon were not entered into this study, because these conditions are known to influence the determinants of HbA1C and 1,5-AG levels. Of these eligible 80 patients, 23 (29%) had diagnosed as overt diabetes mellitus by the American Diabetes Association criteria. 14 The classification of CLD was as follows: chronic active hepatitis: 21 patients, and liver cirrhosis: 59 patients. Liver cirrhosis was categorized using the Child-Pugh classification 15 as follows: Group A, n = 23; Group B, n = 22; and Group C, n = 14. The severity was assessed by histological examinations of the liver via laparoscopy or trans-dermal liver biopsy and abdominal computer tomography findings, in addition to biochemical liver function tests.
The controls included 667 subjects consisting of 558 subjects who had complete medical checkup without disease, and 109 outpatients with type 2 diabetes having stable glycaemic control state and neither complication of liver disorder nor renal disorder.
Laboratory measurements
Diurnal fluctuations of plasma glucose levels were examined for the study patients (measured 7 times a day; before and 2 h after every meal as well as at bedtime). The mean plasma glucose (MPG) was defined as average of the seven points of plasma glucose levels. At the same time, various plasma analyses such as cholinesterase, hepaplastin test, serum albumin, serum total cholesterol and platelet count, as well as measurement of HbA1C and 1,5-AG levels, were performed. HbA1C was measured using a high-performance liquid chromatography method (Arkray, Kyoto, Japan), while serum 1,5-AG was measured using Lana 1,5-AG Auto Liquid Kit using an enzymatic method (Nippon Kayaku, Tokyo, Japan).
Because CLD patients have apparently low HbA1C in relation to glycaemia, we used estimated HbA1C values, instead of ‘measured’ HbA1c, based on MPG data. Estimated HbA1C was calculated according to the conversion formula established by Rohlfing et al.
16
which was constructed on the basis of the DCCT database about MPG and HbA1C levels, as shown below:

In the CLD patients, estimated HbA1C instead of measured HbA1C was used for comparison with control subjects.
Statistical analyses
Data are shown as means ± SD. The significance of differences between two groups was calculated using Student's t-test. To evaluate the relationship between HbA1C or 1,5-AG levels and other variables, single linear univariate regression analyses and stepwise multivariate regression analyses were performed. For the stepwise multivariate regression analyses, the explanatory variables were age, measured HbA1C, MPG, cholinesterase, hepaplastin test, serum total cholesterol and platelet count. The F value for the inclusion of the variables was set at 1.0. The Stat View computer program (Version 5.0 for Windows; Abacus Concepts, Berkeley, CA, USA) was used for all statistical analyses. A P value of <0.05 was considered statistically significant.
Results
In 667 control subjects, measured HbA1C and serum 1,5-AG (logarithmically converted) showed strongly significant inverse correlation (R = −0.809, P < 0.0001). In 80 CLD patients, there was also inverse correlation between estimated HbA1C and serum 1,5-AG (logarithmically converted) (R = −0.820, P < 0.0001) (Figure 1). However, the regression line in the CLD patients was shifted downward compared with that in the control subjects (y = −0258x + 2.48 for CLD patients versus y = −0.245x + 2.59 for controls). These results indicate that in the CLD patients 1,5-AG was set lower relative to HbA1C. Next, the study subjects were stratified by HbA1C levels into six subgroups (4.0–4.9%, 5.0–5.9%, 6.0–6.9%, 7.0–7.9%, 8.0–8.9% and 9.0% or above), and serum 1,5-AG levels of each subgroup were compared between the CLD patients and the control subjects (Figure 2). As an adequate glycaemic control marker in CLD patients, estimated HbA1C was used in the CLD patients and measured HbA1C was used in the control subjects. Serum 1,5-AG levels in the CLD subgroups with HbA1C <7.0% was significantly lower than that of the control subgroups with HbA1C <7.0%. Serum 1,5-AG levels in the CLD subgroups with estimated HbA1C ≥7.0% were lower than that of the control subgroups with HbA1C ≥7.0%, although they failed to reach statistical significance.
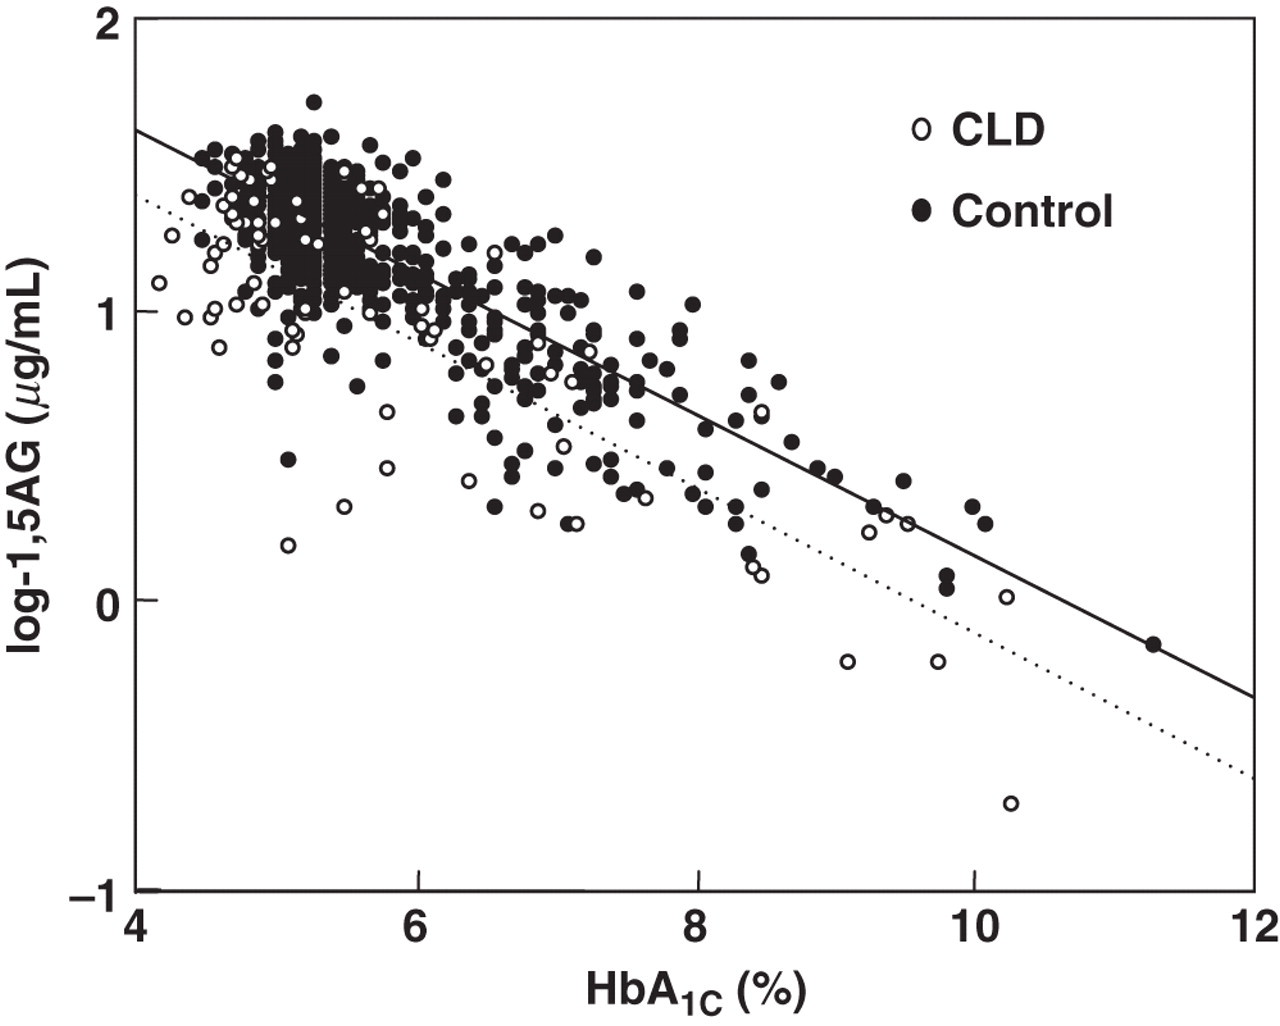
Correlation between HbA1C and serum 1,5-AG (logarithmically converted). The figure indicates correlation between estimated HbA1C and serum 1,5-AG in the CLD patients (○) and between measured HbA1C and serum 1,5-AG in the control subjects (•).1,5-AG, serum 1,5-anhydroglucitol; CLD, chronic liver disease; HbA1C glycated haemoglobin
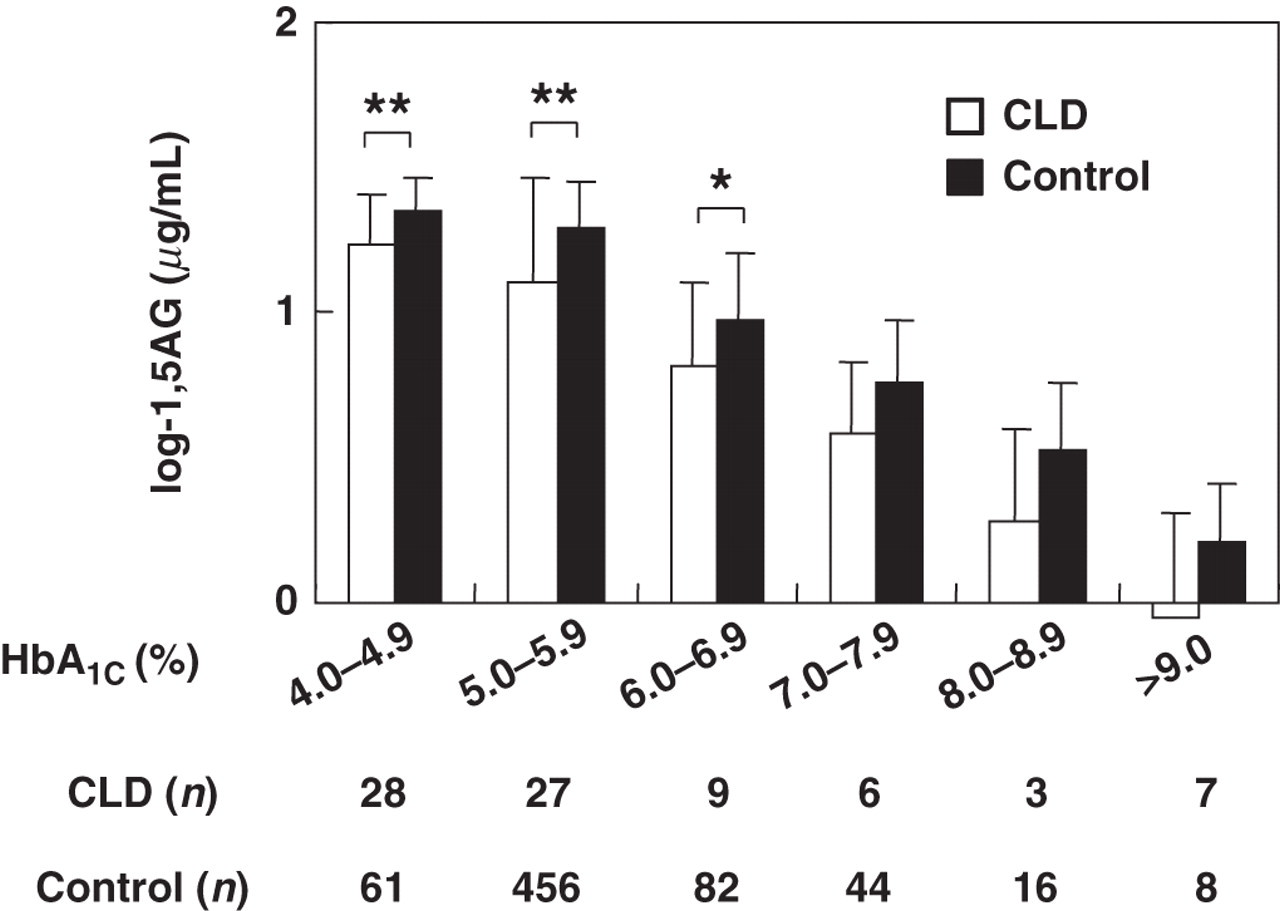
Comparison of serum 1,5-AG between CLD patients and control subjects stratified by HbA1C. The CLD patients (□) and the control subjects (▪) were stratified by estimated HbA1C levels and by measured HbA1C levels, respectively. Serum 1,5-AG of each subgroup was compared. The figure shows the number of patients by HbA1C levels in the CLD subgroups and the control subgroups. *P < 0.05, **P < 0.0001, versus control subjects. 1,5-AG, serum 1,5-anhydroglucitol; CLD, chronic liver disease; HbA1C glycated haemoglobin
In multivariable analysis using age, measured HbA1C, MPG, cholinesterase, hepaplastin test, serum total cholesterol and platelet count as explanatory variables, MPG was found to be a significant explanatory variable for serum 1,5-AG in all the CLD patients. On the other hand, when multivariate regression analysis was conducted in 52 patients with estimated HbA1C <5.8%, hepaplastin test was the significant explanatory variables for serum 1,5-AG (Table 1).
Stepwise multivariate regression analysis on serum 1,5-AG (logarithmically converted) in 80 CLD patients (a) and in 52 CLD patients with estimated HbA1C <5.8% (b)
1,5-AG, serum 1,5-anhydroglucitol; CLD, chronic liver disease; MPG, mean plasma glucose; HbA1C glycated haemoglobin
*Stepwise multivariable regression analysis was conducted in 80 CLD patients, using serum 1,5-AG (logarithmically converted) as a response variable, and age, measured HbA1C, MPG, cholinesterase, hepaplastin test, serum total cholesterol and platelet count as explanatory variables. R 2 = 0.684, F = 52.1 and P < 0.0001 in the stepwise multivariate regression analysis
†Stepwise multivariable analysis was conducted in 52 CLD patients with estimated HbA1C <5.8%, using serum 1,5-AG (logarithmically converted) as a response variable, and age, measured HbA1C, MPG, cholinesterase, hepaplastin test, serum total cholesterol and platelet count as explanatory variables. R 2 = 0.275, F = 8.7 and P = 0.0006 in the stepwise multivariable regression analysis
There was a significant inverse correlation between serum 1,5-AG and MPG (R = −0.820, P < 0.0001) in the all CLD patients, whereas hepaplastin test was not correlated with serum 1,5-AG (Figure 3a and b). Although in the CLD patients with estimated HbA1C <5.8% there was no significant correlation between serum 1,5-AG and MPG, hepaplastin test was significantly correlated with 1,5-AG (R = −0.496, P < 0.0001) (Figure 3c and d).
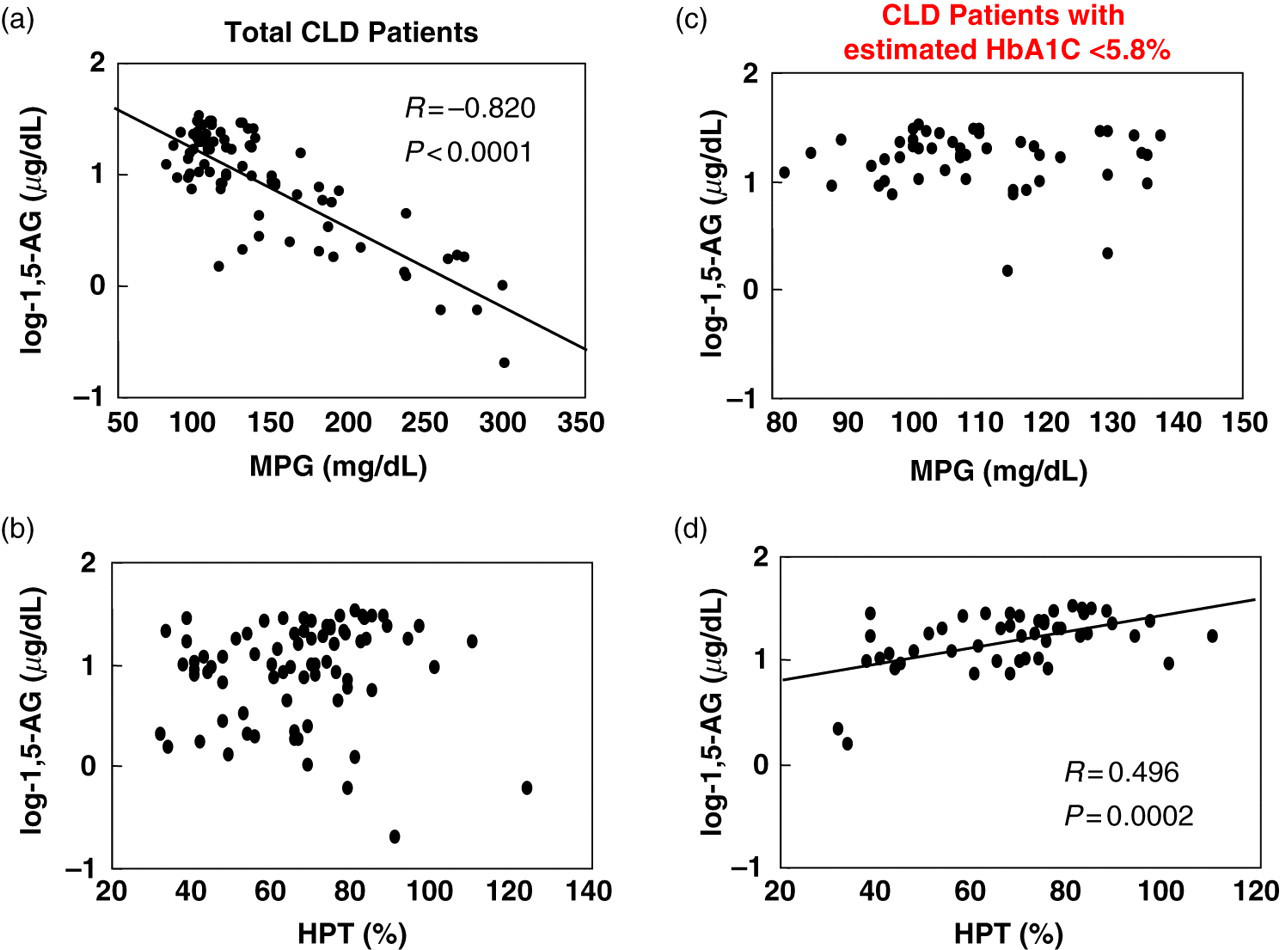
Correlation between estimated HbA1C or hepaplastin test and serum 1,5-AG in the CLD patients. Correlation was examined between MPG (a, c) or hepaplastin test (b, d) and serum 1,5-AG, in the all CLD patients (n = 80, a, b) and in the CLD patients with estimated HbA1C <5.8% (n = 52, c, d). 1,5-AG, serum 1,5-anhydroglucitol; CLD, chronic liver disease; MPG, mean plasma glucose; HbA1C glycated haemoglobin
Discussion
Our study revealed that serum 1,5-AG levels are low irrespective of plasma glucose levels in CLD patients. These were observed in CLD patients including those with diabetes mellitus. In the present study, serum 1,5-AG levels in the CLD patients with estimated HbA1C <7.0% were significantly lower than those in the control subjects with estimated HbA1C <7.0%, whereas 1,5-AG levels in the CLD patients with estimated HbA1C ≥7.0% were not significantly different from those in the control subjects with estimated HbA1C ≥7.0%. This is possibly due to the fact that the study included a relatively small number of patients with estimated HbA1C ≥7.0%.
Several mechanisms may be involved in our observations of lower serum 1,5-AG levels irrespective of plasma glucose levels in CLD patients. It is known that 1,5-AG is biosynthesized in the liver, and thus deteriorated liver function may decrease 1,5-AG synthesis in the liver. However, according to Yamanouchi et al. 17 most of circulating 1,5-AG originates from orally assimilated food, so that the decreased hepatic synthesis may not mostly contribute to the lowered serum 1,5-AG levels in CLD patients. It is suggested that fasting plasma glucose levels in CLD patients with diabetes mellitus are normal or low, while their postprandial plasma glucose levels are frequently high. 18 This may result in lower serum 1,5-AG because serum 1,5-AG highly reflects elevated postprandial plasma glucose levels. 11 However, Yamagishi and Ohta 12 observed lower serum 1,5-AG levels in patients with negative urinary glucose. Therefore, elevated postprandial plasma glucose levels per se cannot explain the mechanism of lower serum 1,5-AG levels in CLD patients.
It is known that patients with liver cirrhosis develop hypouricaemia by increased clearance of uric acid associated with renal tubular dysfunction. 19–21 Thus, in patients with disturbance of proximal tubules reabsorption of uric acid is inhibited, resulting in hypouricaemia. 22 Both uric acid and 1,5-AG are reabsorbed in renal proximal tubules. Recently, we found a strong correlation between serum uric acid and 1,5-AG levels in subjects with normal glucose tolerance, suggesting a regulatory mechanism common in reabsorption processes between these two molecules. 23 Taken together, lower serum 1,5-AG levels as well as lower serum uric acid levels may be caused by impaired tubular function in CLD patients. In this relation, it has been shown that serum 1,5-AG levels and serum uric acid levels are low in patients receiving prolonged total parenteral nutrition, which may be caused by impaired renal tubular function. 24,25 Furthermore, it is indicated that hypouricaemia in patients with liver cirrhosis improves with recovery of liver function accompanied by decrease in excretion of uric acid. 21 It is intriguing whether serum 1,5-AG levels may increase along with improvement of liver function in these patients. In order to clarify whether renal tubular dysfunction lowers serum 1,5-AG in CLD patients, urinary excretion of 1,5-AG in CLD patients should be investigated in the future.
In the CLD patients with estimated HbA1C <5.8%, there was no significant correlation between serum 1,5-AG and estimated HbA1C. These results may be caused by the fact that CLD patients without diabetes mellitus excrete little glucose in urine and thus glycaemic control itself exerts little effect on serum 1,5-AG levels. In subjects with normal glucose tolerance, this phenomenon was reported previously. 23 By contrast, under these conditions where serum 1,5-AG levels are not influenced by glycaemic control, the correlation between serum 1,5-AG and hepaplastin test, a marker of liver function, was clearly observed in the CLD patients. The result suggests that in non-diabetic CLD patients, serum 1,5-AG mainly reflects hepatic function.
This study, together with the previous studies, indicates that serum 1,5-AG levels do not properly reflect glycaemic control in CLD patients. It is already known that HbA1C, GA and fructosamine do not correctly reflect glycaemic control status in CLD patients. 5–9 We have recently shown that CLD-HbA1C, as the average of HbA1C and GA/3, can be used as a marker that reflects glycaemic control status in CLD patients. 10 At present, this measure is thought to be the best marker that represents glycaemic controls in CLD patients with diabetes mellitus.
DECLARATIONS