
Abstract
Background
The existing methods for quantitative analysis of free corticosteroids require high volume of plasma and laborious extraction processes. Development of ultrafiltration followed by the liquid chromatrography tandem mass spectrometry (LC-MS/MS) method that requires 300 μL of plasma, does not entail any offline extraction and achieves good sensitivity was described.
Methods
Unbound corticosteroids were separated by the ultrafiltration of plasma using Microcon® centrifugal filter devices (10,000 Dal nominal molecular weight limit). A 30 μL aliquot of the ultrafiltrate was directly injected into a two-dimensional high-performance liquid chromatography clean-up and separation system coupled with API-4000 mass spectrometer. The clean-up was performed on a Strata-X on-line extraction cartridge. A Zorbax-SB Phenyl, Rapid Resolution HT (2.1 × 100 mm) column was employed to chromatographically resolve cortisol and prednisolone from each other, from cortisone and prednisone as well as from interferences found in plasma from stable kidney transplant recipients.
Results
Intra- and inter-run imprecision and inaccuracy within ±15% were achieved during a three-batch validation for quality control samples at six concentrations in ultrafiltrate from charcoal-stripped plasma and three concentrations from normal plasma, over a 2000-fold dynamic range. The lower limit of quantification was 0.100 ng/mL for all four corticosteroids.
Conclusions
A highly selective, sensitive, simple and robust LC-MS/MS method was developed for the simultaneous quantification of free cortisol, cortisone, prednisolone and prednisone. The performance of the Strata-X on-line extraction cartridge was maintained for over 700 injections. The assay was successfully applied for the analysis of the analytes in over 500 plasma samples from stable kidney transplant recipients.
Introduction
Corticosteroids have been clinically used for almost 50 y. Assessing the plasma concentration of prednisolone, endogenous cortisol and their inactive metabolites, prednisone and cortisone, may assist in the evaluation of therapeutic response to corticosteroids or their side-effects. All the four compounds are highly bound to plasma proteins. It is commonly accepted that unbound corticosteroids are biologically active, because they are available for active receptor binding. For drugs with a bound fraction greater than 80%, measuring unbound rather than the total (sum of bound and unbound) concentration, is generally the preferred method of monitoring. 1–4 If a compound exhibits a linear binding pattern, in which the unbound fraction (f U) remains independent of the total concentration, a single-point measurement of the f U and extrapolation by total concentration will allow estimation of free concentration during the drug dosing interval. However, for compounds that exhibit a saturable binding pattern, direct measurement of free concentration is necessary.
Corticosteroids are bound with high affinity but low capacity to corticosteroid binding globulin (CBG) and with low affinity but high capacity to albumin. 5–8 Plasma protein binding of cortisol and prednisolone in their physiological or therapeutic ranges is therefore saturable. In addition, the two compounds compete for the same binding site, thus affecting their degree of protein binding reciprocally. 9 Nomograms that take into consideration the concentrations of albumin, CBG, total cortisol and total prednisolone have been developed and used to estimate the unbound concentrations of cortisol or prednisolone. 1,9–12 When multiple medications are administered, drugs with high affinity for plasma proteins may displace cortisol and prednisolone and it becomes more difficult to reliably estimate the free fraction based on a nomogram. 13 For these reasons, measurement of free compounds in each of the biological samples collected over a suitable time interval is preferable for subjects who receive multiple concomitant medications, such as transplant recipients.
Ultrafiltration and equilibrium dialysis are the most commonly used separation methods for the measurement of unbound concentration. 14,15 Trace amounts of the radioactive isotope of the compound under investigation [3H]-cortisol or [3H]-prednisolone 4,16–18 or of a surrogate chemical moiety such as [14C]-glucose 19 have been employed in the past. Dialysis involves an equilibration step of approximately 6–18 h 7,20 while ultrafiltration requires 30–60 min equilibration and a 10–30 min centrifugation step. 18,19 Centrifree® ultrafiltration devices (Millipore, Bedford, MA, USA) have been employed for separating corticosteroids; 16,17,21,22 however, the small diameter of the sample reservoir makes the device difficult to load and therefore it is not amenable to automation. Microcon® centrifugal filter devices (Millipore, Bedford, MA, USA) are similar separation devices which can hold up to 0.5 mL of a biological specimen such as plasma. Samples can be easily loaded onto Microcon® centrifugal filter devices using automated liquid handlers and they have been used previously for isolating the free fraction of corticosteroids from plasma. 23
Previously published methods using liquid–liquid extraction, 22,24 protein precipitation, 23 radioimmunoassay 19 and detection by high-performance liquid chromatography (HPLC)-ultraviolet (UV) 22 or gas chromatography–MS 12 have high limits of quantification and involve laborious extraction and derivatization steps. On-line extraction methods for measuring cortisol in serum have been previously reported, but either no separation between cortisol and prednisolone was achieved with cortisol eluting at 28 min, 15 or a protein precipitation step preceded the on-line extraction. 25,26 Liquid chromatography tandem mass spectrometry (LC-MS/MS) is currently the preferred method of analysis due to its sensitivity and selectivity, which usually does not require extensive chromatographic separation, thus reducing the analysis time considerably. However, cortisol and prednisolone must be chromatographically separated from each other and from their main metabolites, cortisone and prednisone, when MS is used as the detection method. 27,28 Chromatographic separation of cortisol and prednisolone had been achieved previously under 10 min, using normal phase chromatography, generally incompatible in conjunction with MS. 29
In the present study, we describe a highly sensitive, yet simple method for the accurate measurement of unbound cortisol, cortisone, prednisolone and prednisone in human plasma. The assay utilizes a reproducible ultrafiltration method which requires only 0.3 mL of plasma, followed by direct injection of the ultrafiltrate into the HPLC with a short on-line clean-up prior to analysis by LC-MS/MS during a runtime under 10 min.
Experimental
Materials
In addition to the materials specified in our previous publication, 27 Microcon® centrifugal filter devices with Ultracel® YM-10 membrane (10,000 Dal nominal molecular weight limit) were purchased from Millipore (Bedford, MA, USA).
Equipment
A Beckman Coulter, Allegra 6R (Palo Alto, CA, USA) centrifuge, a temperature-controlled Eppendorf 5417R microcentrifuge from Brinkman Instruments Inc. (Westbury, NY, USA) with a fixed-angle rotor (FA45-30-11), a Labnet VorTemp 56 incubator from Labnet International (Windsor, Berkshire, UK), 1.2-mL polypropylene 96-well plates from Beckman Coulter Inc. (Fullerton, CA, USA) and Micromat II/PS Round mats (Rockwood, TN, USA) were used. Furthermore, regular laboratory glassware and electronic pipettes and vortex mixers were utilized. An API-4000 triple quadrupole mass spectrometer with a TURBO V™ source and a TurboIonSpray® probe (AB Sciex, Concord, Ontario, Canada) was used for mass analysis and detection.
Chromatographic conditions
A Zorbax-SB Phenyl, Rapid Resolution HT (2.1 × 100 mm) column with a 1.8-μm particle size from Agilent Technologies (Wilmington, DE, USA), kept at a constant temperature of 37°C, was used for chromatographic separation. Sample clean-up was performed on a Strata-X 25 μm on-line extraction cartridge 20 × 2.0 mm (Phenomenex, Torrance, CA, USA), preceded by 0.5 μm porosity analytical in-line solvent filter from Upchurch Scientific (Oak Harbor, WA, USA) placed in a holder. A Shimadzu Prominence HPLC system series 20A/AC from Shimadzu USA Manufacturing Inc. (Canby, OR, USA) was used to inject 30 μL of the extracted samples and to deliver the mobile phase. Mobile phase A composition was 5% acetonitrile in water and was delivered with a flow of 0.500 mL/min. Mobile phase B composition was acetonitrile-water-formic acid (32:68:0.1, by vol.) and was delivered with a flow of 0.140 mL/min, during a runtime of 9.5 min. A six-port switching valve from Valco Instrument Co. Inc. (Houston, TX, USA) was used to create a three-step mobile phase delivery method. During the first and third steps, the flow from mobile phase A was directed into the on-line extraction cartridge, while mobile phase B was delivered through the analytical column. During the second step (0.8–2.0 min), the flow from the mobile phase B was redirected to back-flush the extraction cartridge into the analytical column, while mobile phase A was directed to waste. A diagram illustrating the connections during the three steps is illustrated in Figure 1.
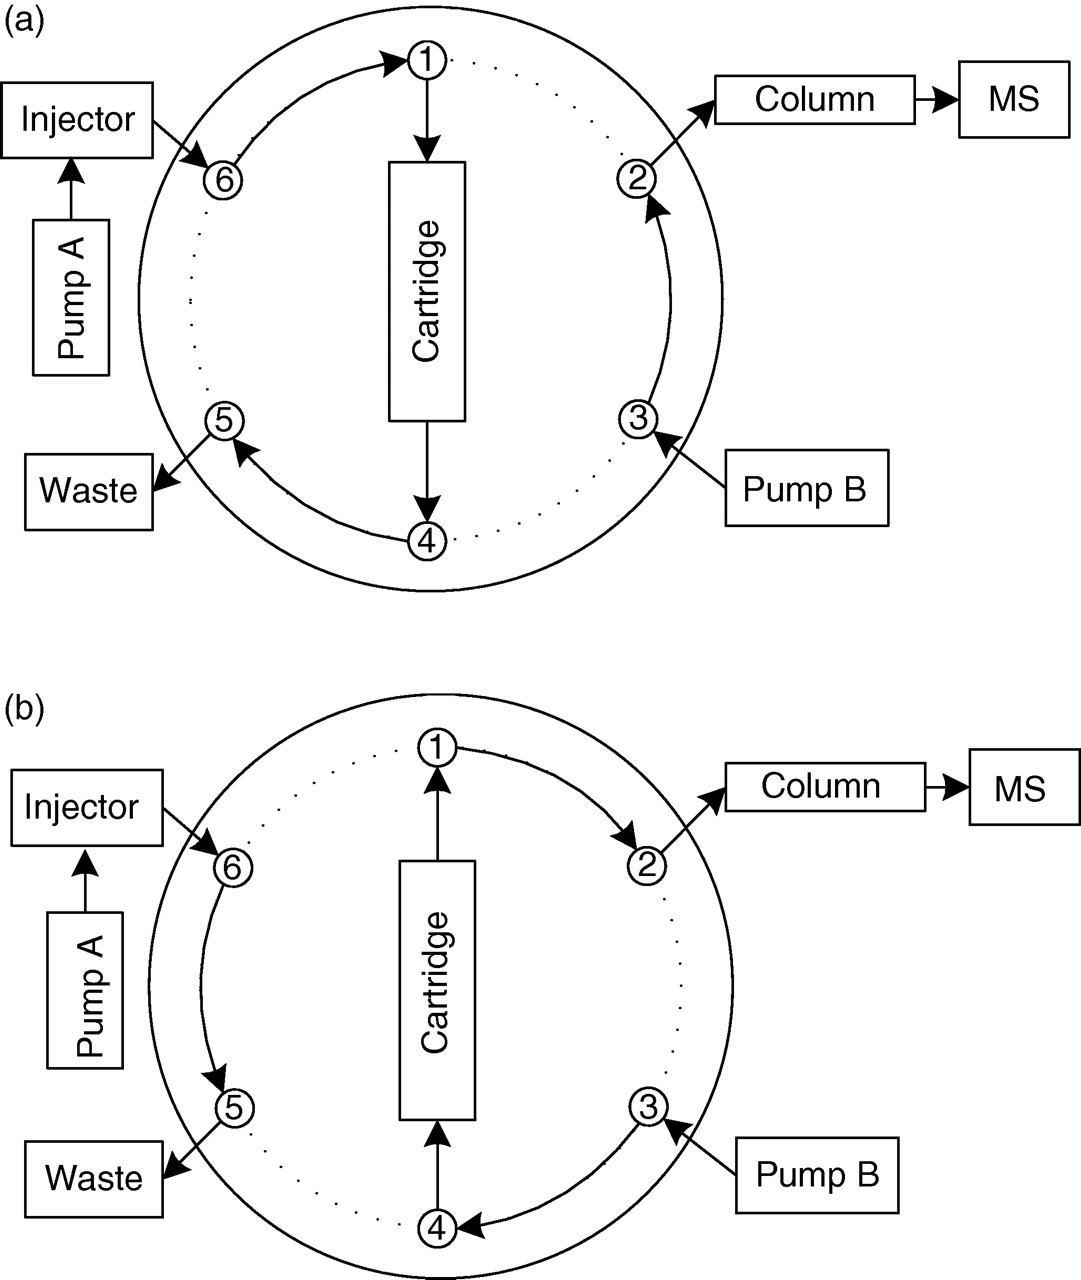
Schematic diagram of the on-line clean-up liquid chromatrography tandem mass spectrometry (LC-MS/MS) system. (a) Valve position during steps 1 (0–0.8 min) and 3 (2.0–9.5 min); (b) valve position during step 2 (0.8–2.0 min). Salts are flushed out of the cartridge during step 1 with a 95% aqueous solution. Compounds are back-flushed from the cartridge into the column where they are separated with mobile phase B
Mass spectrometric conditions
The optimization of the compound-specific parameters of the mass spectrometer and the final multiple reaction monitoring transitions are detailed in a previously published paper. 27 In short, the following m/z multiple reaction monitoring transitions (precursor → product ion) were selected: 363.1 → 327.2 and 363.1 → 121.1 for cortisol, 367.2 → 331.2 for [2H4]-cortisol, 361.2 → 325.0 for prednisolone, 368.2 → 330.6 for [2H6]-prednisolone, 359.2 → 313.2 for prednisone, 361.2 → 163.2 for cortisone and 368.2 → 169.1 for [2H7]-cortisone (also used as the internal standard for prednisone).
Sample preparation
Stock solutions with a concentration of 1.00 mg/mL for each of the four compounds in duplicate and 0.100 mg/mL for each stable isotope labeled internal standard were prepared in methanol and stored at 4°C. The internal standard working solution (ISWS) containing a mixture of all three internal standards with individual concentration of 50.0 ng/mL was prepared in 50% acetonitrile in water. Intermediate stock solutions combining all four compounds to achieve final concentration of 20.0 μg/mL were prepared in methanol, and used to spike 10 calibration standards in water (concentration ranging from 0.100 to 200 ng/mL) and quality control (QC) samples in biological matrix. Commercially available, four times charcoal-stripped plasma was further stripped in our laboratory as explained elsewhere 27 and an ultrafiltrate was obtained and used to prepare the first set of QC samples fresh daily. The ultrafiltrate from a pool of normal, non-stripped plasma with low concentration of endogenous cortisol and cortisone was used to prepare a second set of QC samples which were analysed fresh. A third set of QC samples was prepared in normal, non-stripped plasma at two concentration levels and used for freeze–thaw or long-term stability tests.
Sample extraction
Calibration standards in water and QC samples in the ultrafiltrate were prepared fresh daily. QC samples prepared in plasma, blank plasma samples and samples from treated subjects were thawed at room temperature and vortex mixed. Aliquots of 300 μL of each plasma sample were transferred into individual Microcon® centrifugal filter devices, which were then capped and equilibrated for 60 min at 37°C and 35 rotations per minute in the incubator. The microcentrifuge was preheated at 37°C by running it empty for ∼15 min prior to loading the filtration devices. In order to maintain the plasma samples at constant temperature, the filtration devices were immediately loaded from the incubator into the microcentrifuge and were centrifuged at 37°C and 10,000
Method validation
The most recent recommendations outlined by the Food and Drug Administration of the United States of America 30 were followed during validation. While the calibration standards were prepared in water as a substitute matrix, three sets of QC samples in different types of matrices were used to validate the method. One set with six concentration levels was prepared in the ultrafiltrate obtained from charcoal-stripped plasma. A second set with three concentration levels was prepared in the ultrafiltrate from non-stripped plasma, which is free of interference for prednisolone and prednisone, and has quantifiable baseline concentration levels of cortisol and cortisone, used to calculate the final concentrations at each level. A third set of QC sample with two concentration levels of 10.0 and 100 ng/mL prednisolone and prednisone was prepared in normal plasma containing endogenous levels of cortisol and cortisone of ∼50 and 10 ng/mL, respectively. Four QC replicates at two concentration levels from the third set mentioned above were used to test the stability at ambient temperature for 24 h and after four freeze–thaw cycles, while QC samples from this third set were also used to assess the inter-day reproducibility of the incubation and centrifugation steps. Each validation batch contained 10 freshly prepared calibration standards, two water double blanks (one used for carryover test), a control water blank containing internal standards, a double blank and control blank from each of the matrices used to prepare QC samples, and five replicates of QC samples from the first and second sets.
Three batches were prepared and injected for validation. One of the three batches was re-injected 96 h following the first injection for the processed samples’ stability test. Selectivity for prednisolone and prednisone was evaluated in six different human plasma lots. The selectivity of the method for the endogenous cortisol and cortisone in normal plasma was confirmed by performing a very shallow gradient over 40 min, using a third pump starting from 100% mobile phase A to 100% mobile phase B and monitoring six different lots of commercial plasma as well as one sample from six treated transplant recipients at a time point close to C max of prednisolone. Matrix effects were evaluated by comparing the response area of prednisolone, prednisone, [2H4]-cortisol and [2H7]-cortisone in QC samples with a nominal concentration of 0.5 ng/mL prepared in the ultrafiltrate obtained from six different lots of normal plasma and in water. Incurred sample re-analysis tests were performed by re-analysing 10 incurred samples from kidney transplant patients and computing the percentage difference between the two found concentrations divided by their mean.
The robustness of the ultrafiltration step was verified by performing additional tests. Six replicates of an ultrafiltrate pool obtained from normal plasma and with previously determined concentration of the four compounds were passed four consecutive times through clean filtration devices to evaluate the non-specific binding of the compounds to the filter and the plastic walls. Shorter centrifugation times of 10 and 20 min were verified. A lower volume of 0.200 mL was tested in six replicates, while maintaining the same centrifugation time of 30 min.
The method was then applied to measure the unbound concentration of all four analytes in plasma samples from 31 stable kidney transplant recipients obtained in a 12-h pharmacokinetics study (∼500 samples in total). All patients were on a triple immunosuppressive therapy comprising a calcineurin inhibitor, mycophenolate mofetil and generic prednisone. The Institutional Review Board (IRB) at Rhode Island Hospital (Providence, RI, USA) has approved the study and all patients have signed an informed consent before the study.
Results
Adequate chromatographic selectivity was achieved using the Zorbax-SB Phenyl, Rapid Resolution HT (2.1 × 100 mm) column with a 1.8-μm particle size as explained elsewhere. 27 Representative chromatograms of a QC sample at the lowest limit of quantification and of two samples from treated subjects are included in Figure 2.
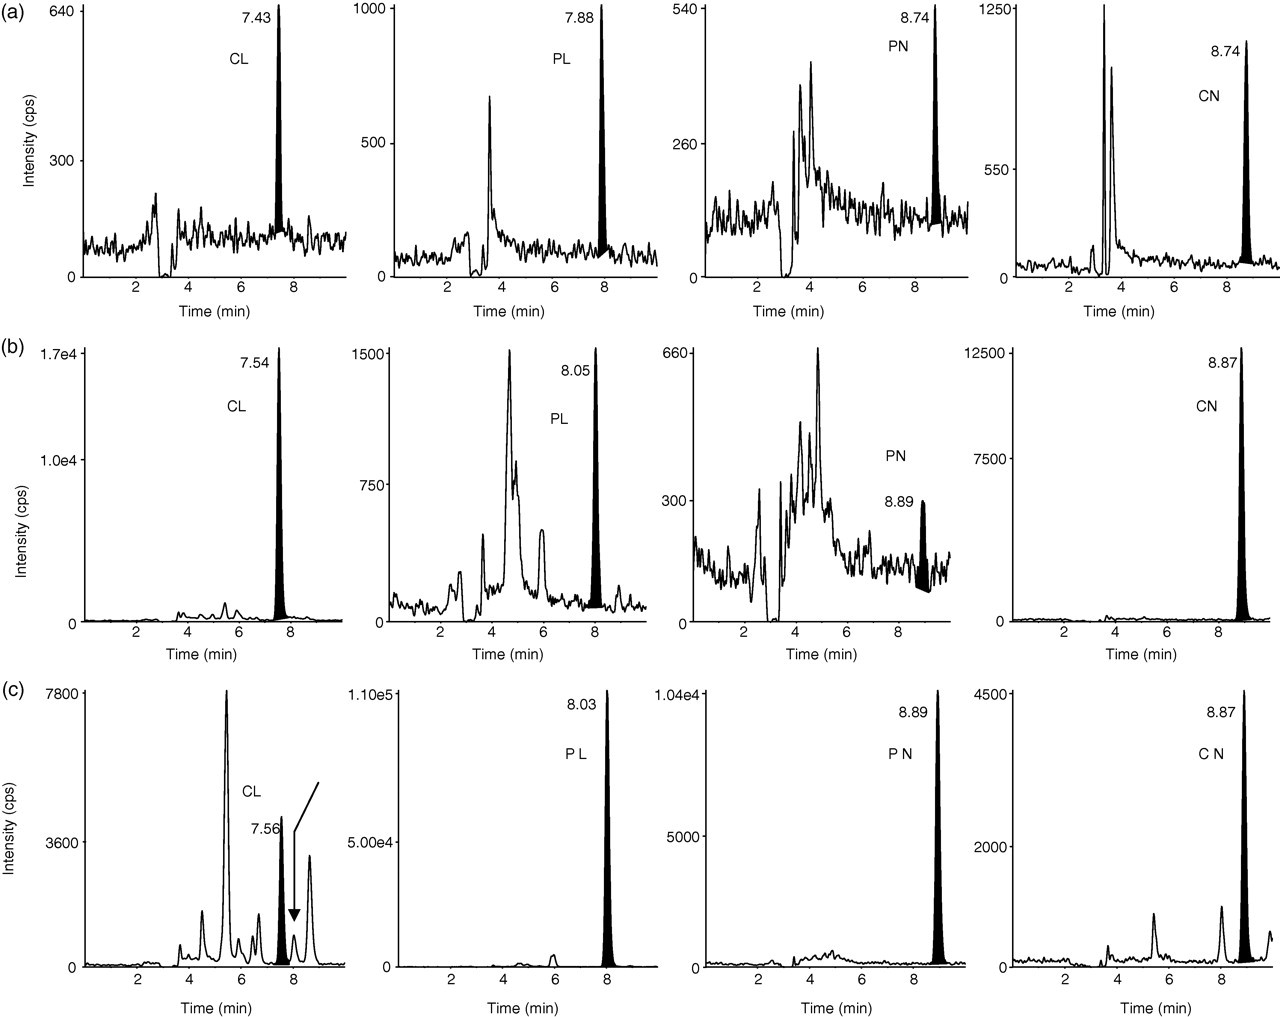
Chromatograms of free cortisol (CL), prednisolone (PL), prednisone (PN) and cortisone (CN). (a) Quality control sample at the lowest limit of quantification (0.100 ng/mL for each compound) prepared in ultrafiltrate obtained from charcoal-stripped plasma; (b) free CL 2.62 ng/mL, PL 0.159 ng/mL, PN below 0.1 ng/mL and CN 1.01 ng/mL in a plasma sample from a treated subject at time 0. Residual levels of PL and PN are present from the previous treatment, 24 h earlier; (c) free CL 0.66 ng/mL, PL 10.8 ng/mL, PN 3.02 ng/mL and CN 0.367 ng/mL in a plasma sample obtained 4 h after PN dose from a stable kidney transplant recipient. Arrow in CL channel indicates the retention time of PL which would interfere with CL quantification if chromatographic separation were not achieved
Linear 1/x 2 weighted regressions adequately fitted the calibration curves for each of the four compounds and the correlation coefficient was 0.9989 or better for all three validation batches.
Validation included several types of QC samples. Set 1 of QC was prepared in a charcoal-stripped ultrafiltrate as the closest substitute for normal plasma ultrafiltrate, which is also free of endogenous cortisol and cortisone. Ultrafiltrate from normal plasma used to prepare a second set of QC constituted the closest matrix to plasma samples from human subjects. The QC concentration of prednisolone and prednisone were within their expected concentration range in plasma from treated subjects. Due to the presence of endogenous levels, the lower end of cortisol and cortisone concentration in QC samples was approximately 2–5 times higher than the lower expected concentration in clinical plasma samples. Inaccuracy (% relative error [RE]) and imprecision (% coefficient of variance [CV]) for all the QC samples prepared in the ultrafiltrate are summarized in Table 1. The signal-to-noise ratio was consistently above five for all the four compounds at the LLQC (lower limit quality control) of the 0.1 ng/mL concentration level.
Summary of inter-assay quality control (QC) samples prepared in ultrafiltrate from plasma
N = 15 replicates at each concentration level for each type of QC from three batch runs including five replicates each
UFNP, ultrafiltrate from normal (non-stripped) plasma; LL, lower limit; L, low; M, middle; H, high
To demonstrate that the equilibration and ultrafiltration procedures could be performed accurately and reproducibly and for freeze and thaw, bench-top and long-term stability tests in matrix, a third set of QC samples were spiked in normal plasma at two concentration levels. Four replicates at each concentration level were equilibrated and centrifuged according to the method and mean concentration were determined in the first batch and used as expected concentration in all subsequent validation batches. The same set of QC was used to test the impact of shorter centrifugation times of 10 and 20 min and of lower plasma volume of 0.200 mL. The results indicate that the variation of centrifugation time or sample volume does not have a negative impact on the accuracy of the data, allowing samples with reduced available volume to be assayed. The results of these tests are included in Table 2.
Summary of assessments for low- and high-quality control samples prepared in plasma
*An aliquot of 60 μL ultrafiltrate was mixed with 6 μL of ISWS prior to injection
†An aliquot of 80 μL ultrafiltrate was mixed with 8 μL of ISWS prior to injection
BT, bench top stability for 24 h; 4FT, freeze and thaw stability for four cycles
Matrix effect tests showed that the simple on-line clean-up was very effective, resulting in differences within −6% to 12% between the areas of compounds spiked in ultrafiltrate from non-stripped plasma and their respective areas in deionized water. Deuterated cortisol and cortisone were used to evaluate the matrix effect due to plasma components assuming that their ionization behaviour would be similar to that of their unlabelled chemical species. Additionally, during the subsequent analysis of over 500 clinical samples obtained from patients treated with several other medications, the response of each of the internal standards was monitored and found to be very stable, indicating that ionization of the compounds of interest was not impacted by co-administered medication.
The processed samples’ stability test confirmed that samples could be adequately quantified within an interval of 96 h (data not presented). The selectivity tests showed that no interferences were present in plasma at the same retention time as the four analytes. Using an on-line clean-up configuration may lead to higher carryover; however, for this method, the carryover was 0.3–5.8% when calculated as the percentage ratio between the peak area of the compounds in a double blank sample injected immediately following the highest standard and the peak area of the compounds in the lowest standard. The carryover for this method was therefore well below the acceptable limit of 20%.
Our tests evaluating non-specific binding revealed that these four compounds do not bind significantly to Microcon® centrifugal filter devices, with recoveries varying between 92.2 and 107.9%. Tubes were weighed before and after the filtration steps to assure that evaporation, which may potentially lead to overestimating the recovery results, would be accounted for. These tests were performed using prednisolone, prednisone and deuterated cortisol and cortisone, following the method described previously. 23 The free fraction of prednisolone was previously reported to be constant in plasma with a pH range between 7.2 and 7.6. 31 We tested all four compounds over a pH range of 7.2–8.2 and found that their free fraction in plasma varies by less than 8% over this range (data not presented).
The unbound concentration of all the four analytes were measured in 500 plasma samples from stable kidney transplant patients. The plasma samples were obtained over a 12-h dosing interval with an average of 10 samples per patient. The results of incurred sample re-analysis of 10 samples were between −8.2% and 6.7% when compared with the concentration determined during the first analysis. A representative unbound concentration – the time profile in plasma samples from one patient treated with a daily regimen of 5 mg Deltasone® is shown in Figure 3a. In addition, box plots of the unbound fraction × 100 (f U%) of all the four analytes from 31 patients are included in Figure 3b.
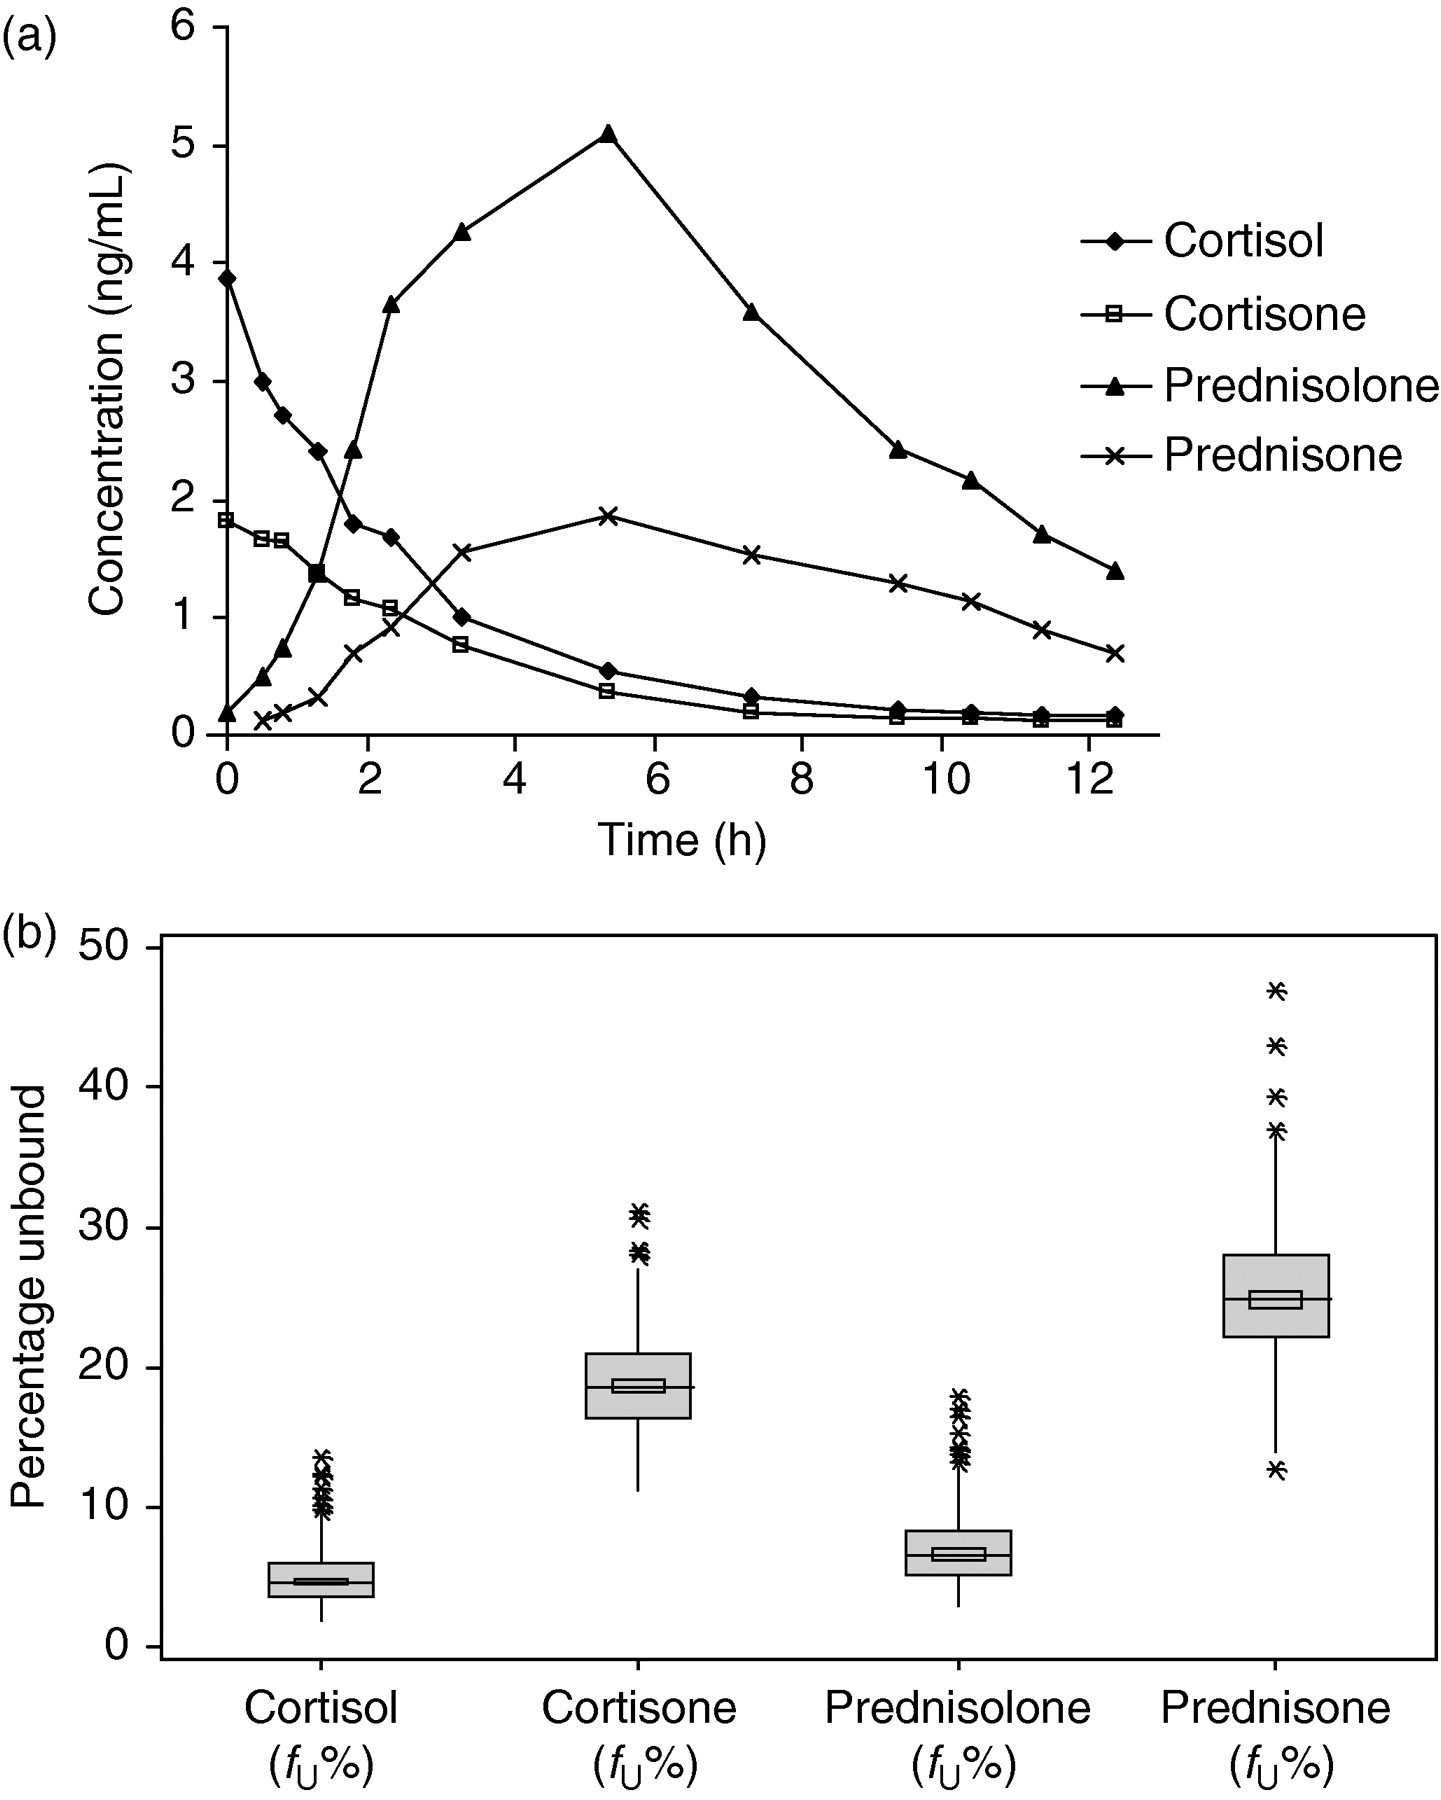
(a) Unbound concentration–time profile for cortisol, cortisone, prednisolone and prednisone in plasma samples from a representative kidney transplant recipient treated once daily with 5 mg prednisone (Deltasone®). (b) Unbound fraction ×100 (f U%) of cortisol, cortisone, prednisolone and prednisone in plasma samples from 31 stable kidney transplant recipients treated with prednisone (Deltasone®) dose ranging from 2.5 to 15 mg/d
Discussion
Direct injection of the ultrafiltrate into the analytical column was initially investigated; however, the matrix effect resulting in loss of signal was observed. Employing stable label isotope internal standard led to maintaining a consistent analyte to the internal standard area ratio, although the signal reduction prevented reaching the desired lower limit of quantification. A simple on-line clean-up step using a Strata X on-line extraction cartridge was then employed, which eliminated the matrix effect. Possible non-specific binding is the most cited drawback of ultrafiltration; hence, this method may be used for compounds that do not bind to the filter membranes or filtration devices.
Using ultrafiltration and direct injection into LC-MS/MS, we have developed a highly sensitive, selective, robust and simple method for quantifying the free concentration of cortisol, cortisone, prednisolone and prednisone in human plasma. This method is amenable to semi-automation and therefore is suitable for routine analysis of corticosteroids in a clinical laboratory setting. Inaccuracy and imprecision of validation samples were within ±20% for QC at the lowest limit of quantification and ±15% for all other QC samples. Due to the lower limit of quantification of the present method relative to previously reported methods, it was not possible to compare this method with others. However, we have studied critical factors associated with this type of analysis, such as non-specific binding of compounds, influence of plasma pH on free fraction, matrix effect and various stabilities and found them not to have an impact on the applicability of this method. Furthermore, this assay method was used for the analysis of ∼500 samples obtained from stable kidney transplant recipients and proved to be simple and robust.
DECLARATIONS