
Abstract
Background
The diagnosis of Cushing's syndrome (CS) represents a challenge for endocrinologists. Several screening tests are used, but none of them seems to be the gold standard for the diagnosis. The aim of this study was to confirm the diagnostic value of salivary cortisol (SC) as a first-level screening test and to evaluate the clinical performance of a electrochemiluminescence immunoassay (ECLIA) method.
Methods
In 33 patients with a strong clinical suspicion of CS, we evaluated urinary free cortisol, circadian rhythm plasma cortisol (PC) and morning PC after low-dose dexamethasone suppression test (LDDST). At the same sampling times, we evaluated SC analysed by the same automated method. Correlation studies were evaluated by Spearman index (significance P < 0.05).
Results
On the basis of biochemical results CS was confirmed in 21/33. SC was significantly correlated to PC at 12:00 and 23:00. Thus, we chose 8.3 nmol/L as midnight SC cut-off value with 100% sensitivity and 97.4% specificity. The cut-off chosen after LDDST was 1.7 nmol/L (100% sensitivity and 72% specificity).
Conclusion
SC assay showed a good clinical accuracy and the ECLIA method can be used in clinical routine to obtain fast results easily.
Introduction
Cushing's syndrome (CS) is a rare endocrine disease with a high morbidity and mortality, which results from chronic exposure to glucocorticoid excess. It may be caused by an excess of adrenocorticotropic hormone (ACTH) secretion (80–85%), usually by a pituitary corticotroph adenoma (Cushing's disease, CD) (65–70%) or less frequently by an ectopic ACTH secreting tumour (10–15%). Moreover, ACTH-independent CS may result from excessive glucocorticoid secretion by unilateral adrenocortical tumours or by bilateral adrenal hyperplasia. 1
The diagnosis of this syndrome still represents a challenge for endocrinologists because some of the signs (obesity, diabetes, hypertension) or symptoms are not specific and common in patients without hypercortisolism. 2
Moreover, there is a large spectrum of manifestations from subclinical to overt syndrome, which depends on the duration and intensity of excess in glucocorticoid production. The endocrine society clinical practice guidelines recommend testing for CS in patients with unusual features for age (e.g. osteoporosis, hypertension) or with adrenal incidentaloma. 3 Therefore, in these patients, it seems crucial to perform an accurate but simple screening test to confirm the diagnosis of CS.
The diagnosis of CS can be carried out by the biochemical confirmation of inappropriate glucocorticoid secretion. Several screening tests are used: high value of urinary free cortisol (UFC) in 24-h urine collection, which represents the daily cortisol secretion; high midnight plasma cortisol (PC), which reveals the absence of cortisol circadian rhythmicity and lack of suppression after low-dose dexamethasone suppression test (LDDST), which discloses resistance of the hypothalamo-pituitary-adrenal axis to negative feedback. 4 However, some of these tests are often invasive to perform, require hospitalization and show different sensitivity and specificity (80–95% among obese, hypertensive and diabetic patients). Thus, none of these tests alone seems to be the gold standard for the screening and the diagnosis of CS and the incomplete diagnostic accuracy of these tests requires a careful integration and interpretation of all test results.
Recently, the determination of midnight salivary cortisol (SC) levels has been reported to be a sensitive and convenient screening test for CS. SC concentration reflects the concentration of free serum cortisol, 5 although it may be modified by salivary gland metabolism. Samples for SC are easy to obtain, they do not require hospitalization and are stable for up to seven days at room temperature, one month or more at 4°C and three months or more at −20°C. 6
The high SC sensitivity and specificity in the diagnosis of CS have been confirmed by several studies, although cut-off values are different on the basis of the method assay used. 7 In view of this, it would be useful for each laboratory to generate its own reference range. Further publication of data obtained from healthy subjects and patients with confirmed CS has been recommended in order to obtain the diagnostic accuracy of SC. 8
The aim of this study was to confirm the diagnostic value of SC as a first-level screening test for CS. Moreover, we evaluated the clinical performance of SC to define a diagnostic cut-off by utilizing an automated electrochemiluminescence immunoassay (ECLIA) of common use in many clinical laboratories. 9
Patients and methods
We retrospectively evaluated 33 patients (7 men and 26 women, mean age 43 ± 13 standard deviation), with a strong clinical suspicion of CS (obesity, hypertension, diabetes, dyslipidaemia or adrenal incidentaloma) admitted to our hospital between 2007 and 2009. Several tests were performed: UFC, plasma ACTH, PC and SC circadian rhythm and PC and SC after LDDST (dexamethasone 1 mg overnight). Midnight SC was also measured in a control group represented by 25 healthy subjects.
Saliva was collected with a commercially available device (Salivette, Sarstedt; cotton swab without preparation no. 51.1534). Plasma and salivary samples were centrifuged at 4°C for 10 min and stored at −20°C until assayed. PC and UFC were assayed by an ECLIA Roche® on Modular E after urine extraction with dichloromethane for UFC. SC was measured with the same assay, without pretreatment of the sample with dichloromethane. The analytical and functional sensitivity of the method was 0.6 and 1.9 nmol/L, respectively. Intra- and interassay coefficient of variation were <10%. Plasma ACTH was assayed by immunochemiluminescence assay with DiaSorin® kit on Liaison Analyser. The analytical sensitivity was 5 pg/mL; intra- and interassay coefficient of variation was <10%.
Statistical correlation between SC and PC was evaluated by Spearman index. The level of statistical significance was set at 5% (P < 0.05). The correlation was calculated in all subjects (patients with and without CS), in patients with CS and in patients without CS.
Moreover, correlation between PC and SC after LDDST was also evaluated in the three groups mentioned above.
In order to evaluate diagnostic accuracy of SC versus PC both measured at midnight and after LDDST, an ROC (receiver operating characteristic) curve was produced to calculate the best cut-off value to discriminate ‘true-positive’ from ‘true-negative’ subjects.
Sensitivity and specificity were calculated according to the area under the curve (AUC). ROC curves were created by comparing patients with CS and the control group, including subjects without CS and healthy subjects.
Sensitivity and specificity of midnight SC were also calculated for several cut-off values.
Moreover, an ROC curve was created for UFC, PC at 23:00, and PC after LDDST to evaluate the sensitivity and specificity of each diagnostic test used in our series.
Results
CS was diagnosed on the basis of findings shown in Table 1 in 21 patients.
Cushing's syndrome patients
Pts., patients; UFC, urinary free cortisol (normal values: 100.7–378.1 nmol/d); PC, plasma cortisol (normal values: 220.8–607.2 nmol/L); ACTH normal values, 5–55 pg/mL; SC, salivary cortisol (nmol/L); LDDST, low-dose dexamethasone suppression test; ACTH dep CS, adrenocorticotropic hormone-dependent Cushing's syndrome; ACTH indep CS, adrenocorticotropic hormone-independent Cushing's syndrome
*Patients affected by chronic kidney disease
In 19 patients elevated UFC values, elevated midnight PC and lack of suppression after LDDST confirmed the diagnosis (14 ACTH-dependent CS and 5 ACTH-independent CS). UFC was normal and low in two patients (1 ACTH-dependent CS and 1 ACTH-independent CS) with chronic kidney disease in dialysis, but diagnosis of CS was confirmed in both cases by elevated midnight PC, lack of suppression after LDDST and imaging findings. In 12 patients, 10 with metabolic syndrome and two with adrenal adenoma, CS was not confirmed.
The mean SC concentrations at 23:00 were significantly higher (P < 0.001) in CS patients (mean ± standard error [SE] 16.8 ± 2.2 nmol/L) compared with non-CS patients (mean ± SE 3.7 ± 1.1 nmol/L) and to healthy subjects (mean ± SE 1.1 ± 0.3 nmol/L).
Table 2 reports correlation values between SC and PC. Considering all the patients (CS and non-CS patients), PC and SC at 12:00 and 23:00 were strictly correlated (P ≤ 0.001), while no significant correlation was shown between PC and SC at 8:00 (P = 0.076).
Correlation between SC and PC
CS, Cushing's syndrome; SC, salivary cortisol; PC, plasma cortisol; pts., patients; LDDST, low-dose dexamethasone suppression test
*Statistically significant correlation
Considering CS patients, SC and PC results statistically correlated at 12:00 and 23:00 (P = 0.002). In non-CS patients, PC and SC were also statistically correlated at 12:00 and 23:00 (P ≤ 0.001 and P = 0.027, respectively). PC and SC after LDDST resulted statistically correlated considering all the patients (CS patients and non-CS patients) (P ≤ 0.001).
Considering CS patients and the control group including non-CS patients and healthy subjects, the ROC curve analysis showed an AUC = 98.5%. On the basis of this curve, the midnight SC cut-off above which glucocorticoid inappropriate secretion can be assessed was 8.3 nmol/L, leading to 100% sensitivity and 97.4% specificity (Figure 1), with 96% positive predictive value (PPV), 100% negative predictive value (NPV) and 97% diagnostic accuracy.
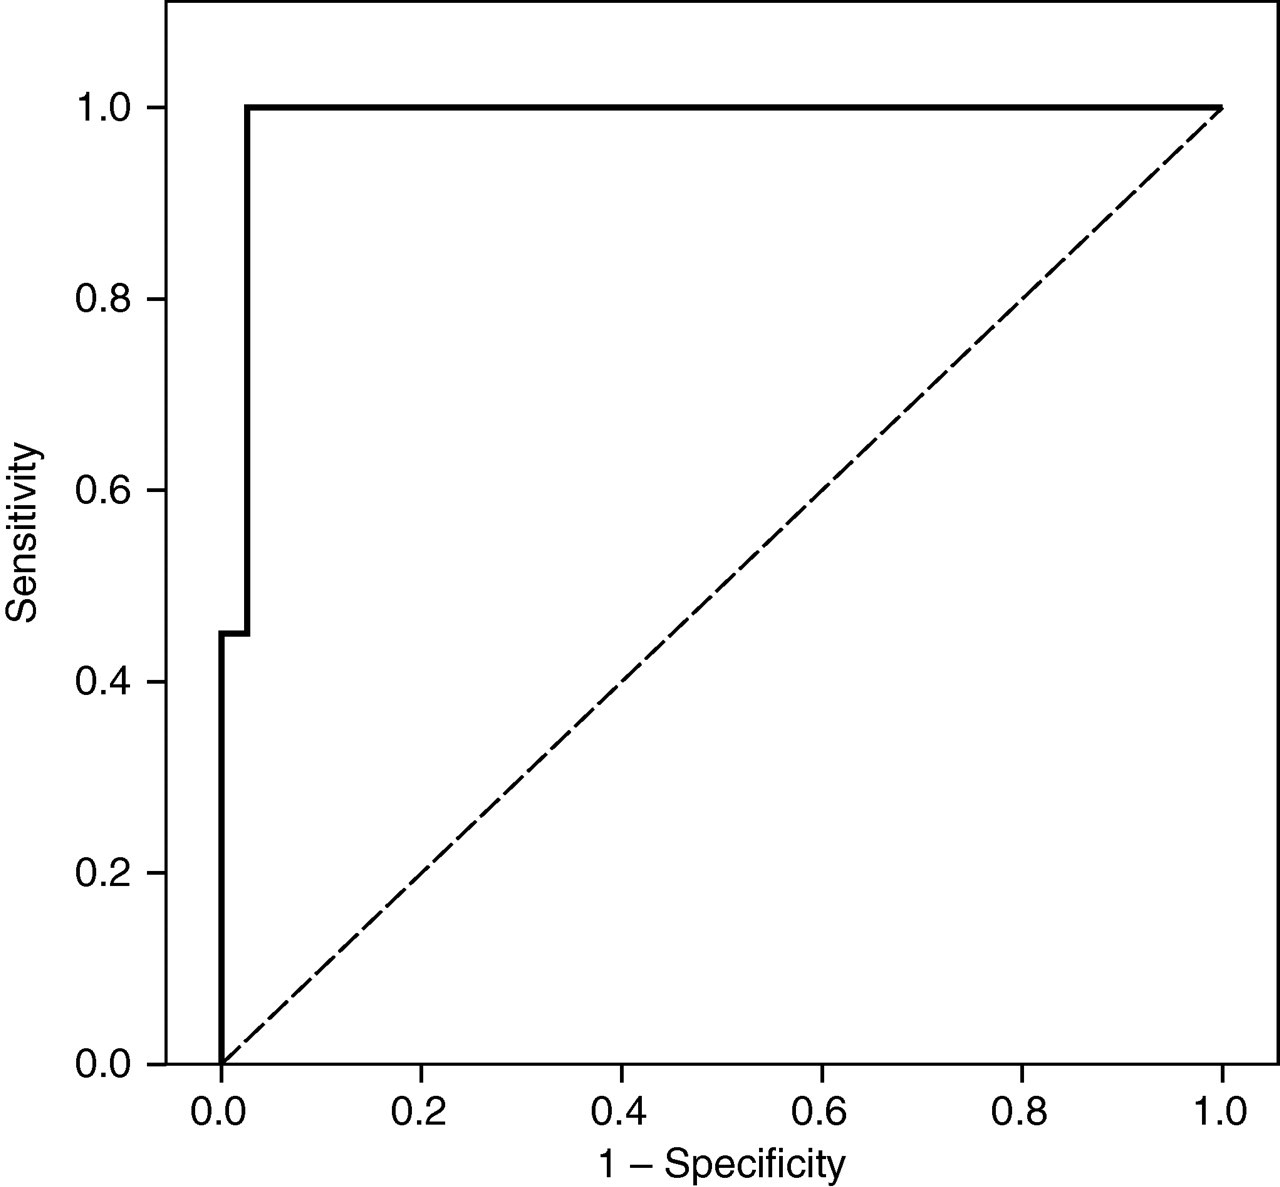
Receiver operating characteristic curve for midnight salivary cortisol in Cushing's syndrome (CS) patients versus control group (non-CS + healthy subjects)
Alternatively, using predefined cut-off values, sensitivity and specificity of midnight SC were as follows:
5.5 nmol/L: 100% sensitivity; 94.9% specificity; 91% PPV; 100% NPV; 97% diagnostic accuracy; 11 nmol/L: 67% sensitivity; 97% specificity; 93% PPV; 84% NPV; 87% diagnostic accuracy.
Regarding SC after LDDST in all patients (CS and non-CS), the ROC curve analysis showed an AUC = 92% (Figure 2). On the basis of this curve, SC after LDDST cut-off above which lack of suppression can be assessed was 1.7 nmol/L leading to 100% sensitivity and 72% specificity (Figure 2).
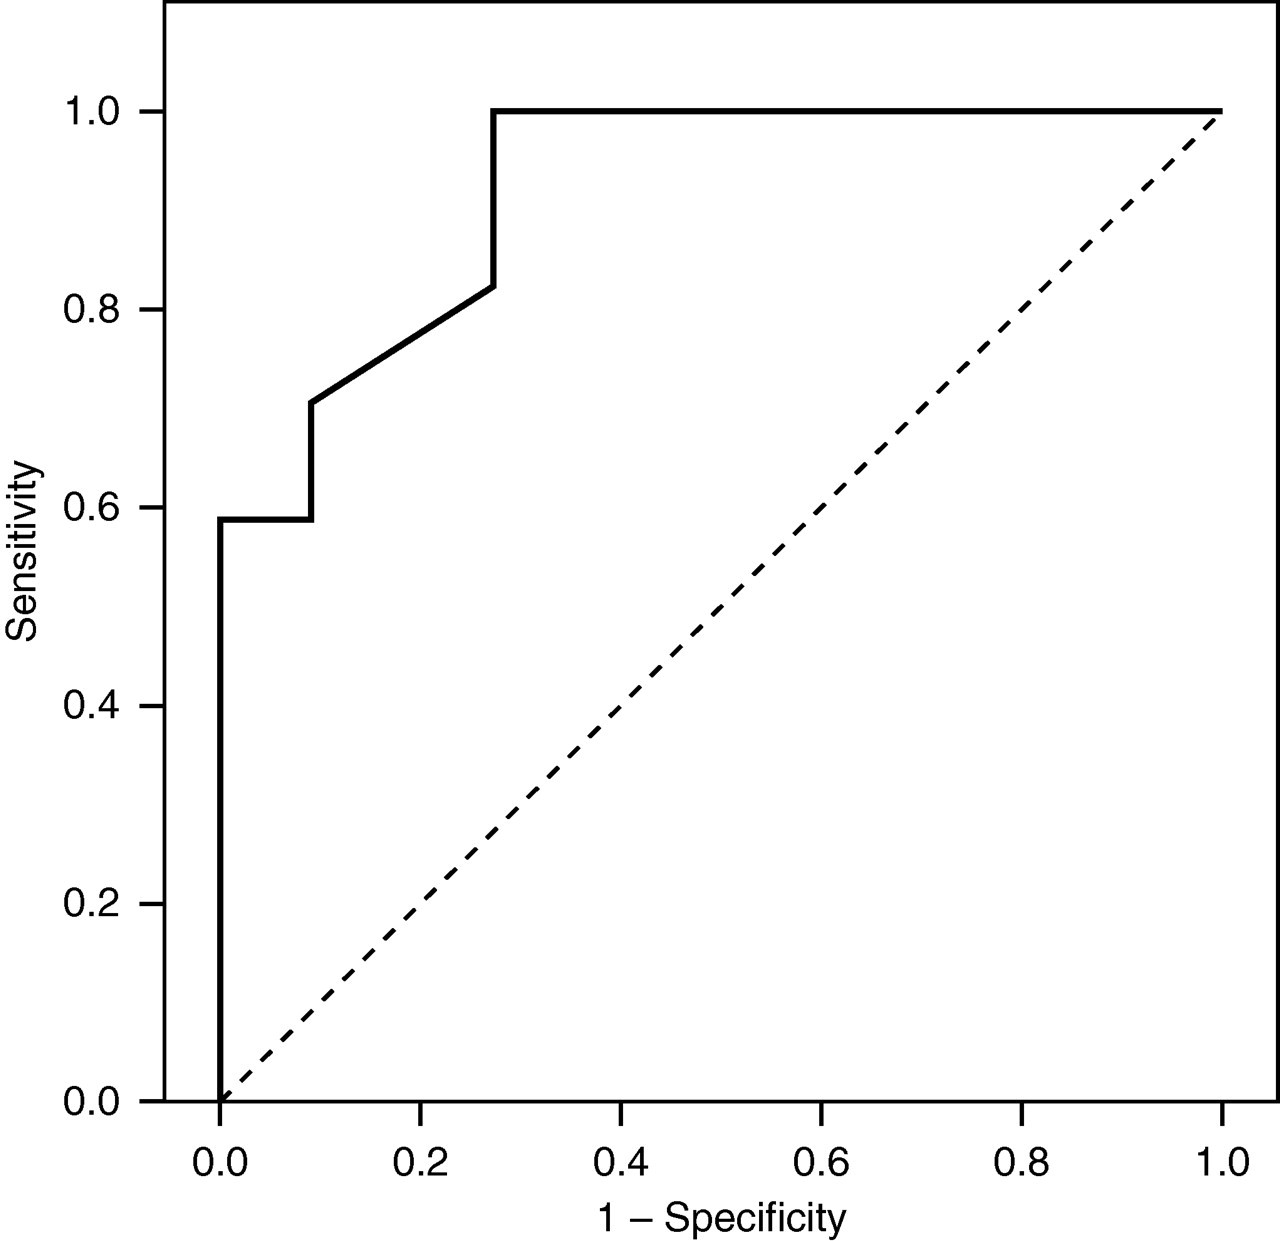
Receiver operating characteristic curve for plasma cortisol after low-dose dexamethasone suppression test in Cushing's syndrome (CS) patients versus non-CS patients
In our series we also evaluated sensitivity, specificity and diagnostic accuracy of UFC, midnight PC and PC after LDDST considering both conventional cut-off values 1 (Table 3).
Sensitivity, specificity and diagnostic accuracy of UFC and PC
PPV, positive predictive value; NPV, negative predictive value; UFC, urinary free cortisol; PC, plasma cortiso; LDDST, low-dose dexamethasone suppression test
Our data report that SC with 8.3 nmol/L cut-off has the highest sensitivity (100%), specificity (97.4%), PPV (96%) and diagnostic accuracy (98%) among all the screening tests used.
Discussion
Measurement of midnight SC concentration is an increasingly used method as a screening test in suspected CS. In the main studies SC was measured by using radioimmunoassay (RIA) and enzyme-linked immunosorbent assay (ELISA) methods, 7 while few studies used an automated assay 10,11 to evaluate midnight SC in healthy subjects and only one study in nine CS patients. 12 We utilized an automated ECLIA method, which provides a good analytical performance, 9 when compared with the liquid chromatography-tandem mass spectrometry method, 10 used in a larger number of CS patients.
In this study the correlation between SC and PC in samples obtained at 8:00, 12:00, 23:00 and also after LDDST has been evaluated in 21 CS patients. Moreover, only midnight SC was evaluated in healthy subjects, to find a sensitive and specific cut-off in the screening test for CS. Our data support a high correlation between PC and SC at 12:00 and 23:00 in CS patients, in non-CS patients and in all the patients confirming the results of the previous series. 12–15 PC and SC after LDDST were also correlated in CS and non-CS patients altogether. 16
On the basis of these correlations, SC can be considered a useful first-line test for CS screening, showing several practical advantages compared with PC. Indeed, saliva collection is a stress-free procedure that does not cause venipuncture-induced cortisol elevation and could also be obtained from patients in whom blood samples are hard to obtain. 14,17 This procedure does not require hospitalization, which is mandatory for midnight PC. Salivettes can be easily stored at room temperature and then sent to the laboratory. 18 In addition, SC is an accurate index of free biologically active PC, 14 which is not affected by cortisol binding globulin alterations, such as oestrogen-induced increase 19 or liver-disease-related reduction. 20
Therefore, the good correlation between SC and PC meets quality requirements as a first-line screening test for CS as an alternative to circadian PC rhythm.
In our patients the cut-off of 8.3 nmol/L for midnight SC above which glucocorticoid inappropriate secretion can be assessed, calculated by the ROC curve, shows a good sensitivity (100%) and specificity (97.4%). In the literature 7,14 several cut-off values have been proposed, with different degrees of sensitivity and specificity. 7 It is important to note that these studies differ in the number of cases and controls, in the methods used to generate cut-off, in the diagnostic criteria and also in the techniques to collect saliva samples. In spite of these differences, all the studies report sensitivities and specificities for SC higher than 90%. This consideration shows that midnight SC is one of the tests chosen in clinical practice for the screening of CS. The usefulness of the combination of midnight and after LDDST SC has been confirmed by other studies. 8,16,21
On the basis of our data, cut-off values of 1.7 nmol/L for SC after LDDST, above which lack of suppression can be assessed, evaluated by the ROC curve considering CS and non-CS patients, showed high sensitivity (100%) and specificity (72.7%). As suggested by the endocrine society clinical practice guidelines, 3 SC represents a useful first-line screening test in CS diagnosis, but it is important that each laboratory deduces its cut-off value in relation to the assay used and evaluates the clinical accuracy of its own method.
A review of the literature 7 shows that the most important clinical studies used only radioimmunoassay (RIA) and ELISA methods. It is important to point out that we used an automated immunoassay without any pretreatment of salivary samples and it was not necessary to collect a specific number of samples to optimize the use of the kit. This assay showed a good clinical accuracy; therefore, it can be used on a large scale in clinical practice to obtain fast results easily and to facilitate screening for CS.
DECLARATIONS