
Abstract
Aims
Troponin (Tn) is the preferred biochemical marker for the diagnosis of acute coronary syndrome. Spurious false Tn results (outliers) may cause significant problems with clinical management. We investigated the occurrence of outliers and whether this phenomenon could be explained by analytical imprecision.
Methods and results
Troponin I (TnI) was measured in duplicate with Beckman AccuTnI reagent if the first TnI result was ≥0.04 μg/L (n = 5265). All TnI requests were performed in duplicate in a subset of samples for one calendar month (n = 881). A total of 13,178 TnI requests were received during the study period. Variables were sample type, centrifugation speed and analyser. Results were identified as outliers when the difference between two results exceeded a critical difference (CD) limit defined by CD = z × √2 × SDAnalytical. Outliers at the 0.0005 probability level were detected in 102 of 5265 duplicate observations (1.94 ± 0.37%). This translated into an outlier rate of 0.55 ± 0.13% for all TnI results and 1.37 ± 0.31% for results above 0.04 μg/L. Outliers resulted only in falsely elevated TnI values and were not dependent on the analyser, centrifugation speed or sample type.
Conclusion
TnI outliers occurred more frequently than anticipated, could not be explained by analytical imprecision and indicated a lack of robustness in the assay. The high rate and the magnitude of the errors will complicate clinical management and carry a risk of detrimental patient outcome. The outlier rate is a useful parameter to define the robustness of assays.
Introduction
Cardiac Troponin (Tn) is the preferred marker for the diagnosis of acute coronary syndrome, the diagnosis centred on the demonstration of a characteristic rise or fall in Tn and a decision limit defined by the 99th percentile for the population. In addition, a precision specification of a coefficient of variation (CV) of less than 10% at the decision limit is recommended. 1–3 In 2007, Pathology Queensland, a regional laboratory service, standardized on Beckman analysers in our 33 laboratories encompassing large metropolitan facilities and small district services. Simultaneously, we implemented the recommended 99th percentile decision limit for Troponin I (TnI), which equated to a TnI of 0.04 μg/L in our assay. The analytical precision at this decision level did not meet the recommended guideline and was approximately 16.7% as determined by the between-run CV of a low-level quality control material. Following the guidelines had a significant impact on the workloads of the emergency departments as the caseload of admitted coronary syndrome patients increased. An unexpected problem was the number of incongruent TnI results that caused clinical uncertainty and misdiagnosis. These errors occurred erratically, were unreproducible and were considered of a magnitude too large to be explained by imprecision.
False-positive Tn results are a well-recognized hazard and the US Food and Drug Administration has published a document in response to numerous adverse event reports from manufacturers and users of Tn assays. 4 Falsely elevated Tn can be the result of both biological and analytical mechanisms. Analytical false-positive Tn results have been reported on various platforms with both serum samples and lithium heparin samples and re-centrifugation has been proposed as a mechanism to circumvent false-positives due to fibrin microclots. 5–10 A preliminary investigation of the incongruent TnI results in our laboratory indicated that re-centrifugation was unnecessary since the spurious results could not be replicated if the same sample was immediately re-analysed. Tn assays, like all immunoassays, may at times be subject to interference by heterophile antibodies, rheumatoid factor and anti-Tn autoantibodies. 11–15 These interferences characteristically result in a consistent elevation of Tn on an analytical platform and were therefore excluded as a contributing factor in our case.
The aim of our study was to determine the frequency of the spurious incongruent TnI errors (outliers) and to establish whether these outliers could be explained by suboptimal analytical precision at the 99th percentile decision limit of the TnI assay.
Materials and methods
We investigated the reproducibility of TnI at one of the laboratories in the network (Princess Alexandra Hospital, Brisbane, Queensland) on all routine patient samples where a Tn was requested for a period of seven months. This laboratory serves a tertiary referral hospital with large emergency, renal and cardiac departments in a metropolitan environment. TnI was measured with Beckman AccuTnI reagent on a Beckman Unicel DxI800 or a Beckman Access2 (Beckman Coulter Diagnostics, Brae, CA, USA) analyser depending on the workflow requirements of the laboratory. Samples were collected into lithium heparin or serum separator tubes (Greiner Vacuette™, Nos. 456083 and 456078, [Greiner Bio-one, Graz, Austria]). Samples were centrifuged at 2200
Samples were re-analysed if the first TnI result was ≥0.04 μg/L, provided that there was sufficient sample. The replicate analysis was performed on the sample aliquot already on the analyser without any manual intervention and the re-analysis occurred as soon as the first result became available (within 20 min). To assess whether errors occurred with a similar frequency when the first result was less than 0.04 μg/L, we prospectively analysed all samples, where a Tn was requested, in duplicate for a calendar month. All the samples from this data set were centrifuged at 3000
We identified outliers by using the formula to estimate the critical difference (CD) between two results. Since the second result is an analytical repeat on the same analyser, no biological or preanalytical variation needed to be included in the calculation. Therefore, the formula to estimate the CD between the two results simplifies to: CD = z × √2 × √SD2 Analytical. By inserting an appropriate value for z for a defined probability, the CD can be calculated, i.e. substituting z with 3.5, the CD with a probability of 0.0005, can be calculated (CD = 4.95 × SDAnalytical). Thus, the difference between results 1 and 2 would be expected to differ by >4.95 × SDAnalytical less than five times in 10,000 events. To estimate the number of outliers, we compared the predicted occurrence with the number of observations where the difference between results 1 and 2 exceeded the CD at a defined probability.
The average between-run imprecision data (CV), from internal quality control procedures performed during the study period, was used to estimate the CV and SD of each result by linear interpolation. We routinely run three levels of control material and the mean CV values during the study period were 16.7% (0.052 μg/L), 7.9% (0.548 μg/L) and 6.8% (7.540 μg/L). Results greater than the highest level of quality control material were assumed to have the equivalent CV. Results below the lowest level of quality control material were assumed to have the equivalent SD with a consequent increase in CV as the TnI values decreased. The differences between the results were expressed relative to the SD of the lower result of the pair (relative difference = difference/SDlower result).
In routine practice, Tn is not measured in duplicate and we were interested in the effect of outliers in this scenario. The outlier rate, defined as the number of observations where the first result was identified as an outlier, was determined in two groups: where replicates were performed only if the first TnI result was ≥0.04 μg/L and where all TnI was measured in duplicate.
The Chi-square procedure was performed to test for the influence of analyser and centrifugation speed on outlier occurrence in the group where duplicate testing was performed if the first TnI was ≥0.04 μg/L. In the group where all TnI request were performed in duplicate, we tested for the influence of analyser and sample type on outlier occurrence. Data analysis and statistical procedures were performed with SPSS v. 17 software. All percentages are reported as ± the 95% confidence interval.
Results
A total of 13,178 requests for TnI determination were received over the study period and 78 samples were excluded because a replicate was not assayed despite the intention to obtain one. A total of 5265 samples satisfied the criteria for inclusion in the data set with the first Tn I result ≥0.04 μg/L and 881 were eligible for inclusion in the second data set where all Tn I tests were performed in duplicate (Figure 1). The numbers of cases from the group with a first Tn I result ≥0.04 μg/L where the difference between the results exceeded a stated probability are presented in Table 1. A total of 102 events were observed where approximately 2.6 were expected at a probability of 0.0005. The distribution of results with the first TnI ≥0.04 μg/L is graphically represented in Figure 2. The outliers contributed to a clinical classification error in 34 cases, where the first TnI result was ≥0.04 μg/L and the subsequent TnI less than the decision limit (sector D of Figure 2).
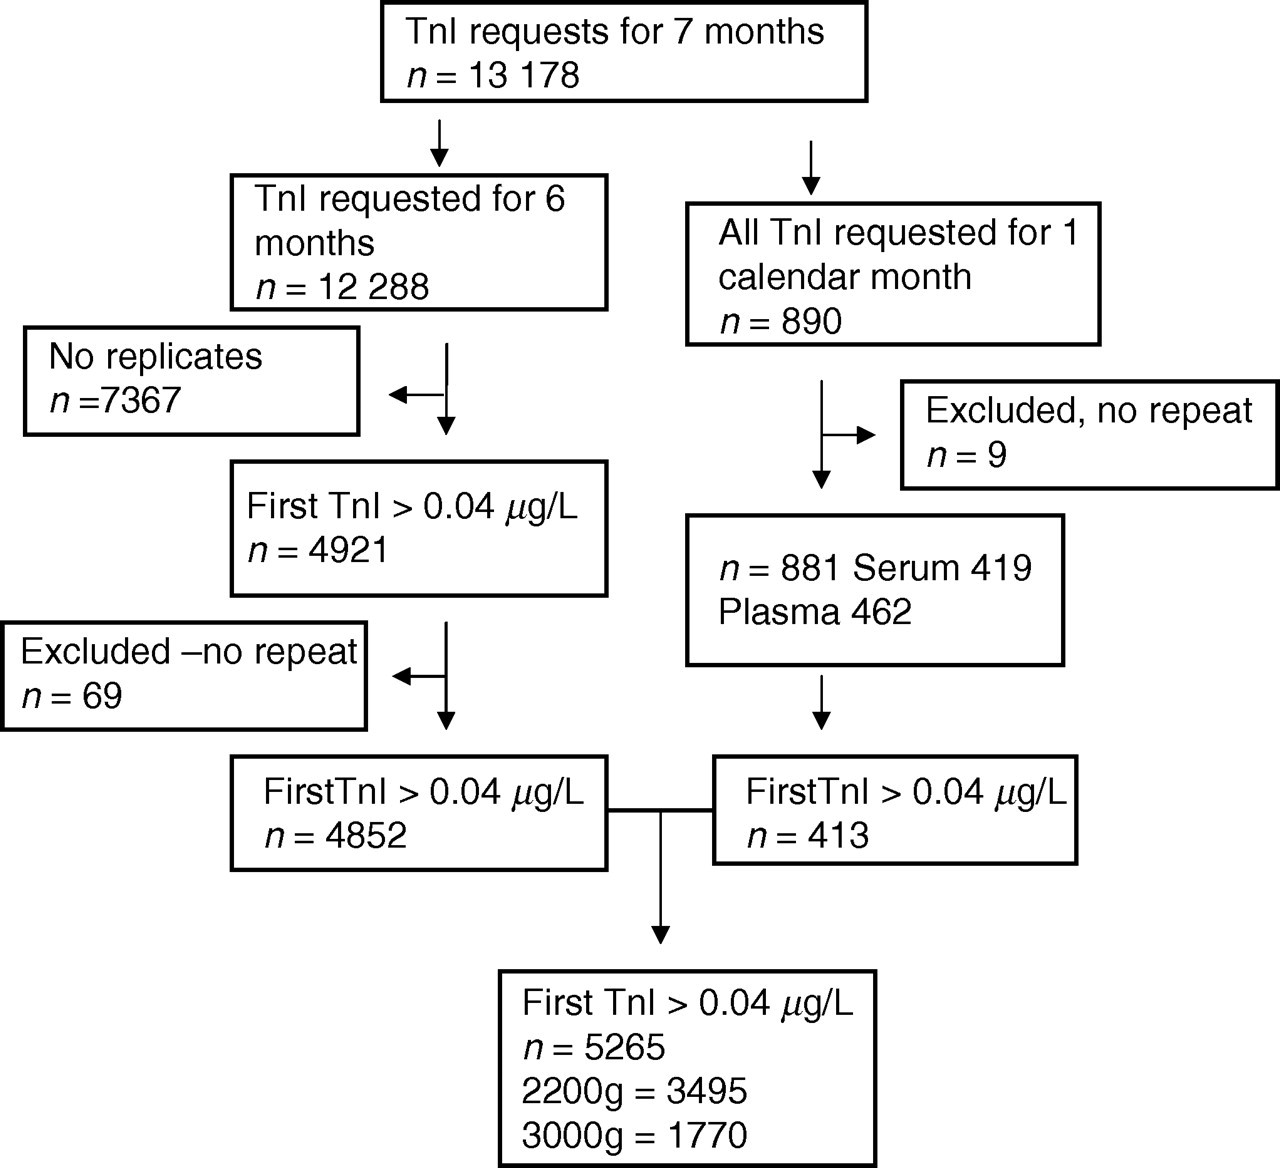
Data selection. A total of 13,178 requests for TnI was received. TnI was repeated if the result was ≥0.04 μg/L in 12,288 samples – this yielded 4852 duplicate result pairs. For a period of one month all TnI requests were performed in duplicate. The 413 result pairs from this group where the first result ≥0.04 μg/L were pooled with the first group for further analysis (n = 5265). A total of 78 samples were excluded from data analysis because a replicate was unavailable despite the intention to perform one. TnI, troponin I
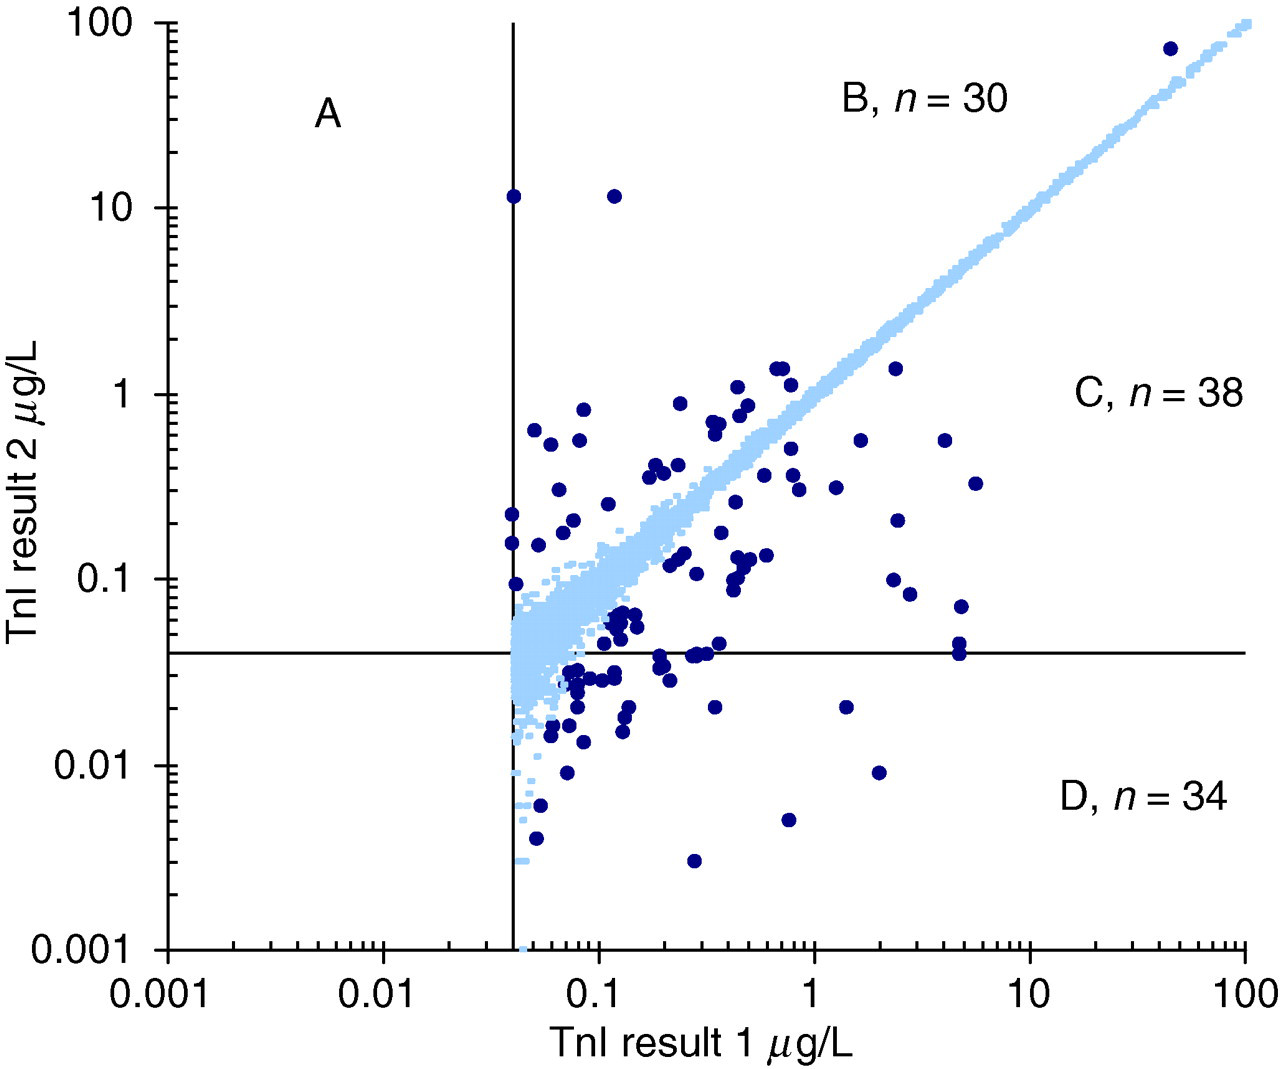
Distribution of TnI results where the first result ≥0.04 μg/L, n = 5265. Outliers were statistically identified at a probability of 0.0005 if the difference between the result pair exceeded the limit of 4.95 × SD. Less than three cases were expected in the data set. The outliers are indicated in bold. The lines indicate the 0.04 μg/L decision limit. The outliers contributed to a clinical classification error, where the first TnI result was ≥0.04 μg/L and the subsequent TnI less than the decision limit in 34 instances (sector D). TnI, troponin I; SD, standard deviation
Number of results where the first TnI was more than 0.04 μg/L and difference between results 1 and 2 exceeded the specified probability
TnI, troponin I
*Expected number of observations in the data set of 5265 duplicate results at the stated probability
†Number observed above the critical difference (CD) limit calculated as: CD = z × √2 × √SD2 Analytical, z = 2.56 for a probability of 0.01, z = 3.50 for a probability of 0.0005 and z = 4.39 for a probability of 0.00001, etc
‡Ratio of observed/expected
In the data set, where all TnI were measured in duplicate, a total of 11 outliers was observed compared with the expected 0.4 at a probability of 0.0005 (Figure 3). The outliers were symmetrically distributed around the bulk of the data, indicating that the outliers occurred with a similar frequency in the first and second measurement.
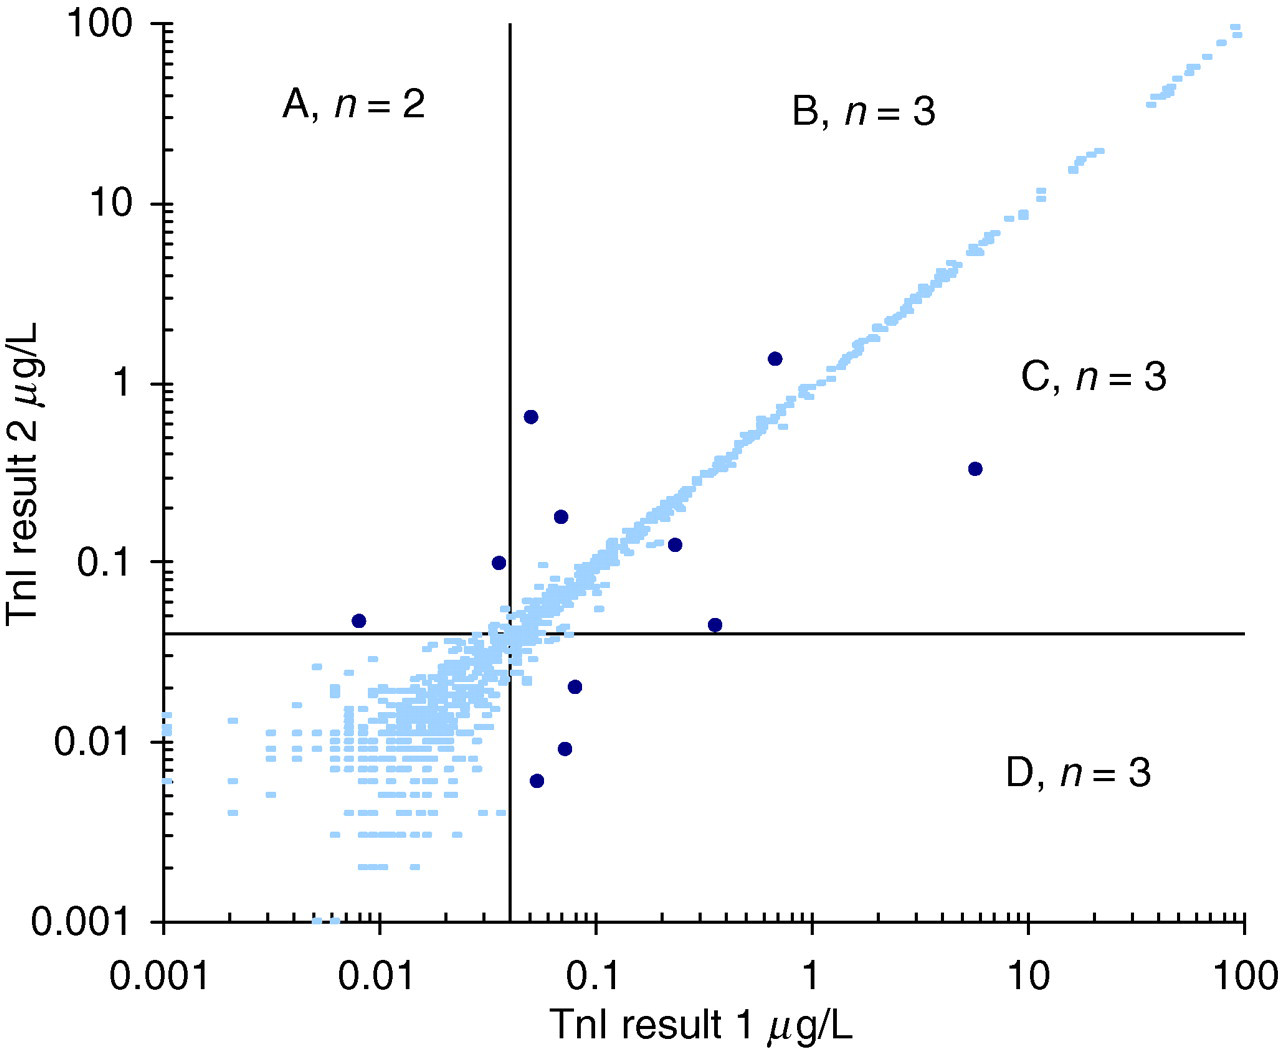
Distribution of troponin I results where all requests were performed in duplicate, n = 881. Outliers were statistically identified at a probability of 0.0005 if the difference between the result pair exceeded 4.95 × SD. Less than one case was expected in this data set. The outliers are indicated in bold. The lines indicate the 0.04 μg/L decision limit. A total of 11 outliers were identified. The outliers are symmetrically distributed and occurred with both the first and repeat troponin measurement. SD, standard deviation
The number of outliers, detected at an expected frequency of 0.05% (0.0005 probability) on the respective analysers, centrifugation speeds and sample types, is summarized in Table 2. In the group with the initial TnI ≥0.04 μg/L, outliers were observed in 102 of 5265 duplicate samples (1.94 ± 0.37%) and, in the second group, in 11 of 881 duplicate samples (1.25 ± 0.73%), which is a 39- and 25-fold increase, respectively, over the expected frequency of 0.05%. Based on Chi-square analysis, outliers were not statistically dependent on the analyser or centrifugation speed in the TnI ≥0.04 μg/L group (P = 0.64). In the group where all TnI requests were performed in duplicate, the outliers were not dependent on analyser or sample type (P = 0.46). Further repeat results were available on 32 samples, in which an outlier occurred, to identify which of the two results were erroneous (Table 3). In 31 of the 32 available samples, the lower result of the pair was repeatable (96.9 ± 6.03%), and in one case a decision could not be made.
Outliers observed at a probability of 0.0005 according to analyser, centrifugation speed and sample type
TnI, troponin I; CD, critical difference
Results in brackets are percentages ± the 95% confidence interval
*Chi square = 1.67, three degrees of freedom, P = 0.64
†CD + : Number of results where the difference exceeded the CD = 4.95 × SD
‡R1 > R2: Result 1 greater than result 2 (repeat)
§R1 < R2: Result 1 less than result 2 (repeat)
**Chi square = 2.60, three degrees of freedom, P = 0.46
TnI results identified as outliers at a probability of 0.0005 where additional result/s were available
TnI, troponin I; SD, standard deviation
Results and differences are reported in μg/L
Bold numerals indicate the probable correct result as adjudicated by the subsequent result/s
*Results 1 and 2
†SD for the lower result is calculated from the quality control imprecision data
The outlier rate calculated from the first result of the pair only (to simulate singlet measurements) for the whole group was 72/13,100 (0.55 ± 0.13%) and if the first TnI was ≥0.04 μg/L the outlier rate was 72/5265 (1.37 ± 0.31%). We assumed no outliers were present in the 7367 results with a first TnI result <0.04 μg/L. We based our assumption on the observation in the group where all samples were analysed in duplicate that samples affected by an outlier had at least one TnI result of the pair ≥0.04 μg/L (Figure 3) and secondly outliers predominantly resulted in falsely elevated results (Table 3). In the group where all TnI results were performed in duplicate, the comparative outlier rates were 6/881 (0.68 ± 0.54%) and 6/431 (1.45 ± 1.15%), respectively.
Discussion
We identified outliers using duplicate assays and compared the magnitude of the difference to the expected statistical distribution obtained from quality control material. We found an outlier rate, for singlet measurements, of 0.55 ± 0.13% for all TnI requests, and 1.37 ± 0.31%, if the TnI was above the decision limit of 0.04 μg/L. This is less than the 3.1% false-positive rate (95% confidence interval 2.0–4.4%) reported by Fleming et al. 5 In the group with the initial TnI ≥0.04 μg/L, 1.94 ± 0.37% of duplicate results were affected by an outlier. This relatively high rate can be explained by the fact that almost all outliers consist of erroneously high results, and that the outlier rate is similar in the first and the second result per duplicate pair. We observed 102 TnI outliers in 5265 duplicate analyses, almost 40 times more than the expected 2.6 due to analytical imprecision at a probability of 0.0005. The incidence increased dramatically at more stringent probabilities (188 at 0.0001 and 1580 at 0.00001), providing further evidence that the outliers were not simply extremes of a normal distribution due to poor precision alone (Table 1).
The wide dispersion of results due to imprecision at the decision limit will predictably result in classification errors, but the outliers identified in Figures 2 and 3 were distinct in appearance from the majority of results, were not clustered around the decision limit and could not be explained by assay imprecision. We did not find a statistical difference in the occurrence of outliers between serum or plasma samples nor between different centrifugation speeds or individual analysers. Thus, none of these variables are expected to play a causative role in the creation of outliers.
Robustness of an analytical system is a characteristic that describes the ability to perform consistently according to accuracy and precision specifications in field conditions. Outliers are extreme and unexpected results that do not form part of the normal distribution and indicate a lack of analytical robustness. The outlier rate calculated from duplicate analysis of samples is an objective parameter in assessing analytical robustness. The effect of possible outliers with Internal Quality Control material may not be reflected in assay parameters (SD and CV) since exclusion of outliers is common practice in determining these parameters.
An important question that needs to be addressed is what outlier error rate can be tolerated in clinical practice. Given the important role of Tn in the diagnosis of acute coronary syndromes, we are of the opinion that the rate of 0.55 ± 0.13% is unacceptably high. The robustness of an assay, as reflected by the outlier rate, should be one of the critical parameters in the selection of methodology. Historically, immunoassays were performed in duplicate to detect spurious results, and with automation, the error rate decreased to a level where duplicate analyses were deemed unnecessary. Objective evidence on the robustness of an assay is essential in a cost-benefit analysis of a duplicate testing strategy.
With duplicate testing of all samples, at an outlier rate of 0.55%, one would expect an outlier (false-positive) to be identified in every 182 samples tested. In comparison, one would expect to find an ‘outlier’ resulting from imprecision to occur only once in every 2000 samples tested in duplicate. Testing in duplicate would double the reagent cost and only marginally affect turn around time. Analytical turn around time will however be affected due to confirmation of discrepant results. An alternative strategy would be to confirm all singleton results above 0.04 μg/L with a relative saving in reagent cost. At our 40% prevalence of positive results, approximately 73 samples would have to be tested in duplicate to detect one outlier (outlier rate 1.37%). Unfortunately, this strategy will result in a significant increase in turn around time for elevated TnI results.
We acknowledge that a potential limitation of this study was the non-classification of sample type in the bulk of samples with an initial TnI ≥0.04 μg/L (92.2 ± 0.73% of samples). We addressed this by separately analysing the data from all TnI requests for a calendar month and collecting information regarding sample type in this subset. Another potential criticism is that we expressed the expected variance (SD) relative to the lower of the two TnI results that may have led to overestimation of outliers. The data from samples where a third or fourth repeat TnI was available (Table 3) supported our decision, as, in practically all the cases, the higher result was not reproducible.
According to the current guidelines, a Tn higher than the 99th centile of a reference population constitutes an abnormal result with a recommendation that an imprecision of less than 10% should be attained at this level. 1 The majority of currently available Tn assays fail to comply with this requirement and numerous papers have addressed this issue. Tn assays are classified according to their ability to meet this imprecision criterion – less than 10% imprecision deemed ideal, 10–20% deemed clinically useful and above 20% as not acceptable. 16 A beneficial effect on clinical outcome has not been conclusively demonstrated for the next generation of Tn assays. The empirical approach of only focusing on imprecision at the 99th centile in order to improve assay quality has to be critically examined. Interestingly, the problem of outliers did not receive the same degree of attention as imprecision despite the obvious clinical consequences. The reason for this lack of interest may be the fact that outliers are difficult to define and detect, they occur erratically and the number of errors, therefore, is also difficult to quantify.
The magnitude of a significant change (CD) between serial results can be estimated by specifying a confidence level required, and using the imprecision and biological variation with the implicit assumption that the difference between results was not due to outliers. 17 The next generation of Tn assays with improved precision at the 99th percentile level will, by definition, decrease the scatter at low levels, theoretically improving their clinical utility at this level. 18,19 We maintain, however, that improved analytical precision may not reduce the outlier rate. Therefore, in our opinion, efforts to improve the robustness of Tn assays will be more rewarding than solely focusing on precision. Our results were obtained on a Beckman analytical platform, but the literature suggests that the phenomenon of spurious Tn results is generic and not restricted to one manufacturer. 4–6 In our opinion, the quantification of the outliers provides an objective assessment of assay robustness and its use in the evaluation of different platforms and reagent formulations should improve assay quality. We have only investigated the cardiac TnI assay and therefore we cannot exclude the possibility of a lack of robustness in other immunoassays.
Conclusion
The outlier rate in all patients was 0.55 ± 0.13% and in patients with a positive TnI result it was 1.37 ± 0.31%. These errors occurred randomly in a once-off manner, could not be explained by the inherent imprecision of the method and indicated a lack of robustness in the assay. Due to the reliance on Tn in the diagnosis of acute coronary syndromes, these erroneous results will culminate in diagnostic inaccuracy and suboptimal management with the risk of adverse patient outcome. Outliers are more difficult to manage than the expected variation caused by imprecision and clinicians should be aware of the magnitude of this problem. Determining the outlier rate is an important parameter to define the robustness of analytical assays and manufacturers should endeavour to improve this aspect of method performance.
DECLARATIONS