
Abstract
Background
Monoclonal gammopathy has been noted with increased frequency in patients with HIV infection compared with the general population. The prevalence in patients on antiretroviral therapy (ART) has not been widely investigated. The present study aims to describe the prevalence and characteristics of monoclonal proteins in a population of HIV-infected patients in the Western Cape region of South Africa.
Methods
Clinical information and blood and urine samples were collected from patients with proven HIV infection attending two clinics in the Western Cape. Serum protein electrophoresis was performed on all patients using agarose gel. Those with visible mono- or oligoclonal bands or increased gamma fractions were subjected to immunofixation electrophoresis.
Results
Three hundred and sixty-eight patients were included in the study with a mean age of 37.7 y. Of these patients, 326 were on ART for a mean duration of 19.6 months. Monoclonal bands were found in 12 patients (3.2%) and oligoclonal bands in 14 (3.8%). These bands were associated with a shorter duration of ART, increased total protein, acute on chronic phase pattern on electrophoresis and an increased gamma fraction, but not associated with CD4 count and viral load. The majority were of low concentration and of the IgG isotype.
Conclusion
Our study confirms that the prevalence of monoclonal and oligoclonal bands is higher in this HIV-positive cohort on ART compared with that of the general population. However, the prevalence is lower than previously reported in other studies.
Introduction
Infection with human immunodeficiency virus (HIV) is not only associated with a gradual decline in CD4+ T cells, but also with several B cell abnormalities, including polyclonal activation, hypergammaglobulinaemia, autoimmune phenomena, defective response to antigen stimulation and B-cell lymphomas. 1 Monoclonal and oligoclonal proteins have also been noted with increased frequency on serum protein electrophoresis. 2
Monoclonal proteins in a non-HIV-infected population are often associated with B-cell malignancy or an increased risk for developing B-cell malignancy or multiple myeloma. 3,4 The significance of monoclonal proteins in HIV-infected patients is unclear. The incidence of B-cell lymphomas is increased in patients with HIV infection. Plasma cell neoplasms and an increased incidence of multiple myeloma in HIV-infected patients have been reported. This increased incidence in plasma cell neoplasms, however, is not universally observed and not considered an HIV-associated neoplasm. 5
Highly active antiretroviral therapy (HAART) changed the prognosis of patients with HIV infection. Antiretroviral therapy (ART) suppresses viral replication, improves immunodeficiency and immune dysfunction and decreases B-cell hyperstimulation and consequently hypergammaglobulinaemia. Few studies are available examining the prevalence of monoclonal proteins in patients on ART.
In resource poor countries with a high HIV prevalence, such as South Africa, the cost of unnecessary investigations has significant implications for health care spending and allocation of resources. South Africa had an estimated 5.3 million people living with HIV/AIDS in 2008. 6
The aim of the present study was to describe the prevalence and characteristics of monoclonal proteins in a population of HIV-infected patients being followed up at local infectious diseases clinics, as well as the factors associated with the presence of monoclonal proteins.
Methods
Patient selection
This was a prospective descriptive study conducted over a six-month period during 2008, at two local clinics in the Western Cape providing treatment and follow-up to approximately 200 and 1000 adult patients with HIV infection, respectively. Patients were enrolled consecutively as they presented. Both patients on ART and those not yet on ART were included. Paediatric patients were followed up at separate clinics and were not included.
The study protocol was approved by the University of Stellenbosch Ethics Committee. Informed consent was obtained from all patients. A clotted blood sample and a random urine specimen with sodium azide as preservative were collected at enrolment. Clinical information was recorded on a standard proforma by the investigator from information in the medical record and obtained during patient interview. Data collected included: (i) Demographic details: age, gender, ethnic group; (ii) Stage of disease: WHO stage, most recent CD4 count and viral load; (iii) Medical history: previous and current illnesses including tuberculosis (TB), malignancy, autoimmune disease or viral hepatitis; and (iv) ART: Duration of treatment, drugs and change in regimen.
Electrophoresis, densitometry and immunofixation
Serum protein electrophoresis was performed on all serum samples using the ParagonTM Electrophoresis System and AppraiseTM Densitometer (Beckman Coulter Inc., Brea, CA, USA). Three pathologists experienced in the evaluation and interpretation of serum electrophoresis examined the results independently. The pathologists were blinded to the other results. Serum electrophoresis results with visible bands, possible bands or increased gamma fractions, where the presence of a monoclonal band could not be excluded with certainty, were subjected to immunofixation electrophoresis using the ParagonTM IFE kit (Beckman Coulter).
Immunofixation results were reported as monoclonal band, oligoclonal bands or polyclonal with no visible bands present, and the isotype of bands were noted. Criteria used for classification were: (i) Monoclonal bands: a discrete band visible in a single heavy and light chain region or a single heavy or light chain region only and (ii) Oligoclonal bands: discretely visible, corresponding bands in both the kappa and lambda light chain regions, or more than one heavy chain region, or a ‘ladder’ of more than two bands in any one light/and or heavy chain region. Electrophoresis of urine samples for detection of Bence Jones protein was performed only when a monoclonal or oligoclonal band was present on serum immunofixation.
Serum electrophoresis was analysed densitometrically to enable interpretation of acute phase parameters. Findings were reported as follows: no acute phase present, hypoalbuminaemia only, hypergammaglobulinaemia only, an acute phase reaction or acute on chronic phase reaction. An acute phase reaction was reported if the albumin was decreased with increased alpha-1 and/or alpha-2 fractions and gamma fraction within reference limits. Acute on chronic phase was reported if the gamma fraction was increased with an acute phase reaction. Total protein used for quantifying fractions densitometrically was determined on the ADVIATM1650 (Bayer Siemens AG, Munich, Germany) clinical chemistry analyser using the Biuret method.
Statistical analysis
Data were analysed using STATISTICA (data analysis software system) version 8.0 (StaSoft, Inc. [2009]) and Microsoft® Excel®. Descriptive statistics were used to analyse each parameter in terms of distribution, mean, median, quartiles, maximum and minimum values and standard deviation.
For comparison of clinical and electrophoresis-associated factors between patients with a monoclonal band, oligoclonal bands or no bands we used the F-test or Kruskal-Wallis test for age, duration of ART, CD4 count, total protein, albumin and gamma fraction. For gender, the presence of other medical conditions and CD4 count we used the maximum likelihood χ2 test. Continuous variables were compared against each other using regression and correlation analysis. Pearson's correlation coefficient was performed for normally distributed data and Spearman's rank correlation for abnormally distributed data.
Results
Characteristics of the study population
A total of 368 patients were enrolled, including 127 men and 241 women, with an age distribution of 17–70 y. The majority were in the 25–54 y age group with a mean age of 37.7 y (95% CI 36.8–38.6). All major ethnic groups present in the Western Cape were represented. The majority were Black African (n = 255, 65%). Coloured patients, a group with a mixed ethnic background who reside principally in the Western Cape, represented 27% (n = 98) and Caucasians 2% (n = 7). Information on ethnic background was unavailable for the remaining 2% (8) patients.
A total of 326 patients were receiving ART. The duration of therapy was known for 304 patients and varied from two weeks to 13 y. Ninety-five percent of patients were on therapy for less than 48 months (n = 290/304) and 67% (n = 203/304) for less than 24 months. Forty-two patients (14%) were on therapy for six months or less. The mean duration of ART was 19.6 months (median 16 months). Two hundred and ninety-eight patients (95%) were on a first-line ART regimen, which includes Stavudine or Zidovudine, Lamuvidine and Efavirenz or Nevirapine. Fifteen patients were on the second-line regimen consisting of Zidovudine, Didanosine and Lopinavir/Ritonavir.
Viral load results were available for 273 patients (84%) on therapy. ART suppressed viral replication successfully to undetectable levels in 228 patients (83.5%) and 5.5% (17/273) had a viral load of >3 log copies/mL. CD4 counts were available for 353 (96%) of the 368 patients. They ranged from 1 to 1015 cells/μL. The mean CD4 count increased significantly with increased duration of therapy (P = <0.001), but with a wide range and markedly overlapping minimum and maximum values.
Eighty-five cases of medical conditions other than HIV infection were documented. Forty-seven patients were receiving treatment for active Mycoplasma tuberculosis infection. Five patients had chronic pyogenic infections. Two patients were receiving therapy for chronic Cryptococcal meningitis. Five patients had a malignancy including three with Kaposi's sarcoma, one with cervical cancer and one with breast cancer. No cases of severe liver disease were documented; only one patient was followed up for chronic hepatitis B virus (HBV) infection. Screening for HBsAg (hepatitis B surface antigen) became part of the routine assessment after completion of the study. Other conditions included peripheral neuropathy, cerebro-vascular accident, epilepsy, HIV-associated myelopathy, severe anaemia, diabetes mellitus, arthritis, psoriasis, renal disease, asthma and chronic obstructive pulmonary disease.
Electrophoresis results
The serum total protein values ranged from 56.1 to 123.4 g/L with a mean value of 80.3 g/L (95% CI 79.4–81.3 g/L). Only 104 patients (28%) had a value of more than 85 g/L, the upper reference limit in our laboratory.
The gamma fraction ranged from 8.2 to 80.6 g/L with a mean value of 25.4 g/L (95% CI 24.6–26.3). Although the range of gamma fractions is wide, most patients had values under 30 g/L and 143 patients (39%) fell within the reference range (upper limit 22 g/L). Only 82 patients (22%) had a value of more than 30 g/L and 15 (4.9%) more than 40 g/L. Increased gamma fractions were found for all durations of therapy and CD4 counts. However, levels decreased significantly with increasing CD4 count (P = 0.001). Markedly increased values (>30 g/L) were found more often in the earlier stages of therapy or in patients not on ART.
The majority of the study population (175/368; 72%) had either acute phase or acute on chronic phase patterns on electrophoresis (Figure 1). Only 15 patients (6%) had no parameters associated with infection or inflammation. A decreased gamma fraction was observed in two patients. The mean duration of ART did not differ significantly between the different inflammation-associated patterns.
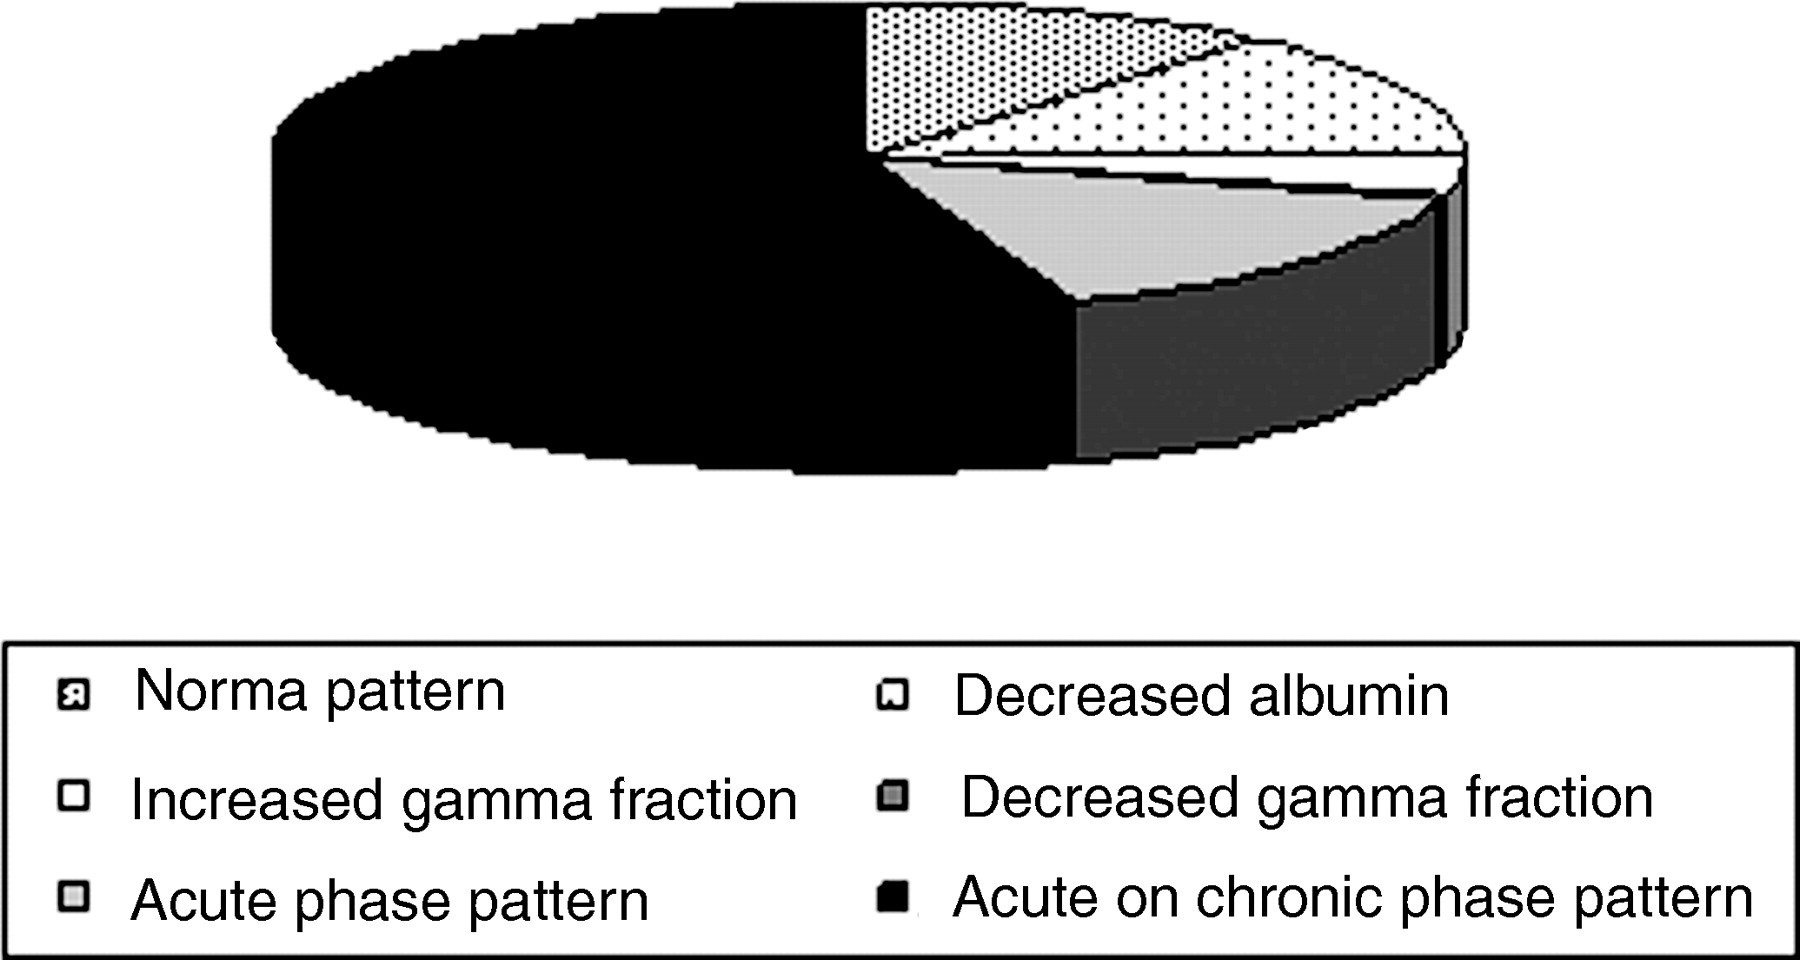
Serum electrophoresis patterns observed in the study population
Immunofixation
Ninety-seven cases (97/368; 26%) met our criteria for further immunofixation electrophoresis. The presence of a band on serum electrophoresis was the indication for immunofixation in only 26 (27%). The majority of immunofixations were performed due to an increased gamma area where the presence of a band could not be reliably excluded.
Monoclonal bands were identified in 12 patients (3.2% of the total study population) and oligoclonal bands in a further 14 (3.8%).
The size of the monoclonal bands was not quantifiable in all but two cases due to a general polyclonal background. The two peaks that could be quantified were 3.8 and 8.2 g/L in size. One of these was in the beta-gamma region. They were not necessarily larger than the bands that could not be quantified.
IgG was the only heavy chain isotype identified and was present in 10/12 monoclonal (83%) and 9/14 oligoclonal bands (64%). Kappa was the light chain isotype most often identified in monoclonal bands, 9/12 (75%). Oligoclonal bands had kappa light chains only in 7/14 (50%) cases and both kappa and lambda light chains in 7/14 (50%) cases.
Urine for electrophoresis was available for only 7/12 patients with monoclonal bands and 7/14 patients with oligoclonal bands. Two of the patients had non-specific proteinuria, but no Bence Jones Proteins were detected on any of the samples.
Characteristics of patients with monoclonal or oligoclonal gammopathy
The significance of oligoclonal gammopathy is more uncertain than that of monoclonal gammopathies in patients with HIV infection; therefore we considered the characteristics of the two groups separately (Tables 1 and 2).
Clinical factors compared between patients with no bands, monoclonal bands and oligoclonal bands on serum electrophoresis
Where no unit is indicated, values represent number of patients (%) [95% CI interval]; N, no bands; O, oligoclonal bands; M, monoclonal bands; TB, tuberculosis; ARV, antiretroviral
*F test
† χ 2 test
‡Kruskal–Wallis test
¶Detectable includes values detected but lower than lower limit of detection
Electrophoresis-associated factors compared between patients with no bands, monoclonal bands and oligoclonal bands on serum electrophoresis
Where no unit is indicated, values represent number of patients (%) [95% CI interval]; N, no bands; O, oligoclonal bands; M, monoclonal bands
*F test
† χ 2 test
‡Kruskal–Wallis test
The age of patients with monoclonal gammopathy ranged from 27 to 48 y with a mean of 39.2 y (95% CI 34.1–44.2). Patients with oligoclonal gammopathy had a wider age range of 23–54 y with a slightly younger mean of 36.7 y (95% CI 32–44.1). The male to female ratio differed slightly, with more females in the monoclonal gammopathy group. The male to female ratio was 1:1 for monoclonal gammopathy and 3.7:1 for oligoclonal gammopathy.
The duration of ART for both groups ranged widely. For patients with monoclonal bands it ranged from six to 36 months. Four patients with oligoclonal bands were not receiving ART, with up to 50 months of therapy recorded in the remainder. The mean duration of therapy was 20.1 months for patients with monoclonal bands and 10.3 for patients with oligoclonal bands. The majority of patients with oligoclonal bands (n = 10/14) were on therapy for less than 12 months.
The CD4 counts for patients with monoclonal bands ranged from 135 to 564 cells/μL with a mean of 294 cells/μL (95%CI 179–408). Patients with oligoclonal bands had CD4 counts ranging from 27 to 635 and a mean of 236 cells/μL (95% CI 135–338). In both groups, the majority of patients had CD4 counts less than 350 cells/μL. Nine out of 11 patients (82%) with monoclonal bands and 11/14 patients (79%) with oligoclonal bands had CD4 counts less than 350 cells/μL.
The viral load was undetectable in 8/10 patients with monoclonal bands. Ten of the 14 patients with oligoclonal bands were on therapy, with viral loads available for only seven. The viral load was undetectable in only 3/7 of these patients.
TB is the only other medical condition found in these patients. Two patients with monoclonal bands and four with oligoclonal bands were receiving TB treatment.
The serum total protein for the patients with monoclonal bands ranged from 74.8 to 118.5 g/L, with a mean of 90.4 g/L (95% CI 85.3–95.7). Patients with oligoclonal bands had values ranging from 79.5 to 98.5 g/L with a mean of 88.7 g/L (95% CI 83.9–93.3). Eight of 12 patients (67%) with monoclonal bands and 8/14 patients (57%) with oligoclonal bands had values above 85 g/L, the upper limit of the reference range used in our laboratory.
Albumin as determined densitometrically was decreased in all but two patients with monoclonal and oligoclonal bands. Levels ranged from 20.9 to 41.5 g/L in patients with monoclonal bands and 16.5 to 32 g/L in those with oligoclonal bands, with mean values of 30 g/L (95% CI 27–32.9) and 27.2 g/L (95% CI 24.5–29.9) respectively.
The gamma fraction was above the upper limit of the reference range in our laboratory (22 g/L) in all but one patient. Levels ranged from 13.8 to 64.7 g/L in patients with monoclonal bands and from 24.5 to 58.3 g/L in those with oligoclonal bands, with mean values of 34.4 g/L (95%CI 29.9–39) and 35.3 g/L (95%CI 31–39.5), respectively.
As expected with the increased gamma and low albumin fractions, 24/26 patients (92%) had an acute on chronic phase pattern on electrophoresis.
Factors associated with monoclonal or oligoclonal gammopathy
To identify factors that may distinguish patients with monoclonal and oligoclonal gammopathies from those with no bands on electrophoresis, we compared clinical and electrophoresis associated factors using univariate analysis. We considered patients with monoclonal and oligoclonal bands as separate groups.
We determined the P values for age, gender, coexisting medical conditions, presence or absence of ART at the time, duration of ART, mean CD4 count and detectable or undetectable viral load.
The only factor showing some significance was the mean duration of ART. The F test does not give a significant difference, but a few patients are responsible for an abnormal distribution of data. Interpretation was therefore also done with the Kruskal–Wallis test. This showed a significant difference in the duration of treatment between patients with oligoclonal bands and those with no bands (P = 0.03). The mean duration of therapy can be seen to differ markedly, a mean of 10.3 compared with 19.9 months.
Apart from the clinical factors, we also considered electrophoretic parameters to identify possible factors that differed between the groups. These included serum total protein, albumin as determined densitometrically, the gamma fraction size, the presence and type of acute phase pattern as well as the presence of a visible band.
The serum total protein (P < 0.001), gamma fraction (P < 0.001), acute phase pattern on serum protein electrophoresis (P < 0.006), all differed significantly between patients with no monoclonal bands present compared with those with monoclonal and oligoclonal gammopathies. The albumin levels did not differ significantly between groups. The gamma fraction is therefore the most likely factor to also influence the significant difference seen between serum total protein and the presence of acute on chronic phase pattern in the groups. However, if the gamma fraction of only those patients who also had immunofixation is considered, it does not differ significantly between groups (F test: P = 0.324; Figure 2).
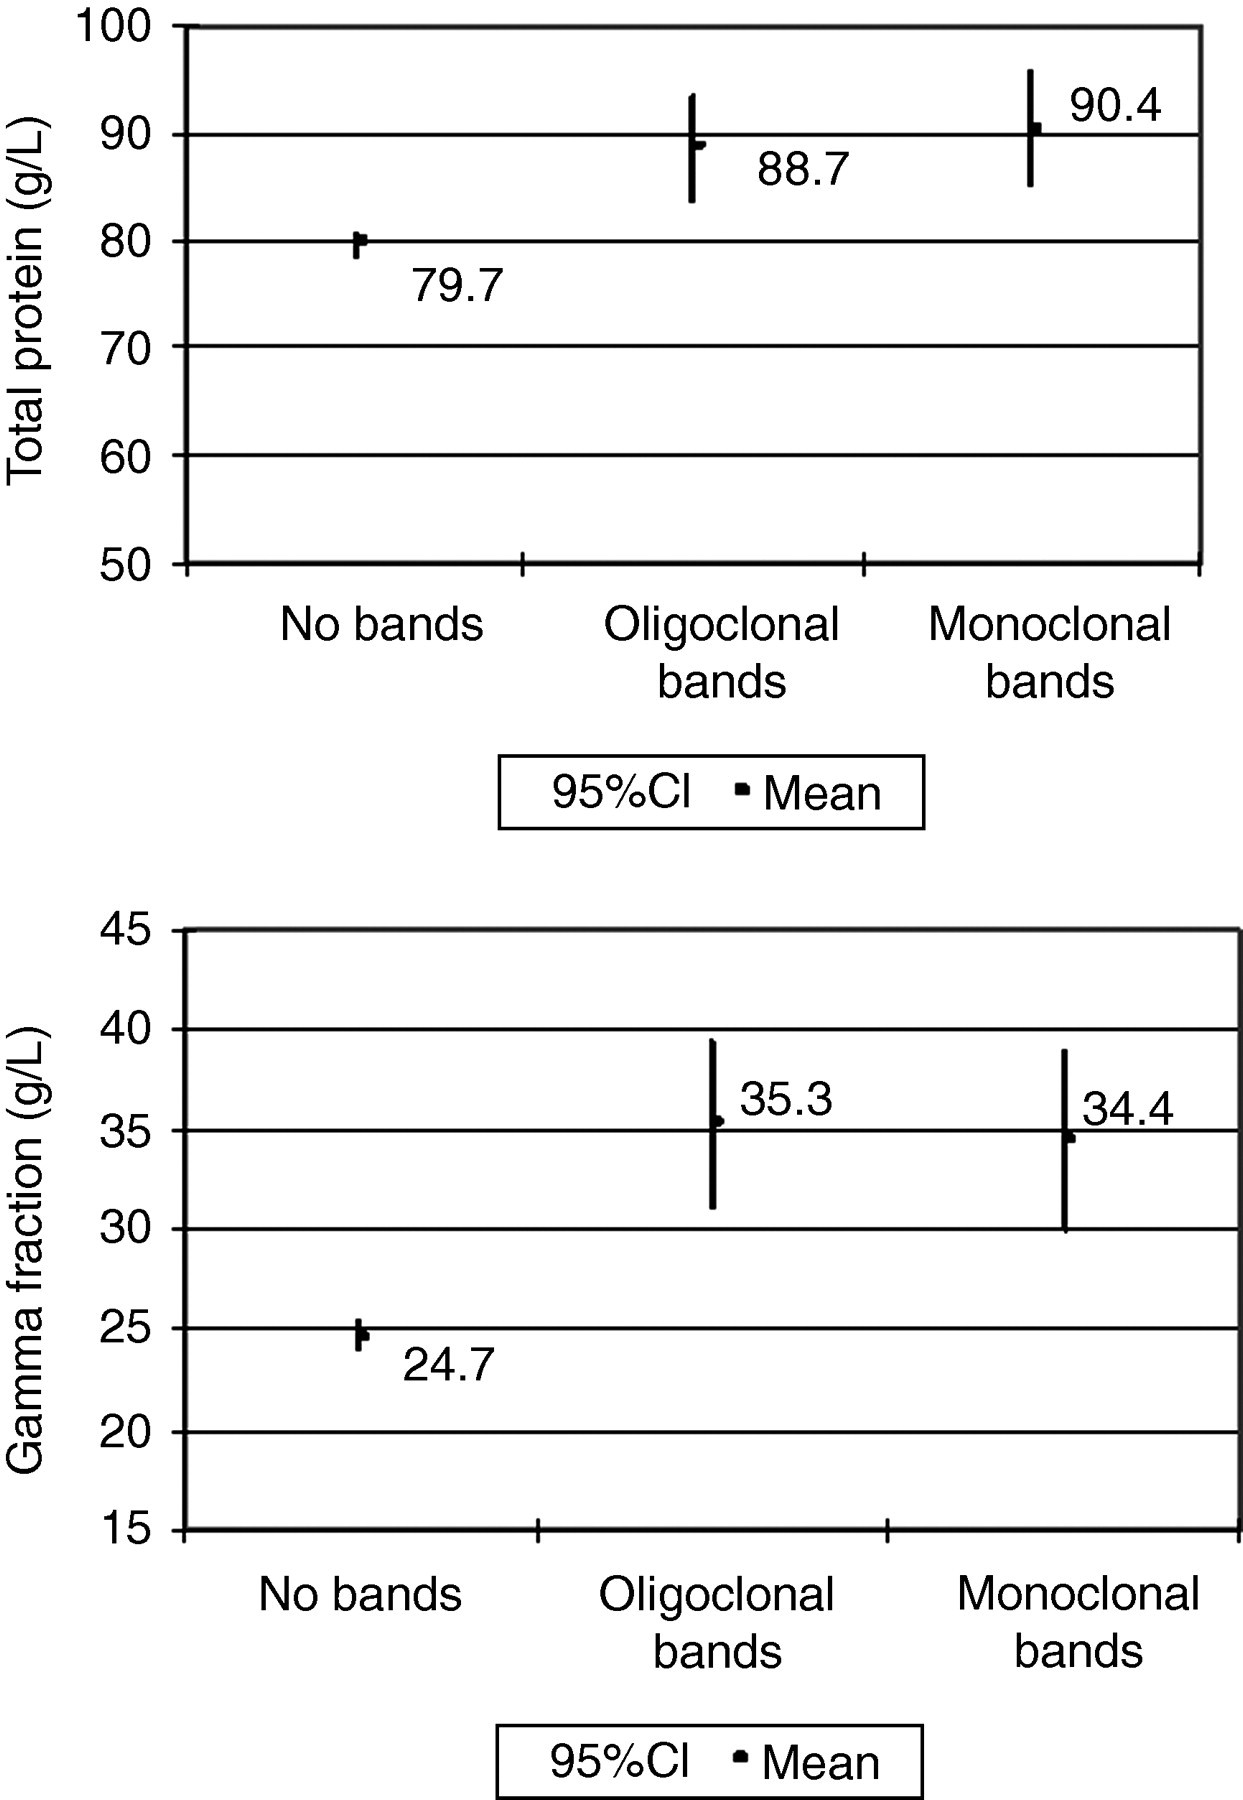
Mean total protein and gamma fractions compared between patients with no bands, monoclonal bands and oligoclonal bands
Despite the low threshold for immunofixation, most of the monoclonal and oligoclonal bands were identified on patients who had a visible band present on serum electrophoresis. Nine of the 12 patients (75%) with monoclonal bands and 6/14 (43%) with oligoclonal bands had a visible band on serum electrophoresis. Eleven patients with what appeared to be a visible band on serum electrophoresis did not have visible bands on immunofixation (11/71, 7.8%). The proportion of patients with a visible band as indication for immunofixation differed significantly between patients with monoclonal bands compared with those with no bands (P = 0.01), but less so in patients with monoclonal bands as compared with those with oligoclonal bands (P = 0.83). The bands were generally of a small size and some may not have shown up with immunofixation. Other possible explanations may be non-immunoglobulin bands, e.g. haemoglobin from haemolysed samples or a high C-reactive protein.
If a visible band on serum electrophoresis was the only indication for immunofixation, a total of 15/26 (58%) monoclonal and oligoclonal bands would have been identified, missing 11/26 (42%). The presence of a visible band on serum electrophoresis is therefore a significant factor predicting the presence of a band on immunofixation, but is not sensitive enough to serve as the only indication for immunofixation.
Analysis with stepwise logistic regression identified the gamma fraction size as the only factor associated with an increased risk of a band on electrophoresis. With an increased gamma fraction, the odds ratio of having a monoclonal or oligoclonal gammopathy is 1.1 (95% CI 1.057–1.146).
Discussion
The prevalence of monoclonal and oligoclonal proteins in our study cohort with HIV infection was found, in agreement with the current literature, to be higher than expected for the general population (1–3% in patients 50–70 y, <2% in patients younger than 40 y). 7–9 However, this prevalence in HIV-infected patients was low in comparison to studies published in the current literature, including those in patients on ART. We found a prevalence of 3.2% for monoclonal gammopathies and 3.8% for oligoclonal gammopathies compared with 4.4% and 8.1%, respectively, in the most recent study by Konstantinopoulos et al. 10 Only Lefrere et al. 11 reported a lower prevalence (2.5%) of monoclonal gammopathy. The characteristics of the bands on electrophoresis are also similar to that described in previous studies.
The cohort included in our study is demographically representative of the patients attending clinics for HIV disease management in the Western Cape. 12–16
Variables which could account for this lower prevalence include inter alia differences in sample size, ethnic composition, patient age, stage of disease, coexisting conditions, inpatient versus outpatient status, duration or efficacy of therapy and electrophoretic methods used.
The number of patients (368) included in our study compared well with that of previously published studies. Two of the largest studies to date from Lefrere et al. and Konstantinopoulos et al. 10 included 243 patients (not on therapy) and 320 patients (on therapy), respectively.,11 The 368 patients included in our study represents the largest cohort study to date on monoclonal gammopathy in HIV patients. Additionally, this is the first study to our knowledge in English scientific literature conducted in Sub-Saharan Africa, which has the highest prevalence of HIV in the world.
Ethnic background is a recognized variable in the prevalence of monoclonal gammopathy of undetermined significance (MGUS) in a given population. 17 People from various ethnic backgrounds reside within the Western Cape, the majority being Black or Coloured (mixed race). Most of the published studies were conducted in North America where subjects from African-American, Caucasian and Hispanic backgrounds were included. This difference in ethnic background may be a contributing factor for the difference in prevalence of MGUS observed.
The prevalence of MGUS increases with age in the general population. The mean age and age range of patients included in our study are similar to that of previous studies. In our study cohort age ranged from 17 to 70 y (mean 37.7 y). Previous studies included patients with a mean age of 33, 18 34 11 and 42 y. 10 The study by Konstantinopoulos et al. had an age range of 7–67 y with a median age of 42 y. Additionally, the authors found younger age a factor associated with banding patterns on electrophoresis. 10 In our study, age did not differ significantly between patients with or without bands.
Our study had a different gender ratio than previous studies, with more females than males. The male to female ratios reported in previous studies varied between 2.2:1 19 and 3.8:1. 10, Some studies included men only. Konstantinopoulos et al. found female gender to have a higher incidence of monoclonal or oligoclonal banding on electrophoresis. Pontet et al. also reported a higher incidence of monoclonal bands in the female population (12%) versus 11% for male population. MGUS in the general population usually reports an increased incidence in men. 7 However, in our study, gender did not differ significantly between patients with or without banding patterns.
The presence of coexisting medical conditions may possibly explain our difference in prevalence. Although they did not report on prevalence, seven patients (28%) in the study by Amara et al. 20 had co-infection with hepatitis C virus (HCV) and two had chronic active HBV infection. In our study no patients gave a history of HCV and only one had chronic HBV infection. TB was the most common coexisting condition, not surprisingly since the Western Cape has one of the highest incidences in the world. 21,22 Infection with M. tuberculosis commonly causes a polyclonal hypergammaglobulinaemia, although cases with monoclonal peaks have been reported in the literature. 23–25 TB, however, did not increase the risk of finding a monoclonal peak on electrophoresis in our study.
Our study cohort consisted of outpatients from peripheral clinics. It is possible that patients in other studies may have been referrals to university or tertiary hospital clinics for management, which may increase the number of patients with coexisting medical conditions and therefore the prevalence of MGUS.
The most significant difference in our study compared with earlier studies is ART. Only one other study was conducted post-1996, in the era of ART. ART only became available in the public sector in South Africa in 2003/2004. 26 Accordingly, most of the patients in our study were receiving ART, although most for less than 4 y. Konstantinopoulos et al included a cohort on ART, in some cases for up to 15 y. The mean duration was 8 y for those patients with monoclonal gammopathy. 10 As reported, the prevalence of both monoclonal and oligoclonal bands in our study was slightly lower (3.2% and 3.8% versus 4.4% and 8.1% respectively). We found that the duration of ART had a significant influence on the presence of oligoclonal, but not monoclonal bands. Konstantinopoulos et al. did not report the effect of duration of therapy due to a lack of data.
Most patients in our study had acute phase reactions and/or a variable degree hypergammaglobulinaemia. This differs from the study by Konstantinopoulos et al. where polyclonal hypergammaglobulinaemia was only detected in six patients by visual inspection of electrophoretograms and 83.8% of patients had a normal pattern. IgG analysis found modestly elevated levels of gammaglobulins in 43% patients, with only 10% having markedly increased levels. 10 Our study population was on ART for a much shorter time period and we found that gamma fraction does decrease significantly with increased duration on ART and an increase in CD4 count. Also, differences in nutritional status due to socioeconomic status and the burden of infections other than HIV may be an important factor in our population.
All previous studies used gel electrophoresis with immunofixation electrophoresis. Six used high-resolution agarose gel electrophoresis, four used the Paragon™ system (Beckman-Coulter®) and the two by Pontet et al. 19 and Konstantinopoulos et al. 10 used the Hydrasys™ system (Sebia, Norcross, GA). Lefrere et al. used acetate electrophoresis and laser nephelometry to quantify peaks. This may be one of the factors which could influence the lower prevalence reported in that study. 27
The criteria used to interpret results also differ between studies. Oligoclonal and monoclonal bands are often grouped together, resulting in increased prevalence rates.
The characteristics of the bands found in our study were similar to those in previous studies. All of the bands we found were either of IgG kappa or IgG lambda type, or a light chain type only. No IgA or IgM heavy chain isotypes were found. IgG was also the isotype found most frequently by previous studies. Turbat-Herrera et al. 28 and Amara et al. 20 also reported the presence of IgA isotypes among their cases with monoclonal gammopathies. They found only two and one IgA bands, respectively. Konstantinopoulos et al. also reported IgA and IgM isotypes in two of their patients with oligoclonal bands. In contrast, Pontet et al. had no monoclonal IgA bands, only IgG and IgM, but one oligoclonal IgA band. 10,19 Ng et al. 29 also described an IgA band in one of the two patients whose monoclonal peak did not seem to be directed to HIV antigens.
Three patients in our study had biclonal gammopathies. Triclonal and biclonal gammopathies were more common in the other studies in HIV patients: more so than in the general population with MGUS. Pontet et al. 19 reported three patients with biclonal and one patient with triclonal gammopathy. Interestingly, we found one patient with only an IgG heavy chain without a corresponding light chain, which was confirmed with repeat immunofixation electrophoresis. Heriot et al. 2 also reported two patients with IgG heavy chains only.
The size of the peaks detected in our study could not be quantified in most instances due to the low concentration and masking by the polyclonal background. The majority of peaks reported in previous studies were also of low concentrations. Konstantinopoulos et al. 10 reported an estimated concentration range of 0.3–4.65 g/L, with an average of 1.85 g/L. Amara et al. reported a range of peak sizes from 2 to 60 g/L. However, some of these patients had pre-existing B-cell malignancies. 20
Immunoparesis was not found in any of the cases identified with monoclonal gammopathies in our study. In all but one, the monoclonal gammopathies were found on a background of polyclonal hypergammaglobulinaemia.
We did not find Bence Jones proteins in any of the 14 cases on which we performed urine electrophoresis. Lefrere et al. 11 also reported no Bence Jones proteins in their study. Amara et al. found Bence Jones proteins in three out of the 25 patients in their study. Of these, one was diagnosed with multiple myeloma, one with marginal zone non-Hodgkin's lymphoma and one with MGUS. 20 In our view, the finding of Bence Jones proteins should serve as in indication for further investigation of a patient, irrespective of the finding on serum protein electrophoresis. It must, however, be noted that screening for Bence Jones protein was only performed when bands were noted on serum protein electrophoresis and not all patients.
The presence of a visible band on serum electrophoresis identified most patients with a monoclonal band. However, this is not sensitive enough to be recommended as the only criteria for immunofixation. Increased total protein and a markedly increased gamma fraction seem to identify the majority of patients. Most patients also displayed a background pattern of acute on chronic inflammation. The patients with oligoclonal bands were on ART for a shorter time period than those with no or monoclonal bands. All of these factors suggest an association with increased immune activation and antigen stimulation associated with high viral loads and immune dysregulation. A detectable viral load and higher CD4 count was also associated with banding patterns in the study by Konstantinopoulos et al., 10 again underlining the effect of immune activation. We did not find a significant difference in CD4 count or viral loads in patients with or without banding patterns. This does not exclude transient increases in viral load.
Monoclonal immunoglobulins are found in a number of disorders: both benign and malignant. Monoclonal immunoglobulins detected without evidence of plasma cell dyscrasias or lymphoproliferative disorders (referred to as MGUS) may however progress to malignancy and patients should be followed up. 30 None of the patients with monoclonal bands in this study had any clinical evidence of plasma cell dyscrasia or a lymphoproliferative disorder. The bands were mostly of small size (<5 g/L) which represents a lower risk and no immunoparesis was present.
The associated risk of malignancy or development of malignancy underlines the importance of monoclonal immunoglobulins in HIV-infected patients. The risk of progression to malignancy of monoclonal proteins in HIV is not yet clear. To date only four studies investigated the risk of progression to malignancy of monoclonal proteins in patients with HIV infection. 19,31–33 No malignant transformation was noted, but the studies included small numbers of patients, followed up for a short period before the availability of ART.
Our study has several limitations:
We did not perform immunofixation electrophoresis on all specimens, and therefore a higher prevalence of monoclonal proteins cannot be excluded.
We did not perform urine protein electrophoresis to screen for Bence Jones protein on all patients, only those with bands seen on serum protein electrophoresis. We did not perform CD4 counts and viral loads at the time of enrolment. We relied on the latest CD4 count and viral load that was used to make therapeutic decisions, whether it was taken on the same day or within the previous six months. It was not always possible to find or confirm previous results.
We could not include clinical stage of disease in our analysis because it was not documented in all the patients, nor were the criteria that the clinical staging was based on. Additionally, we did not include the duration of HIV infection because many patients in our country present at a late stage of disease when ART is already required.
Most of the patients in our study were on ART at enrolment. The group not yet on therapy is small and we could not accurately compare the prevalence of monoclonal and oligoclonal bands between them. However, oligoclonal bands seemed more frequent in those not yet on or in the first few months after the start of ART. All patients with a monoclonal gammopathy were receiving ART.
The bands found on electrophoresis were often very faint. Interpretation of the serum electrophoresis was subjective and often differed between individuals. Consistent with routine practice, immunofixation electrophoresis was performed on any sample where the suspicion of a monoclonal protein was high. Cases were classified as either monoclonal, oligoclonal or without any bands only if all three interpreting pathologists concurred.
Conclusion
We found a prevalence of 3.2% for monoclonal gammopathy and 3.8% for oligoclonal gammopathies in our study population. This confirms that the prevalence is higher than expected for the general population but lower than that found in most studies in the current literature.
Monoclonal and oligoclonal gammopathy is associated with increased total protein or gamma fraction and acute on chronic phase pattern on routine serum protein electrophoresis. No clinical factor was identified that could differentiate between patients with or without monoclonal bands. Patients with oligoclonal bands were either not receiving ART or have been on therapy for a short period.
An increased gamma fraction increases the likelihood of a band on serum electrophoresis. A visible band on serum electrophoresis identifies most, but not all, patients with monoclonal and oligoclonal bands on immunofixation electrophoresis, and can therefore not be used as the only criterion for immunofixation.
The risk of progression to B-cell malignancies has not been established, although few studies performed in the pre-HAART era suggest a low risk. This study showed that the presence of monoclonal or oligoclonal bands do not affect a large number of patients. Therefore, until definite guidelines can be established for the detection and follow-up of monoclonal gammopathies, it should be recommended that HIV-positive patients with a suspicion of monoclonal gammopathy, or such finding on routine serum electrophoresis, should at the very least be followed up. Management and further investigations should be guided by clinical symptoms and signs, associated laboratory findings and the size of the monoclonal protein, as for any other non-HIV infected individual.
DECLARATIONS