
Abstract
Background
Fulminant type 1 diabetes mellitus (FT1DM), a subtype of type 1 diabetes mellitus, was first reported as a disease entity in 2000. Ketoacidosis at initial onset due to acute pancreatic cell destruction makes early diagnosis and treatment for FT1DM mandatory. In the early period of FT1DM, haemoglobin (Hb)A1C levels are not markedly elevated. This study investigated serum glycated albumin (GA), which reflects acute short-term changes in plasma glucose, as a new clinical index for FT1DM at disease onset.
Methods
Subjects comprised 35 patients with FT1DM who had undergone measurement of HbA1C and serum GA at initial visit and 42 patients with type 2 diabetes mellitus (T2DM) with HbA1C <8.5% and no history of diabetes treatment as controls.
Results
HbA1C was significantly lower in FT1DM than in T2DM, whereas serum GA was significantly higher. GA/HbA1C ratio was thus significantly higher in FT1DM than in T2DM (3.9 ± 0.5 versus 2.8 ± 0.3; P < 0.0001). GA/HbA1C ratio was >3.2 in 41 of 42 FT1DM patients (98%), compared with only one of 32 T2DM patients (3%).
Conclusions
Serum GA is significantly higher in FT1DM than in T2DM, whereas HbA1C is significantly lower. FT1DM can thus be distinguished from untreated T2DM by GA/HbA1C ratio at initial visit before treatment for diabetes.
Introduction
Fulminant type 1 diabetes mellitus (FT1DM) is a new subtype of type 1 diabetes first reported in 2000 by Imagawa et al. 1 and characterized clinically by acute and almost complete pancreatic β-cell destruction without islet-related autoantibodies, such as glutamic acid decarboxylase antibody or insulinoma-associated antigen 2 antibody. 1–3 In Japanese patients, FT1DM reportedly accounts for about 19.4% of all cases of type 1 diabetes with abrupt onset. 2 In contrast to plasma glucose (PG) levels, which are markedly elevated at clinical onset, HbA1C levels are normal or only slightly elevated in FT1DM.
Compared with non-diabetes, diabetes is known to be associated with higher glycation of several types of proteins, suggesting that some of these proteins play roles in the onset and progression of complications in chronic diabetes. 4 Among these glycated proteins, haemoglobin (Hb)A1C is widely used as a parameter of chronic glycaemic control. 5,6 Serum glycated albumin (GA) is also used as a parameter of glycaemic control. Since the half-life of albumin is shorter than that of erythrocytes, serum GA reflects PG excursions over a shorter period (about 14 d). 7,8 Serum GA thus more accurately reflects acute changes in PG. As FT1DM is characterized by abrupt elevation of PG, we hypothesized that high serum GA levels might offer a useful index in patients without markedly elevated HbA1C.
FT1DM quickly results in acute ketoacidosis and requires urgent diagnosis and treatment, and misdiagnosis of FT1DM as type 2 diabetes mellitus (T2DM) can be life-threatening. However, HbA1C is usually normal or only slightly elevated in both FT1DM and T2DM at disease onset. We therefore investigated the usefulness of serum GA or GA/HbA1C ratio in FT1DM, particularly in comparison with T2DM.
Methods
Patients
We first enrolled 35 FT1DM patients (15 men, 20 women), including 31 patients identified from a nationwide survey 2 and four patients identified from case reports. 9–12 Clinical characteristics of all patients (age at onset, sex, body mass index [BMI] and date of onset of hyperglycaemia) were recorded. The following laboratory data were determined at first visit before treatment for diabetes in each hospital: PG concentration; HbA1C levels and serum GA levels. In addition, 42 outpatients (33 men, nine women) initially diagnosed with T2DM (at initial visit) evaluated at Kinki Central Hospital between June 2006 and April 2009 who had not received treatment for diabetes were enrolled as controls. HbA1C and serum GA levels were determined before starting diabetes treatment at first visit in these T2DM patients. The T2DM patients whose HbA1C levels were more than 8.5% were excluded because inclusion criteria for FT1DM was HbA1C <8.5% at first visit. 1,2 They showed HbA1C <8.5% and no past history of diabetes treatment. Due to potential effects on HbA1C and serum GA values, exclusion criteria for both groups were as follows: pregnancy; renal, hepatic, hematologic, malignant, or thyroid disease; and steroid therapy. Diagnosis of FT1DM and T2DM was based on previously reported criteria. 2,13
Laboratory measurements
PG was determined using the glucose-oxidase method. HbA1C was measured by high-performance liquid chromatography, with calibration using Japan Diabetes Society Lot 2. 14 Serum GA was determined by enzymatic methods using albumin-specific protease, ketoamine oxidase and albumin assay reagent (Lucica GA-L; Asahi Kasei Pharma, Tokyo, Japan). 15,16 GA was hydrolysed to amino acids by an albumin-specific proteinase, and then oxidized by ketoamine oxidase to produce hydrogen peroxide, which was measured quantitatively. GA level was calculated as the percentage of GA relative to total albumin, which was measured in the same serum sample using a new bromocresol purple method. 15
Statistical analyses
Data are presented as mean ± standard deviation (SD). Correlation coefficients were calculated by simple regression analysis, and differences in means between groups were analysed by unpaired Student's t-test. Correlation coefficients were calculated by simple regression analysis. The stepwise multivariate analysis was performed to identify explanatory variables for FT1DM. The explanatory variables included for the analysis were age, sex, BMI and GA/HbA1C ratio.
Sensitivities and specificities of each of the three methods (HbA1C, serum GA and GA/HbA1C ratio) were calculated and used to generate receiver operating characteristic (ROC) curves. 17,18 Evaluation of diagnostic accuracy was accomplished by ROC analyses.
All analyses were performed using StatView software (version 5.0 for Windows; Abacus Concepts, Berkeley, CA, USA). Values of P < 0.05 were considered statistically significant.
Results
Mean age was significantly younger in FT1DM patients (42.2 ± 14.4 y) than in T2DM patients (56.1 ± 13.1 y; P < 0.0001). Mean BMI was significantly lower in FT1DM patients (20.9 ± 2.7 kg/m2) than in T2DM patients (25.0 ± 4.0 kg/m2; P < 0.0001). In the FT1DM patients, mean duration of diabetes was 3.8 ± 2.3 d (Table 1).
Clinical characteristics of fulminant type 1 diabetes mellitus and type 2 diabetes mellitus
FT1DM, fulminant type 1 diabetes mellitus; T2DM, type 2 diabetes mellitus; BMI, body mass index; Hb, haemoglobin; GA, glycated albumin
*Randomly measured plasma glucose
†Fasting plasma glucose, parentheses denote range
In patients with FT1DM at initial diagnosis, randomly measured PG was markedly elevated (818 ± 340 mg/dL; range, 421–2250 mg/dL). In patients with T2DM, fasting PG was 150 ± 40 mg/dL (range, 113–341 mg/dL). HbA1C was significantly lower in FT1DM patients (6.0 ± 0.8%) than in T2DM patients (7.0 ± 0.7%; P = 0.0002). By contrast, serum GA was significantly higher in FT1DM patients (23.6 ± 4.3%) than in T2DM patients (19.5 ± 2.5%; P < 0.0001) (Figure 1).
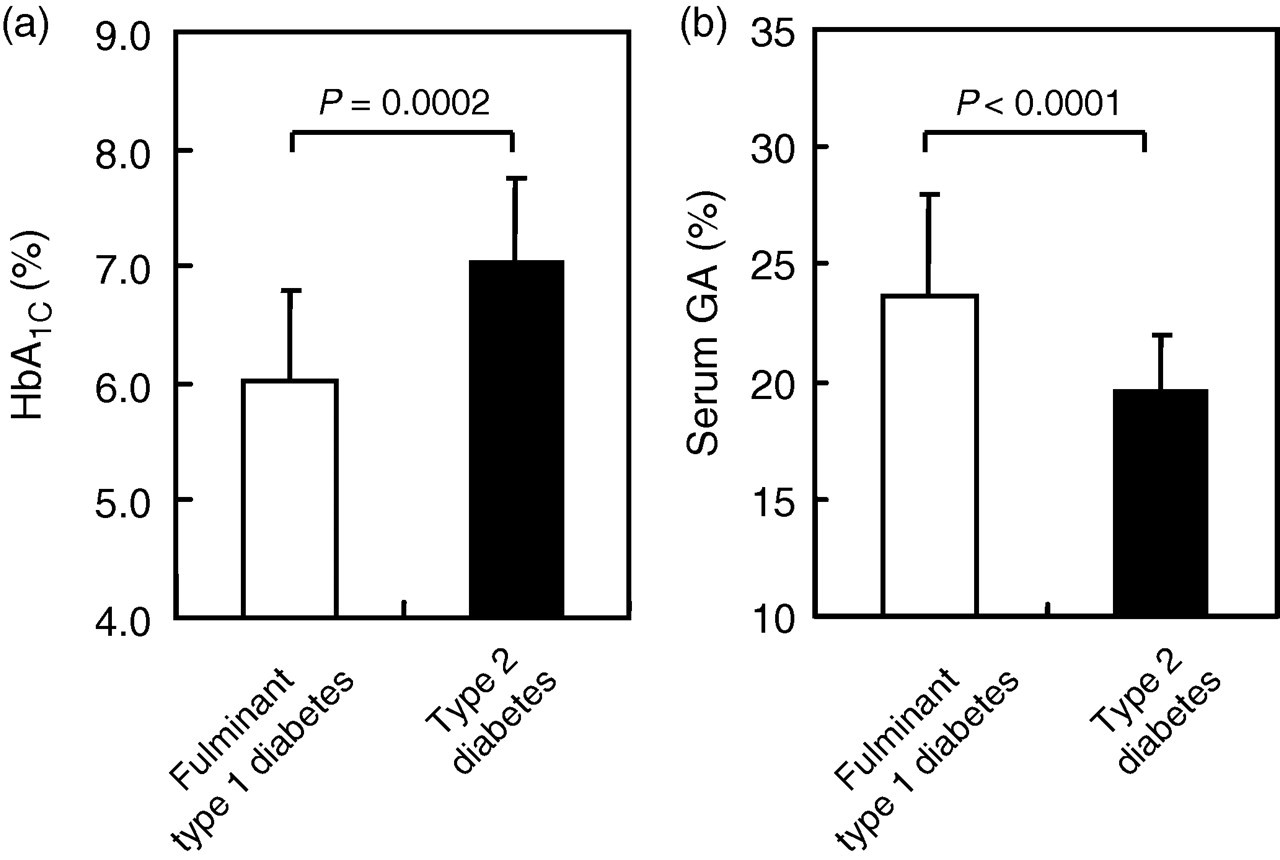
Haemoglobin (Hb)A1C (a) and serum glycated albumin (GA) (b) in patients with fulminant type 1 diabetes mellitus (open bar) and type 2 diabetes mellitus (solid bar)
In T2DM patients fasting PG was significantly correlated with both HbA1C (R = 0.510, P = 0.0015) and serum GA (R = 0.404, P = 0.0146), while in FT1DM patients, randomly measured PG was significantly correlated with serum GA (R = 0.495, P = 0.003), but not with HbA1C (R = 0.220, P = 0.204). There was no significant relationship between BMI and serum GA in all the patients. No significant association was observed between BMI and HbA1C.
A significant positive correlation existed between HbA1C and serum GA in T2DM patients (R = 0.683, P < 0.0001) (Figure 2). FT1DM patients also showed a significant positive correlation between HbA1C and serum GA (R = 0.610, P = 0.0001) (Figure 2). The regression line for serum GA levels to HbA1C levels was shifted upwards as compared with the T2DM group (y = 3.36x + 3.45 in FT1DM patients versus y = 2.30x + 3.40 in T2DM patients), indicating relatively high elevation of serum GA levels compared with that of HbA1C levels (Figure 2).
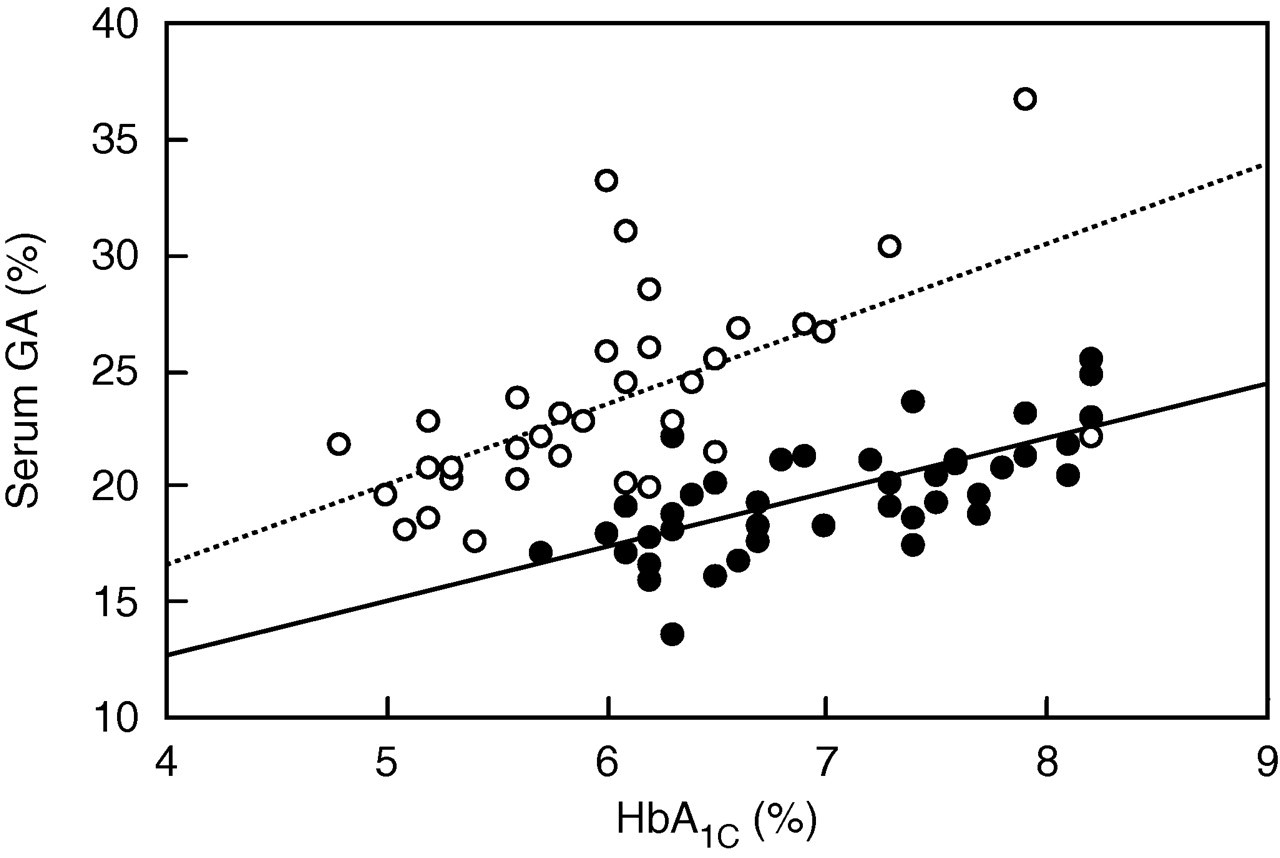
Correlation between haemoglobin (Hb)A1C and serum glycated albumin (GA) in patients with fulminant type 1 diabetes mellitus (open circles) and type 2 diabetes mellitus (solid circles). The regression line for each is also shown
GA/HbA1C ratio was significantly higher in FT1DM patients (3.9 ± 0.5) than in T2DM patients (2.8 ± 0.3; P < 0.0001) (Figure 3). GA/HbA1C ratio was >3.2 in 41 of 42 FT1DM patients (98%), compared with only one of 32 T2DM patients (3%) (Figure 3). ROC analyses showed that although both specificity and sensitivity of HbA1C and those of serum GA for differentiating FT1DM and FT2DM were low, a cut-off value of 3.2 for GA/HbA1C ratio yielded 97% sensitivity and 98% specificity for differentiating FT1DM from T2DM (Figure 4).
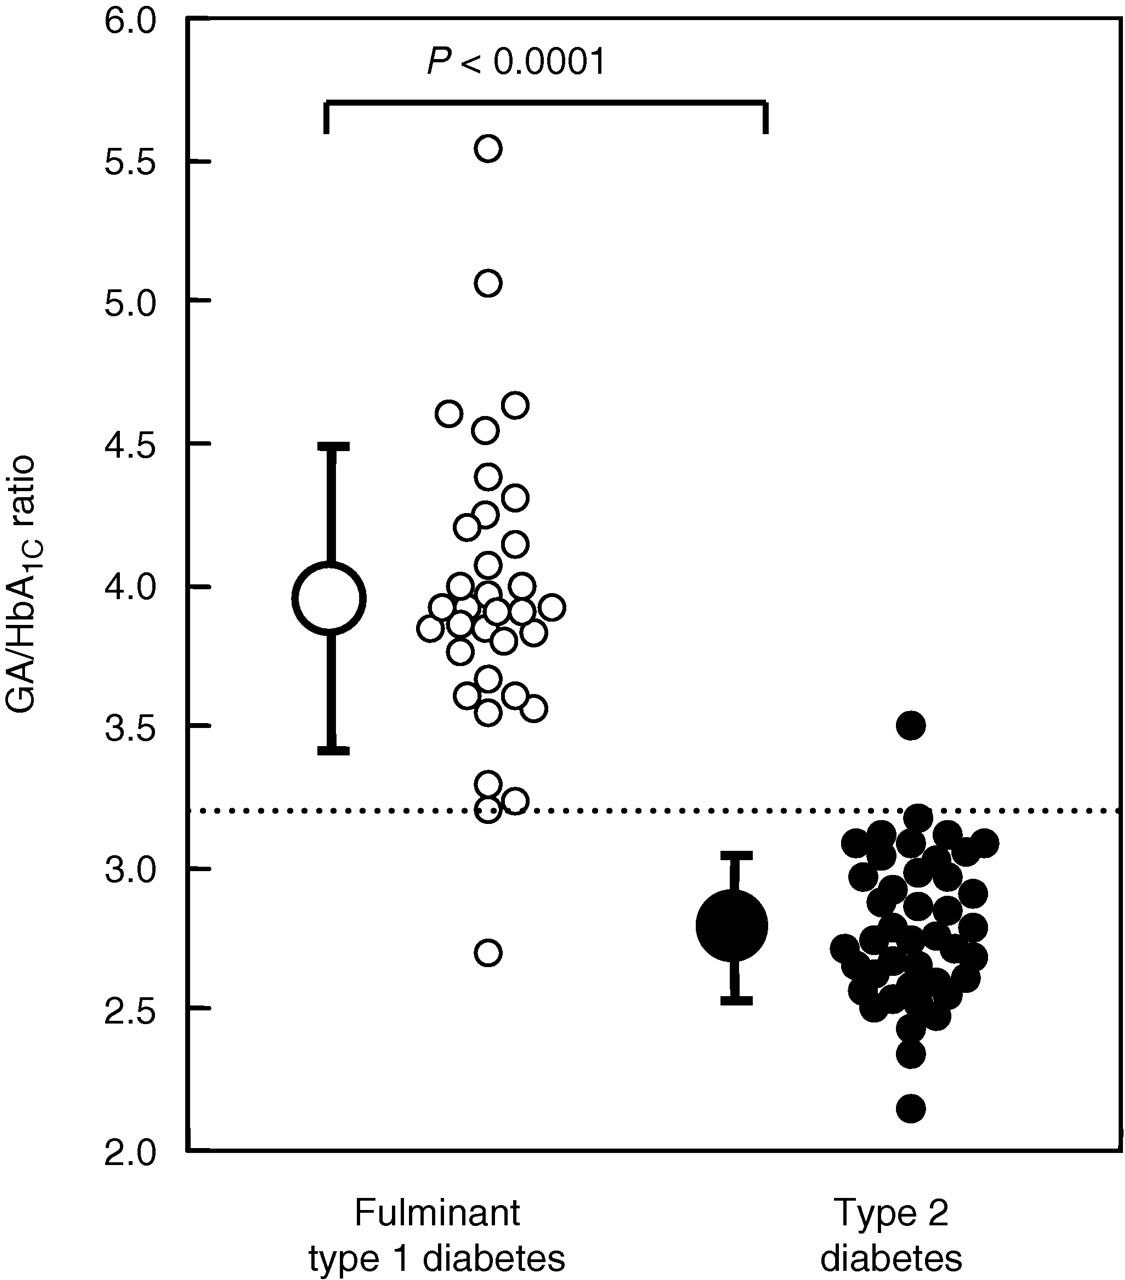
Comparison of glycated albumin (GA)/haemoglobin (Hb)A1C ratio in patients with fulminant type 1 diabetes mellitus (open circles) and type 2 diabetes mellitus (solid circles). GA/HbA1C ratio in each patient and mean (±standard deviation) for each group are shown. The dotted line represents a GA/HbA1C ratio of 3.2
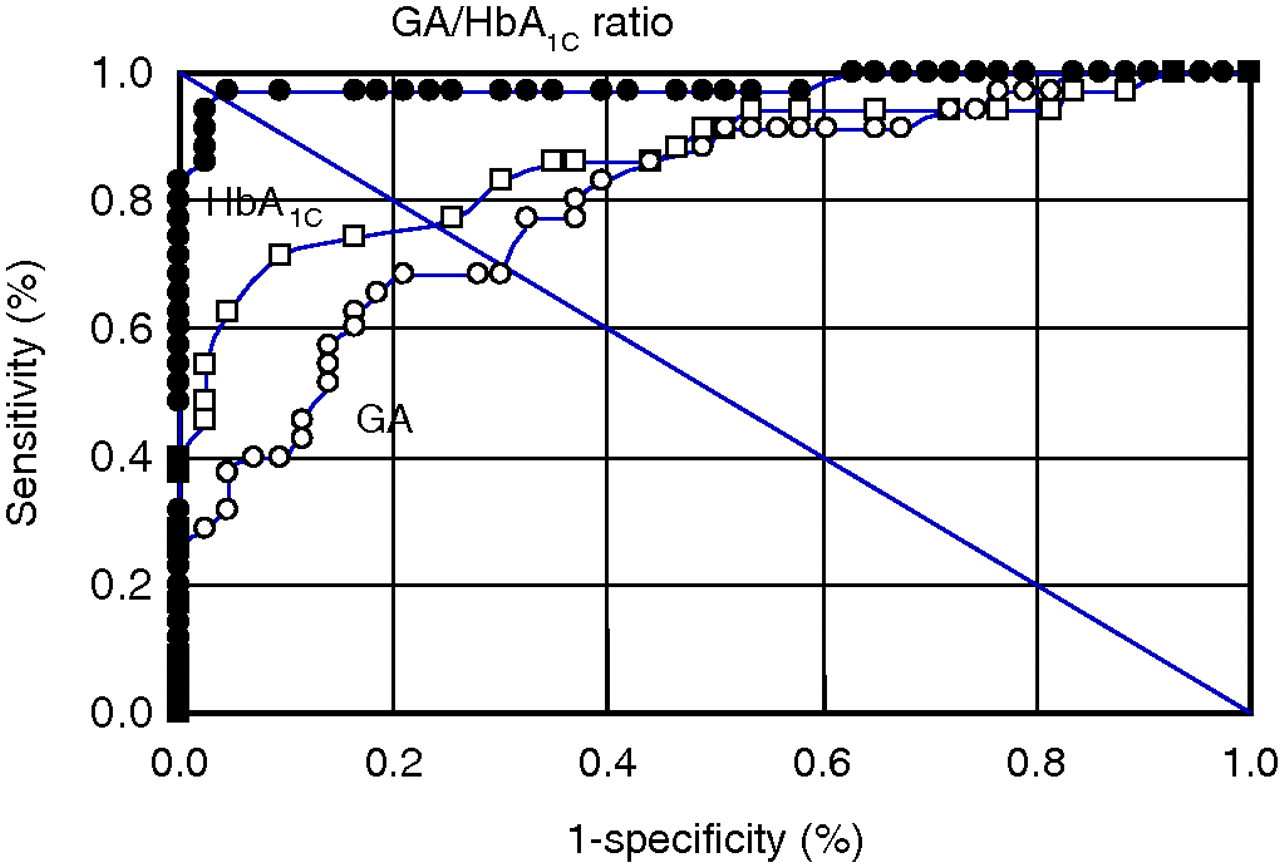
Receiver operating characteristic (ROC) curves for HbA1C (open squares), serum glycated albumin (GA) (open circles) and GA/HbA1C ratio (closed circles) for differentiating fulminant type 1 diabetes mellitus from type 2 diabetes mellitus
Stepwise multivariate analysis using age, sex, BMI and GA/HbA1C ratio as explanatory variables showed that GA/HbA1C ratio (β = −0.773, F = 138.1, P < 0.0001) and age (β = 0.186, F = 8.0, P = 0.0124) were found to be independent explanatory variables for FT1DM. Sex and BMI were not independent risks for FT1DM.
Discussion
In this study, HbA1C was significantly lower in FT1DM patients than in T2DM patients, whereas serum GA was significantly higher. Thus, in contrast to only a slightly elevated HbA1C with an abrupt rise in PG levels, serum GA was already elevated. As a result, GA/HbA1C ratio was significantly higher in FT1DM patients than in T2DM patients at initial visit before treatment for diabetes, suggesting the utility of this ratio in differentiating between FT1DM and T2DM.
GA/HbA1C ratio in T2DM patients has been reported as 2.9 ± 0.4, 8,19 consistent with the present findings. In diabetic patients with poor glycaemic control, after a short-term improvement in PG levels, the magnitude of the decrease in serum GA exceeds that in HbA1C. GA/HbA1C ratio thus decreases. 7,8 Conversely, with an abrupt deterioration in glycaemic control, the magnitude of the increase in serum GA would be expected to be greater than that in HbA1C. In the present study, randomly measured PG levels correlated significantly with serum GA, but not with HbA1C in patients with FT1DM. A higher GA/HbA1C ratio in F1TDM may reflect abrupt deterioration in PG levels. Although we recently reported that BMI negatively regulated serum GA levels in diabetic patients whose HbA1C levels had been stable, 19 there was no relationship between BMI and serum GA in all the study patients. Furthermore, the stepwise multivariate analysis showed that GA/HbA1c ratio, but not BMI, was independent explanatory variable for FT1DM. This finding suggests that a higher GA/HbA1C ratio in F1TDM patients may not be attributable to low BMI.
The diagnosis of FT1DM is clinically important, as initiation of insulin treatment is crucial to avoiding abrupt deterioration and poor prognosis. 2,3 HbA1C levels are normal or only slightly elevated in FT1DM patients, which is critically distinguishable from patients with autoimmune type 1 diabetes mellitus (AT1DM). Most patients with FT1DM display markedly elevated glucose levels, and excluding a diagnosis of T2DM is not difficult in such cases. However, about 10% of FT1DM patients show randomly measured PG levels ≤400 mg/dL. 20 By contrast, randomly measured PG in patients with T2DM sometimes exceeds 288 mg/dL (16 mmol/L), which is a diagnostic level for FT1DM. 3 In these cases, FT1DM is not easily distinguishable from T2DM. Clinical indicators other than PG levels are thus needed for differentiating FT1DM from T2DM.
In the present study, a cut-off value of 3.2 for GA/HbA1C ratio yielded 97% sensitivity and 98% specificity for differentiating FT1DM from T2DM, far superior to the sensitivity and specificity of HbA1C or serum GA. Measurement of serum GA in addition to PG and HbA1C is thus recommended on initial evaluation in patients with suspected FT1DM, as calculation of GA/HbA1C ratio can help to distinguish FT1DM from T2DM. The development of a GA enzyme assay now permits rapid testing using an autoanalyser, although measurements of serum ketone bodies, pH in arterial blood gas and serum or urinary C-peptide immunoreactivity remain essential to distinguish FT1DM from T2DM.
FT1DM cannot be distinguishable from AT1DM by GA/HbA1C ratio, because GA/HbA1C ratio in AT1DM is reported to be higher than that in T2DM 21 and sometimes to be nearly 3.5. 22 Instead, HbA1C is useful for the differential diagnosis of FT1DM and AT1DM, because HbA1C levels are nearly normal or slightly elevated in FT1DM patients and, on the other hand, they are usually extremely high in AT1DM patients.1–3
To the best of our knowledge, this is the first study to demonstrate that FT1DM can be distinguished from untreated T2DM using GA/HbA1C ratio.
DECLARATIONS