
Abstract
Background
Prostate-specific antigen (PSA) is a serine protease that in serum, is predominantly found complexed to the serine protease inhibitor alpha1-antichymotrypsin (ACT). ACT co-localizes with amyloid plaques in Alzheimer's disease (AD) brain and both PSA and ACT are detectable in cerebrospinal fluid (CSF). Therefore, we aimed to determine whether PSA is produced in the brain and whether PSA and PSA–ACT complex levels in CSF can be used as a biomarker for AD.
Methods
Levels of ACT and PSA–ACT were determined by sandwich enzyme-linked immunosorbent assay in CSF and serum samples of AD (n = 16), frontotemporal lobe dementia (FTLD) (n = 19), mild cognitively impaired (MCI) patients (n = 19) and controls (n = 12). Total PSA was determined in a non-competitive immunoassay. Reverse transcriptase–polymerase chain reaction (RT–PCR) for PSA was performed on postmortem hippocampus and temporal cortex specimens from control and AD cases.
Results
PSA is expressed in the brain, as detected by RT–PCR. PSA and PSA–ACT complexes were detectable in CSF of almost all male and only very few female subjects. The levels of PSA and PSA–ACT complexes in CSF did not differ between AD, FTLD, MCI and control groups. PSA CSF/serum quotients highly correlated with albumin CSF/serum quotients. Furthermore, the hydrodynamic radius of PSA was found to be 3 nm and the theoretical PSA quotient, derived from the Felgenhauer plot, corresponded well with the measured PSA quotient.
Conclusions
PSA is locally produced in the human brain; however, brain PSA hardly contributes to the CSF levels of PSA. PSA and PSA–ACT levels in CSF are not suitable as a biomarker for AD.
Introduction
Amyloid plaques in the brain, which mainly consist of amyloid-β (Aβ) protein, are one of the pathological hallmarks of Alzheimer's disease (AD). Various inflammation-related factors, including alpha1-antichymotrypsin (ACT) 1 can be found associated with cerebral Aβ deposits. ACT belongs to the superfamily of serine protease inhibitors (serpins) that form stable complexes with their target proteases, thereby inactivating the protease and protecting the tissue from self-destruction. Although ACT is predominantly produced in the liver, it is also synthesized in the brain, mainly by astrocytes. 2
Studies in transgenic mouse models of AD revealed that ACT accelerates and enhances amyloid plaque formation, 3,4 which suggests a role for ACT in AD pathophysiology. Elevated levels of ACT are found in the brain, serum and cerebrospinal fluid (CSF) 5–9 of AD patients and high ACT in plasma is associated with cognitive decline in elderly subjects. 10 Serpins can exist in several forms: native, which is the functionally active inhibitor, or inactivated forms, such as complexed to and cleaved by a protease. Because of its co-localization with different types of Aβ deposits in AD brain and not with other types of amyloid deposition throughout the body, we hypothesize that the serpin ACT is involved in Aβ metabolism in the brain, possibly through regulation of the proteolytic activity of a target protease involved in either formation or break down of Aβ peptide. Up till now the target protease of ACT in the brain has not been identified.
A possible candidate is prostate-specific antigen (PSA/hk3), a 33-kDa serine protease that belongs to the kallikrein family of serine proteases. Although PSA is mainly produced by the glandular epithelium of the prostate, several studies indicate that PSA production is not prostate or sex specific. 11,12 Very recently, Stone et al. 13 showed that PSA is expressed in the human brain and other studies have shown that next to seminal fluid and plasma, PSA can also be detected in CSF of both men and women. 14–16
Approximately 70–90% of the total amount of PSA (tPSA) in serum forms stable 1:1 complexes with ACT. 17 Furthermore, PSA serum levels were found elevated depending on the degree of local inflammation in the prostate in patients without apparent prostate cancer. 18 Since the CSF is in contact with the extracellular space of the brain, measurement of PSA and PSA–ACT complexes in CSF could reflect the local inflammatory process in the brain that is associated with Aβ deposits and neurodegenerative changes in AD. 19
In this study, we set out to determine whether PSA is locally produced in the brain and whether PSA and PSA–ACT complex levels can be detected in CSF. In addition, it was investigated whether levels of PSA and PSA–ACT complexes in CSF can be used as a diagnostic marker for AD.
Materials and methods
Patients
Nineteen patients with mild cognitive impairment (MCI; Mini Mental State Examination Score [MMSE score]: 28 [22–29]; median [min–max]), 16 patients with probable AD (MMSE score: 22 [13–27]), 19 patients with frontotemporal lobe dementia (FTLD; MMSE score: 25 [15–30]) and 12 control subjects (MMSE score: 29 [27–30]) were included in this study. All patients underwent a standardized clinical investigation including medical history, physical and neurological examination, screening laboratory tests and magnetic resonance imaging. The clinical diagnoses were made in conference by a multidisciplinary team based on accepted clinical diagnostic criteria as described before. 20
The patients with normal clinical and laboratory investigation outcomes were considered to have subjective memory complaints and were included in this study as controls. The local ethical review board approved the study protocol and all subjects gave written informed consent.
CSF and serum analyses
CSF samples were obtained by lumbar puncture between the L3 and L4 or L4 and L5 intervertebral space, and 12 mL was collected in polypropylene tubes. A blood sample was obtained at the same time. A small amount of CSF was used for routine analysis, including erythrocyte count, total cell number and total protein determination. Both CSF and serum samples were centrifuged at 1800
The quotient (Q) and the index of a protein were calculated using the following equations: Quotient (Q) of a protein = CSF concentration/serum concentration. Index value of a protein = (CSF concentration protein × serum concentration albumin)/(serum concentration protein × CSF concentration albumin).
The intrathecal fraction (%) of PSA was calculated using the equation previously described by Reiber et al. 21 : (measured concentration PSA in CSF−expected concentration PSA in CSF)/expected concentration PSA in CSF × 100.
Albumin
CSF and serum albumin concentrations were determined by nephelometry in a Beckman Coulter Immage 800 immunochemistry system. The lower detection limit of albumin in serum is 0.22 g/L. The intra-assay variation of internal controls with average values of 22.5 and 49.0 g/L was 4.0% (N = 306) and 4.3% (N = 304), respectively. Serum and CSF samples were tested in the same run and results expressed as mg/L (CSF) or g/L (serum). Subsequently, the CSF/serum concentration ratio of albumin (albumin ratio) was calculated to assess the integrity of the blood–CSF barrier. 22
ACT ELISA
The ACT enzyme-linked immunosorbent assay (ELISA) was performed as described earlier, 23 with minor modifications. Ninety-six-well ELISA plates were coated with an in-house prepared monoclonal anti-ACT antibody (AC3), 24 which detects all structural forms of ACT. Serum and CSF were diluted 1:125,000 and 1:2500, respectively, in assay buffer, consisting of phosphate-buffered saline (PBS) containing 0.1% (w/v) Tween-20 and 0.2% (w/v) casein, final volume 100 μL, and incubated for 1 h at room temperature (RT). ACT was detected with a biotinylated polyclonal antibody against ACT (DakoCytomation, Glostrup, Denmark) diluted in assay buffer and incubated, final volume 100 μL, at RT for 1 h, followed by incubation with horseradish peroxidase-conjugated streptavidin (Amersham Biosciences, Buckinghamshire, UK) for 1 h. Washing in between incubation steps was performed with PBS containing 0.05% Tween-20. For colour development 100 μL 3,5,3′,5′-tetramethylbenzidine (TMB; Sigma, Munich, Germany) in 0.11 mmol/L sodium acetate, pH 5.5, containing 0.003% H2O2 was used as a substrate. The substrate reaction was stopped by adding 100 μL 2 mmol/L H2SO4. Absorption at 450 nm was determined in a Rainbow microtiterplate reader (SLT, Grading, Austria) corrected for background (OD540). The sensitivity of this assay is 0.05 mg/L.
PSA–ACT ELISA
PSA–ACT levels were determined in a sandwich ELISA using a commercially available monoclonal PSA antibody (Medix Biochemica, Kauniainen, Finland), which was coated at 2 μg/mL overnight, final volume 100 μL, onto 96-well ELISA plates (Costar High Binding, Corning Costar Corp., Corning, NY, USA) in a 0.1 mmol/L carbonate buffer (pH 9.6) at RT. After two washes with PBS the residual binding sites were blocked with 2%, v/v, low-fat milk solution in PBS for at least 30 min. Highly pure PSA–ACT standard (Fitzgerald Industries International Inc, Concord, MA, USA) was used to calibrate this assay. Serum and CSF samples were incubated at RT for 1 h in a dilution of 1:25 and 1:2, respectively, in assay buffer containing PBS, 0.1%, w/v, Tween-20 and 0.2%, w/v, gelatin, final volume 100 μL. The ACT complexes were next detected with a polyclonal antibody against ACT (DakoCytomation, Glostrup, Denmark). This detection step as well as the colour development was performed as described for the ACT ELISA, except that in this ELISA poly-horseradish peroxidase-conjugated streptavidin (Sanquin, Amsterdam, The Netherlands) was used. The sensitivity of this assay is 1 ng/L.
Intra-assay reproducibility of the PSA–ACT assay was found to be 6.6% (n = 41). Inter-assay coefficient of variance was analysed by measuring PSA–ACT complex levels in a pool of serum and CSF on different occasions. The inter-assay variations (n = 3) of the serum and CSF pools in the PSA–ACT assay were 10.2% and 3.9%, respectively.
Total PSA in serum and CSF
Total PSA (free and complexed) in serum and CSF was determined with a non-competitive sandwich immuno-assay using the Architect (Abbott, Abbott Park, IL, USA) automated system. The PSA international standard (WHO coded 96/670) for tPSA was used to calibrate this assay.
The intra-assay and inter-assay coefficients of variance of the assay were analysed by testing several replicates of samples that each contained a low, median and high level of total PSA. The intra-assay variations (n = 20) were 5% at 0.1 μg/L and 4% at 0.5, 4 and 40 μg/L and the inter-assay variations (n = 550) at 0.1, 4 and 20 μg/L were 6%, 6%, 5%, respectively. The limit of detection of this assay in our laboratory is 1.4 ng/L.
Tissue and RNA extraction
Snap-frozen temporal and hippocampal tissue obtained at autopsy with a short postmortem delay was provided by The Netherlands Brain Bank. Brain tissue was characterized according to the Braak criteria. 25 Two non-demented controls (Braak stage 1) and two severe AD cases (Braak stage 6), each consisting of one female and one male subject, were selected for PSA analysis by reverse transcriptase–polymerase chain reaction (RT–PCR). Prostate tissue was used as a positive control in this assay.
RNA was extracted from approximately ten 10 μm cryostat sections of either prostatic or brain tissue using RNeasy lipid tissue mini kit in combination with a DNase treatment (both from Qiagen, Gaithersburg, MD, USA) following the supplier's instructions.
Reverse transcriptase–polymerase chain reaction
The forward primer was designed as 5′ GCTTACCACCTGCACCCGGAGAGCT 3′, and the reverse primer as 5′ AGCACCTGCCAGGGTTGGGAATG 3′, corresponding to nucleotides 9–33 and 141–163 of PSA (Genbank accession# NM_001648) and was synthesized by Eurogentec (Seraing, Belgium). These primers are intron spanning and designed to yield a product of 156 bp.
Five hundred nanogram of RNA was mixed with 50 pmol of PSA primers in MicroAmp tubes and heated for 1 min at 95°C followed by immediate cooling on ice. Subsequently, the RT–PCR master mix was added giving final concentrations of 1× reaction buffer (Invitrogen, Paisley, UK), 1.3 μmmol/L magnestium sulphate, 1 mmol/L betaine and 1 μL of Superscript II RT/Platinum Taq mix (Invitrogen, Paisley, UK). Reverse transcription was performed (with only reverse primer added to enhance sensitivity) for 30 min at 50°C and followed by the denaturation step (2 min at 95°C) in which the forward primer was added. Thereafter, the PCR was run for 40 cycles, each consisting of denaturation (95°C for 1 min), annealing (61°C for 1 min) and extension at 72°C for 2 min. The RT–PCR products were analysed by gel electrophoresis on a 2% agarose gel stained with ethidium bromide. The marker run on each gel consisted of a 100-bp DNA ladder (Biolabs, Ipswich, MA, USA). RT-negative controls consisted of replacement of RT enzyme mix with Taq DNA polymerase (2.0 U/reaction).
Fluctuation correlation spectroscopy
In order to determine the hydrodynamic radius of PSA, fluctuation correlation spectroscopy (FCS) technology was used. The FCS experiments were performed using a dual-channel fluorescence correlation spectrometer ALBA (ISS, Champaign, IL, USA) integrated with an inverted fluorescence microscope (Nikon InsTech Co, Ltd, Kanagawa, Japan), and the FCS data were analysed with Vista (version 3.36) FCS software (ISS, Champaign, IL, USA) and Global Unlimited software (Globals Dynamics, Urbana, IL, USA) as described before. 26
Statistical analysis
For statistical analysis, SPSS version 15.0 (SPSS, Chicago, IL, USA) was used. Levels of CSF and serum markers were compared between the four groups using the non-parametric Kruskall–Wallis test and depicted as median values. Spearman's rank correlation coefficient was used for calculation of correlations. Regression analyses were performed using Passing and Bablock's regression method, calculated by medcalc V 4.30 Software (Medcalc Software, Mariakerke, Belgium). A P value of <0.05 was considered to reflect statistical significance.
Results
PSA expression in the human brain
To investigate whether PSA is produced in the human brain, RT–PCR for PSA was performed. When applied to agarose gel electrophoresis, we observed the expected 156 bp PCR in mRNA samples from prostatic tissue as well as temporal cortex and hippocampus of AD (n = 2; 1 male and 1 female) and control cases (n = 2; 1 male and 1 female) (Figure 1). Next to the 156 bp PCR product, possible alternative transcripts of PSA were also detected in the brain. Negative controls yielded no bands.
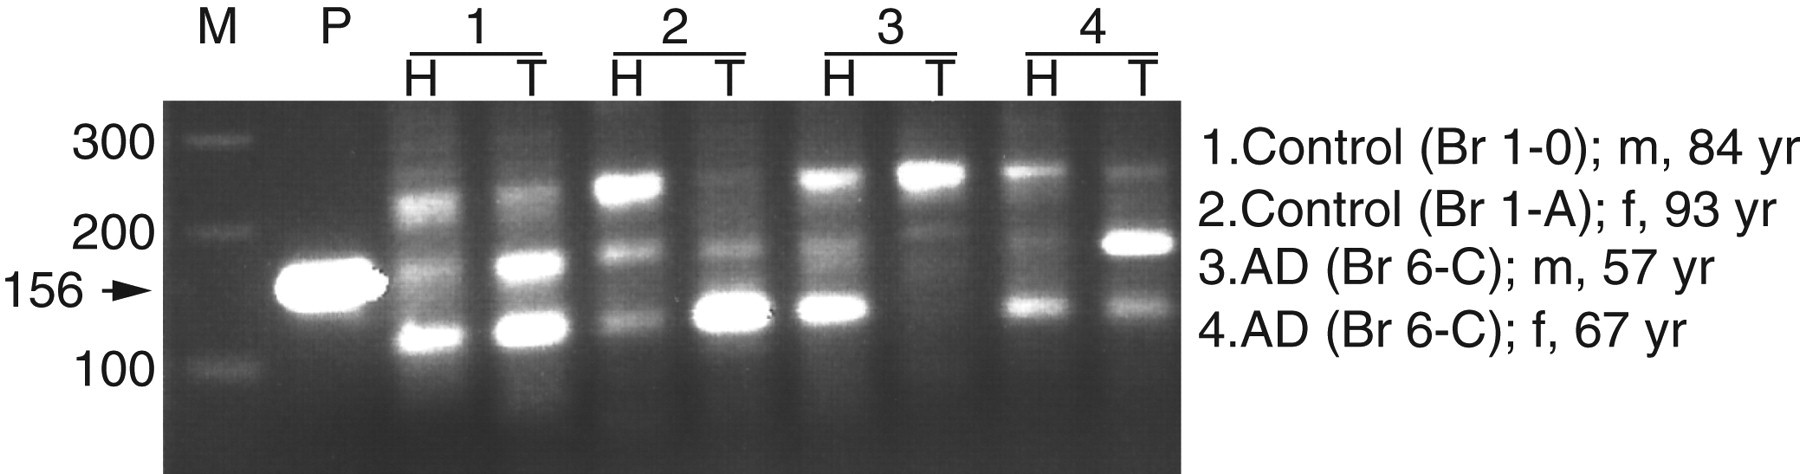
Two percent agarose gel showing prostate-specific antigen reverse transcriptase–polymerase chain reaction products from both hippocampal and temporal cortex tissue. M represents the 100 bp marker. P is the positive control that consists of protatic tissue, the other lanes consist of hippocampal (H) and temporal cortex tissue (T) from four different patients, both male and female subjects were included
ACT, PSA and PSA–ACT complexes in CSF
ACT was detectable in all CSF samples, whereas tPSA was detectable in CSF of all male subjects (33/33), but only in a minority of female subjects (4/32). Moreover, 31 out of 33 male subjects and 2 out of 32 female subjects had detectable PSA–ACT complex levels in their CSF. A highly significant correlation was observed between the concentrations of tPSA and PSA–ACT in CSF (r = 0.90, P ≤ 0.0005). Passing and Bablock regression analysis indicates that virtually all PSA in the CSF is complexed to ACT (Figure 2).
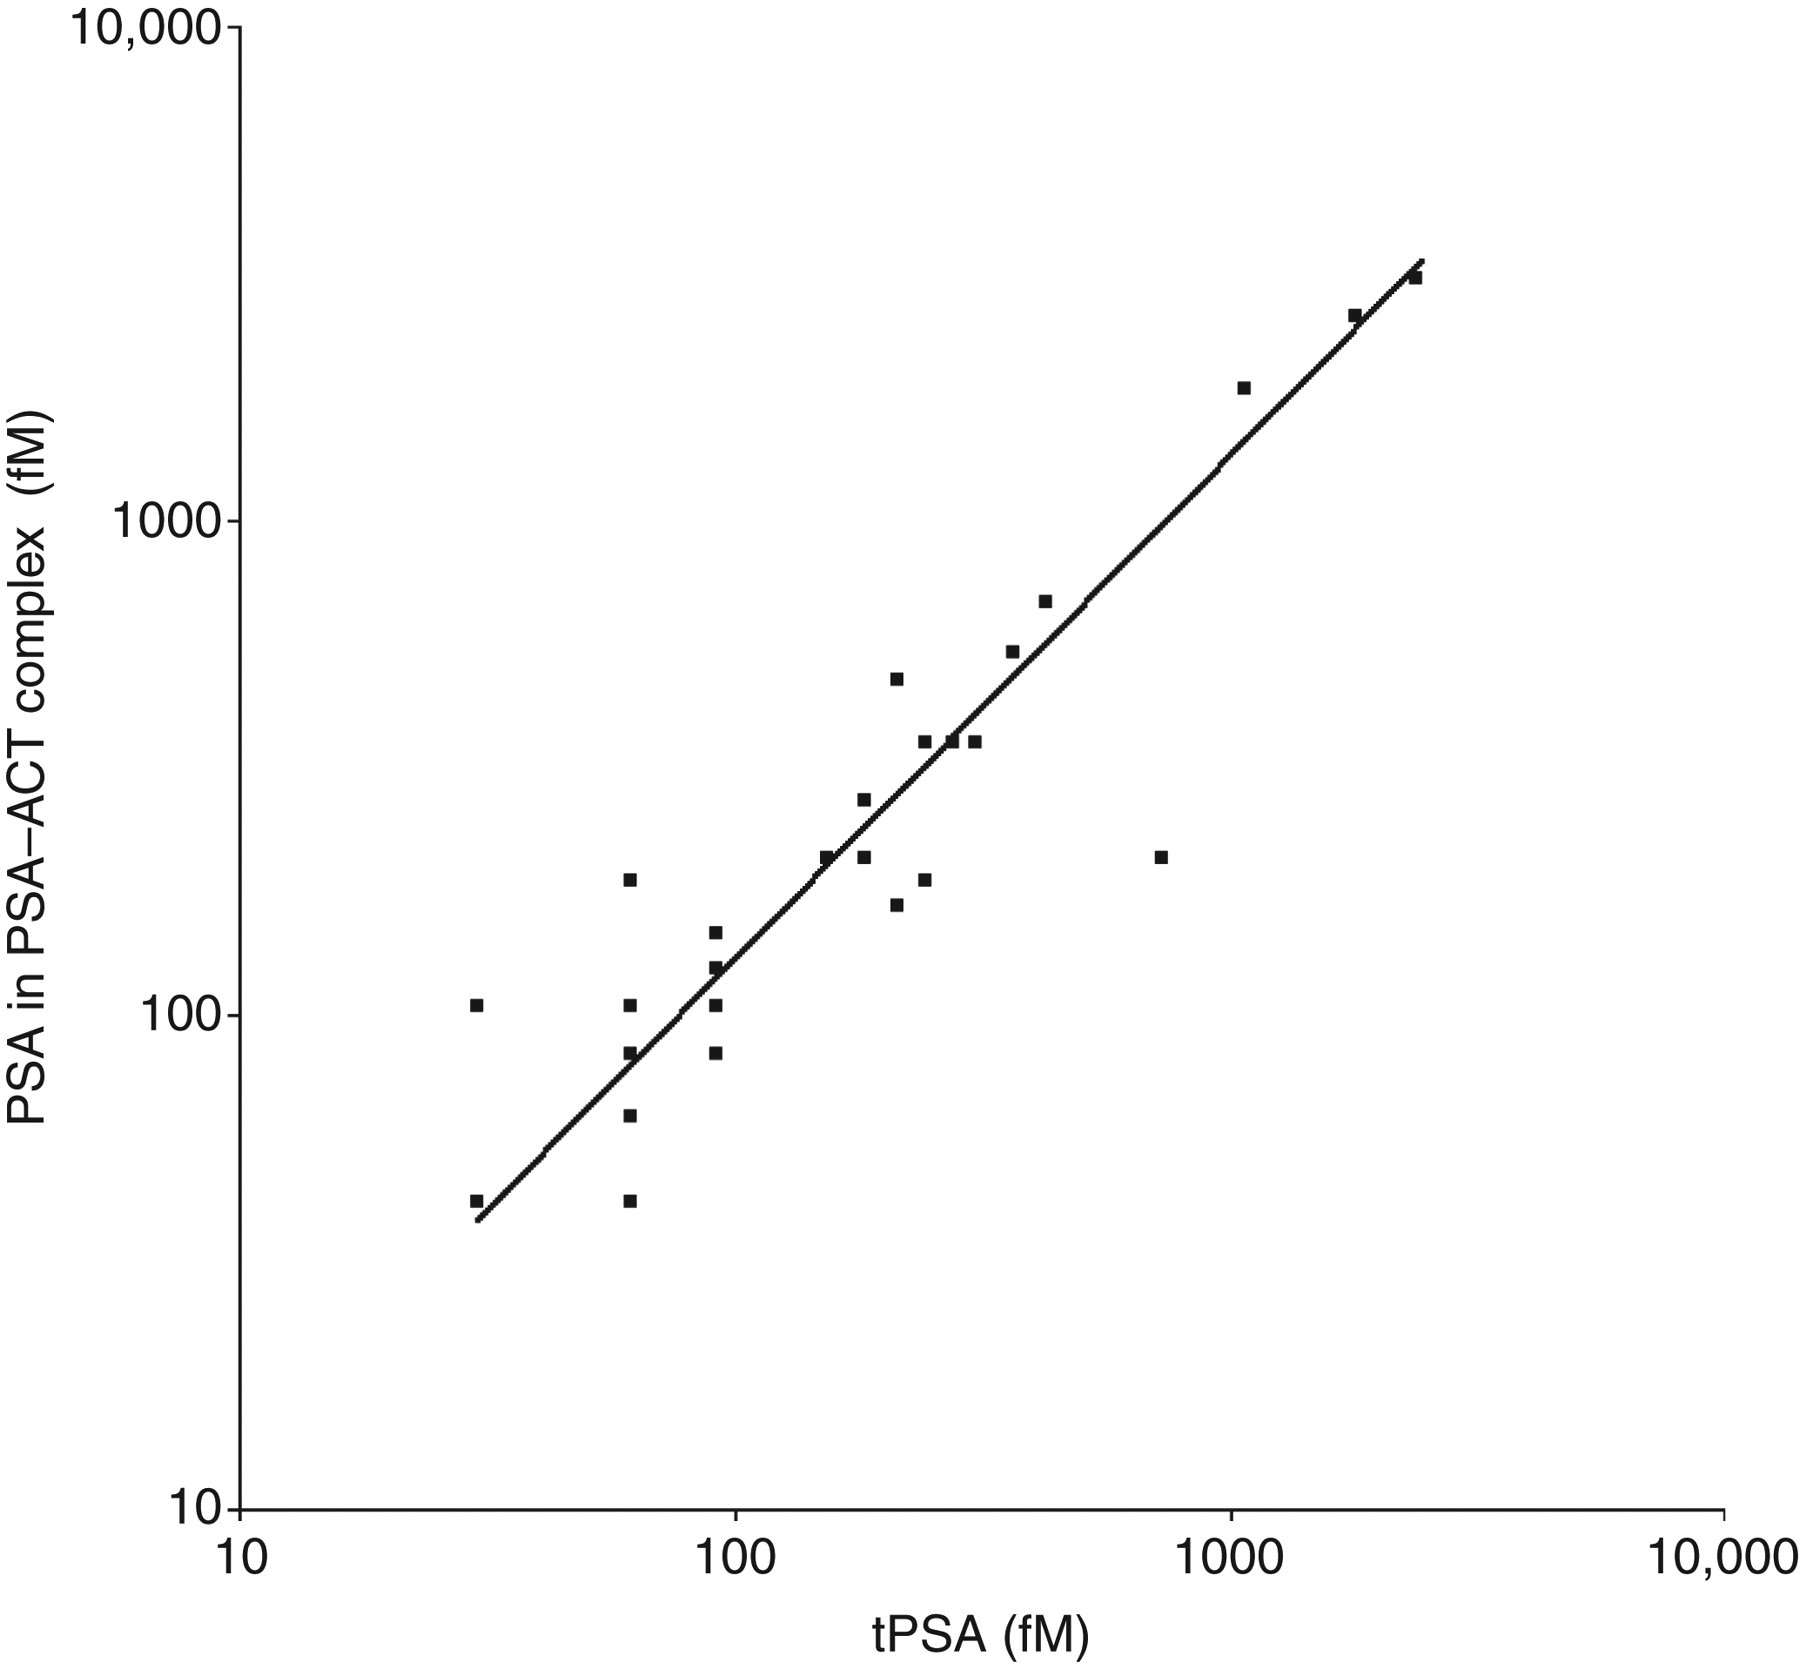
Prostate-specific antigen (PSA) in PSA–alpha1-antichymotrypsin complexes versus total PSA (tPSA) in cerebrospinal fluid (CSF) of male subjects. y = −7.0 + 1.46x
ACT, PSA and PSA–ACT levels as a biomarker for AD
Detectable levels of PSA and PSA–ACT complexes in CSF as well as serum were mainly found in men. Therefore, to determine whether PSA and PSA–ACT complex levels relate to disease stage, only levels in male cases were compared. Male subjects did not show significant differences in PSA–ACT complex (P = 0.72), CSF PSA (P = 0.31) and serum PSA levels (P = 0.44), between the four patient groups (Table 1). In contrast to PSA and PSA–ACT levels, levels of ACT were detectable in CSF of all female and male subjects; however, no significant difference between the patient groups was detected (P = 0.14).
Laboratory characteristics of male subjects
PSA, prostate-specific antigen; CSF, cerebrospinal fluid; ACT, antichymotrypsin; MCI, mild cognitively impaired; FTLD, frontotemporal lobe dementia; AD, Alzheimer's disease
Median (min–max); ND = not determined
*N = 8 one subject below detection
Origin of PSA in CSF
A highly significant correlation between serum and CSF PSA (r = 0.75, P < 0.0005) was observed and regression analysis by Passing and Bablock showed a zero intercept (95% confidence interval: −2.06 to +0.36). This could indicate that the PSA found in CSF is mainly derived from the blood and not from the brain. To test this, individual values of the CSF/serum albumin quotient (Q-albumin) versus the CSF/serum PSA quotient (Q-PSA) were plotted and presented in Figure 3. As shown, there is a significant correlation between Q-PSA and Q-albumin (r = 0.46; P < 0.05), suggesting there is no intrathecal PSA production (Figure 3). However, one patient with a normal Q-albumin had a very high Q-PSA (circled), which is indicative of local production of PSA in the brain.
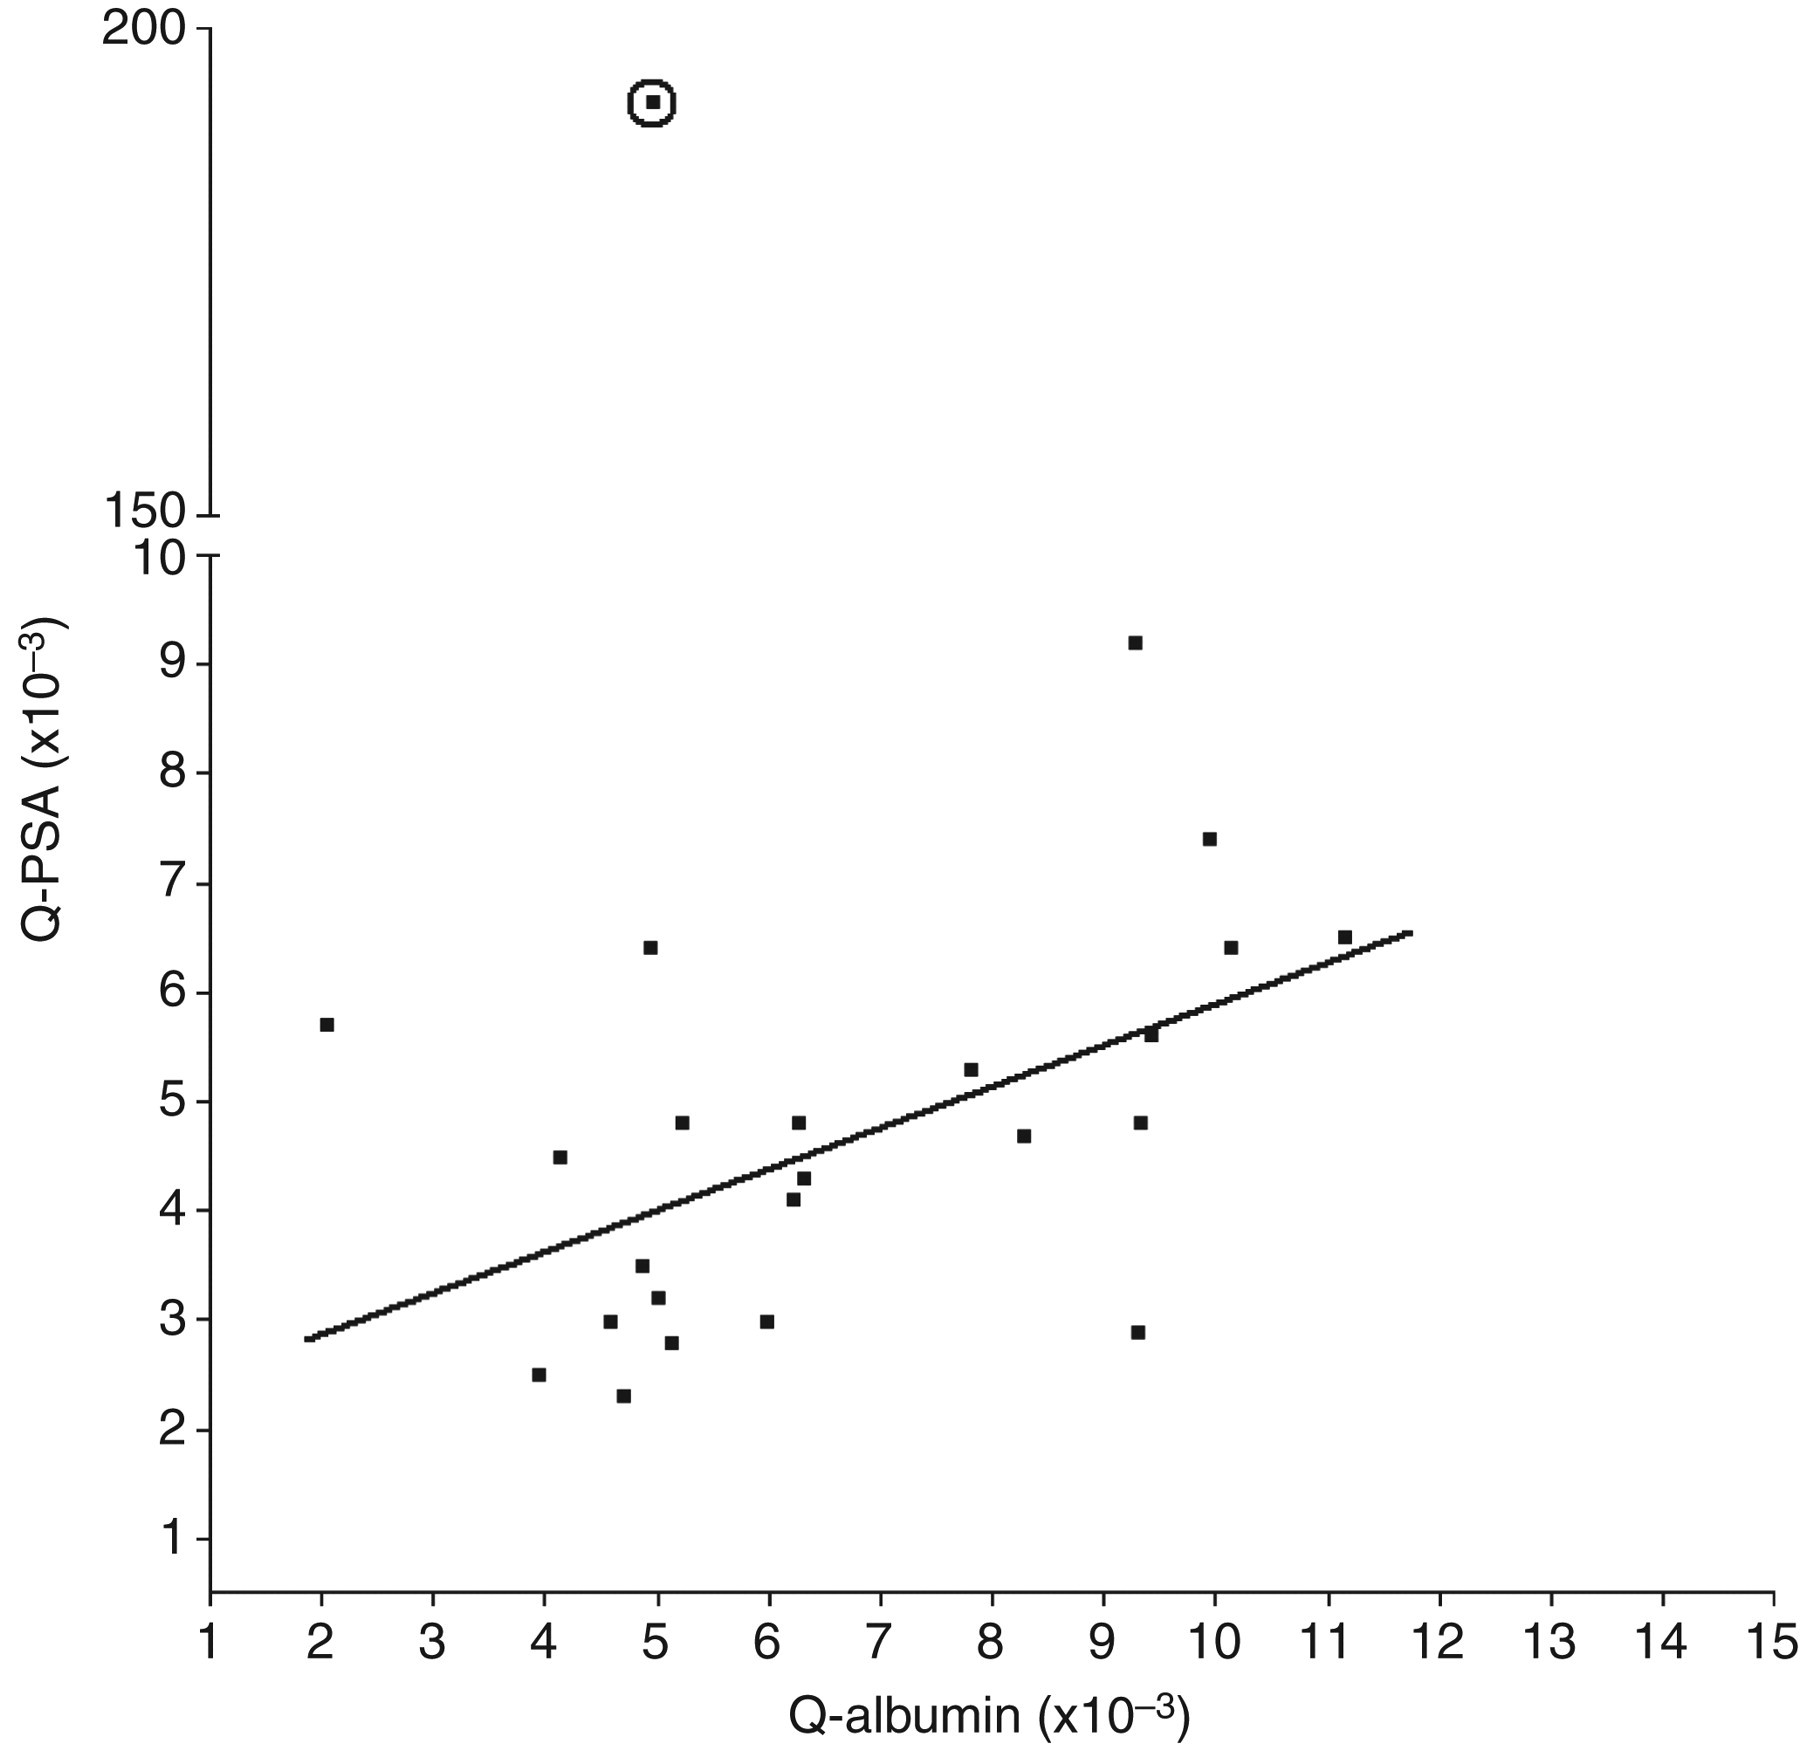
Q-prostate-specific antigen (PSA) versus Q-albumin shows a correlation of 0.55 (P = 0.006). This correlation indicates that PSA in cerebrospinal fluid possibly derives from blood. One case with a very high Q-PSA, but normal Q-albumin (encircled) shows that PSA could be produced in the brain
Another approach is to determine the theoretical Q-PSA by using the Felgenhauer plot.
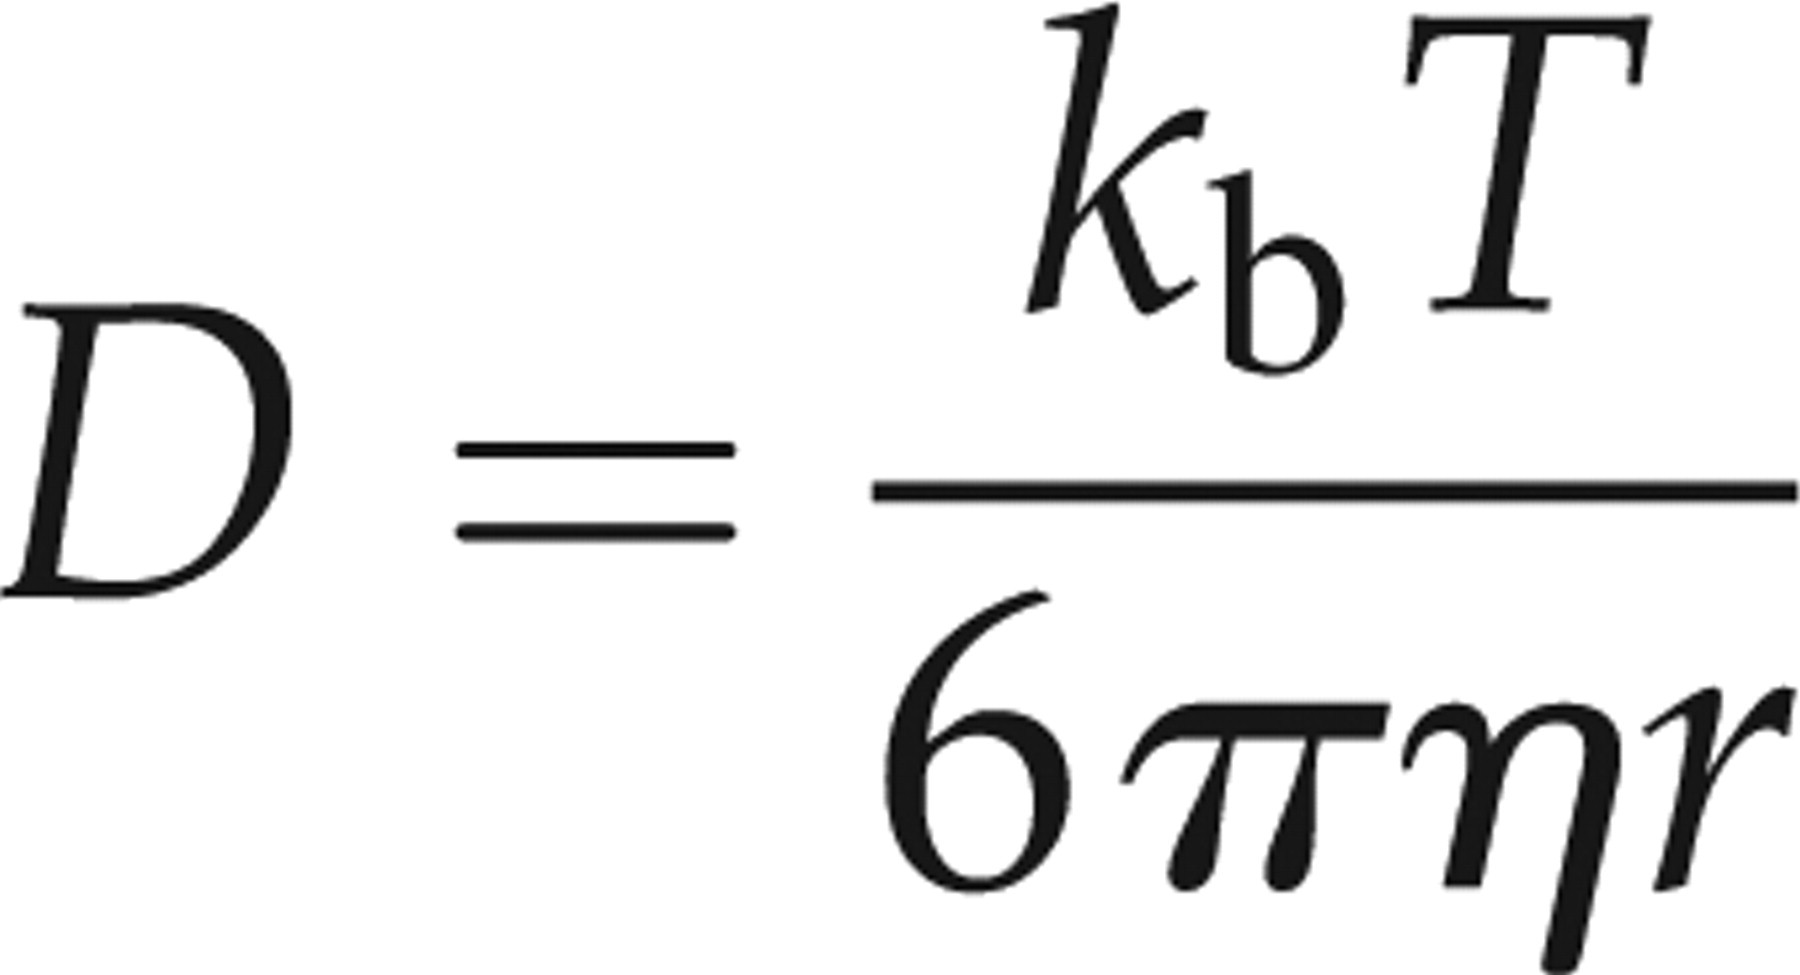
27,28
The Felgenhauer plot shows that the concentration of blood-derived proteins in the CSF is dependent on its hydrodynamic radius, so blood-derived proteins with a large radius will find more resistance while diffusing through the blood CSF barrier (bcb) in contrast to smaller proteins and therefore larger blood-derived proteins have a lower concentration in CSF than smaller-sized blood-derived proteins. To our knowledge the hydrodynamic radius of PSA had not been determined before, therefore, the diffusion coefficient of PSA was determined. Free PSA protein (Scripps; >99% pure) was labelled with a fluorophore (Alexa Fluor488) and the autocorrelation curve of PSA-Alexa488 was measured by FCS. The diffusion coefficient (D) value was calculated from the fit and used to calculate the hydrodynamic radius (r) of the protein using the following equation:
Discussion
There is ongoing debate on whether PSA in CSF originates from the brain or blood. The group of Diamandis found measurable PSA levels in CSF in 7% of patients, both men and women, with various neurological diseases, suggesting that PSA in CSF originates from the brain. 15 Conflicting reports on whether PSA is present in the brain have been published. 12,13,29–31 In the present study, we investigated the presence of PSA mRNA in the temporal cortex and the hippocampus, because these brain areas are heavily affected in AD and contain many ACT positive Aβ plaques. PSA mRNA was detected by RT–PCR in the hippocampus and temporal cortex of all patient brains examined (Figure 1), which is in agreement with the findings of Stone et al. 13 who recently showed that PSA can be synthesized by the human brain. In addition, next to full length PSA also PCR products representing possible splice variants of PSA were detected in the brain specimens (Figure 1). Indeed, in related studies, with primers designed to detect specific splice variants of PSA such variants could be detected in the human brain by us (data not shown), and others. 13 Combined, these RT–PCR studies with the use of different primer sets for PSA strongly suggest that PSA can indeed be locally produced in the brain. Remarkably, we found that PSA is expressed in both female and male brain, which indicates that the expression in the brain is not gender dependent.
With this knowledge, it was very interesting to measure PSA and PSA–ACT complex levels in CSF of control, FTLD, AD and MCI patients to see if these proteins can be used as a biomarker in AD. Although PSA is expressed in the female brain, PSA was detectable in CSF of only four out of 32 (12.5%) female subjects. These results are in line with the findings of Wolff et al., 14 who reported CSF PSA concentrations below detection limit for all women (N = 6) tested. In contrast to this, Melegos et al. 15 showed that 45% of the patients with detectable PSA in CSF were female patients, from which they concluded that PSA in CSF originates from the brain. All these patients had various neurological disorders, including multiple sclerosis (MS), which is known to be associated with a disturbed bcb; 32,33 hence possibly the PSA seen in the CSF of these women is derived from the blood, since PSA can be detected in serum of women. 34,35 On the other hand, the local inflammatory processes occurring in the brain in neurological diseases could cause a rise of PSA in the brain, which is reflected in the CSF. That in our study only a small percentage of women had detectable PSA levels in the CSF could possibly be due to the low-grade, chronic inflammatory processes in AD not being sufficient to evoke substantial synthesis of PSA, in contrast to patients included in the study of Melegos et al. 15 with other more acute inflammatory conditions such as MS and cerebral vasculitis.
Since PSA and PSA–ACT complexes were mainly detectable in male subjects, we performed statistical analysis on this group only. We did not find significant differences in CSF levels of either PSA or PSA–ACT between controls, FTLD, AD and MCI patients, although PSA–ACT levels in MCI patients tended to be higher compared with the other patient groups, which might indicate that these complexes are relevant early in the disease.
Although we did not observe significant differences in ACT levels between the patient groups, a trend towards raised ACT levels in CSF of AD patients compared with controls was seen. Similar findings concerning ACT levels in CSF were reported by other groups; 36,37 however, other studies showed increased ACT levels in CSF of demented patients compared with healthy controls, 7,9 which could indicate that our patient group size is too small to detect significant differences.
Very few women had detectable levels of PSA in CSF, indicating that the contribution of brain PSA in CSF might be very low and that PSA diffuses from the blood to CSF. This is strengthened by the high correlation of PSA in CSF and serum in this study. The Q-albumin is often used as a marker for bcb damage. Since albumin is not produced in the brain, its presence in CSF must be derived from the blood by diffusion. The relation between concentrations of albumin in CSF and serum (Q-albumin) is generally accepted and described in many articles as a method to examine the blood–CSF barrier function. 22,38 In addition, PSA has a molecular weight of 33 kDa, which makes the Q-albumin a better calculation of blood–CSF barrier integrity because of its smaller size (67 kDa) compared with the much larger IgG protein (150 kDa). Therefore, plotting the Q-PSA versus the Q-albumin will give an indication if any of the patients show local synthesis of PSA. Figure 3 shows that one patient expresses PSA in the brain because of a very high Q-PSA and a normal Q-albumin.
Another approach to study the possible contribution of brain PSA to CSF is based on the Felgenhauer theory, which shows that the diffusion of blood-derived proteins to CSF is determined by the hydrodynamic radius of proteins. The Felgenhauer plot uses a double log scale to show the linearity between the quotients of different blood-derived proteins and their hydrodynamic radius. We determined the radius of PSA by FCS as being 30 Å, which, when plotted, corresponds to a Q-PSA of 6 × 10⁻³. The Q-PSA that we determined in our study is slightly lower (median 5 × 10⁻³), which clearly indicates that the contribution of brain PSA to CSF is very low. The lower Q-PSA might be caused by the fact that PSA in blood is also present in a complexed form (±100 kDa), which makes diffusion across the bcb more difficult and thus results in a lower CSF concentration. When calculating the intrathecal fraction, one patient shows signs of PSA synthesis in the brain (>99%). This patient has no bcb dysfunction based on its Q-albumin (circled in Figure 3); however, the cause of this elevation in the CSF is not clear. One explanation could be that, since this patient has been diagnosed with MCI, there is local production of PSA in the brain because of the inflammatory processes associated with AD pathology, 18 although if this is true one would expect this phenomenon in more than one patient. Another possibility might be that the patient suffers from prostate cancer and that he has a metastasis in the spinal cord, which in several studies have shown to lead to high levels of PSA in CSF; 39,40 however, there is no record of this. Taken together these results show that PSA can be produced in the human brain; however, the contribution of this synthesis to the PSA levels in CSF is very low.
Remarkably, PSA levels as measured in PSA–ACT complex ELISA in CSF were approximately 45% higher than tPSA levels determined in the non-competitive sandwich immuno-assay used for routine tPSA measurements. Similar findings have also been reported by other groups. 41,42 A reason for this may be that calibrators from different sources are used in these assays. Therefore, we tested the highly pure PSA–ACT standard (Fitzgerald Industries International, Inc USA; used in the complex ELISA), as well as the PSA international standard (WHO coded 96/670; used for the routine tPSA assay), in the complex ELISA. Comparable results were obtained (not shown). However, after correction for the use of different calibrators, PSA levels determined in the complex assay remained higher. Possibly, other standardization aspects such as the use of different antibodies and incubation and detection times are all parameters that could influence outcome measures, when PSA levels are determined in either the tPSA assay or in the PSA–ACT ELISA. Indeed, the study of Pettersson et al. 41 showed a few women without detectable PSA levels in the CSF who did have PSA–ACT complexes. In addition to PSA (hK3), also human kallikrein 6 (hK6) is able to form complexes with ACT and is prominently present in the brain and CSF. 12 Therefore, cross-reactivity of the HK3 antibody with other kallikreins, including HK6 and possibly also HK7 and HK10 that are present in CSF at much higher concentrations than PSA, can possibly explain the overestimation of PSA–ACT. Taken together, our results suggest that PSA complexed to ACT is the predominant complex form of PSA in CSF. This result is in line with the finding that most of the immunologically detectable PSA in serum is complexed to ACT. 43
In conclusion, we clearly show that PSA is produced in the human brain by both males and females. Furthermore, detectable levels of PSA and PSA–ACT complexes in CSF are only found in men, which indicates PSA in CSF does not reflect PSA levels in the brain. This is confirmed by the findings that the Q-albumin and Q-PSA are highly correlated and that concentration of PSA in CSF relates to its hydrodynamic radius. In addition, we show that PSA and PSA-ACT levels in CSF are not suitable as a biomarker for AD.
DECLARATIONS