
Abstract
Background
The critical difference (CD), the smallest difference between sequential laboratory results which is associated with a true change in the patient, is commonly calculated by assuming the same standard deviation (SD) for the initial and subsequent measurements. The calculation of the CD is re-examined without making this assumption.
Methods
A formula for CD is developed, which specifies that even with the assumption of constant coefficient of variations (CV) at the two measurement concentrations used in the calculation, there will be different SDs due to different concentrations.
Results
The effect of removing the assumption of constant SD is to increase the CD for rises in analyte concentration and to decrease the CD for falls in concentration. These effects are caused by increased SD for the second measurement compared with the first when the second measurement is higher, and the reverse when the second is lower.
Conclusions
Replacing the usual assumption of similar total result SD for both measurements included in the CD calculation with a calculation of the SD at both analyte concentrations leads to an increase in the magnitude of the CD for rises in analyte concentration and a decrease for falls in analyte concentration. This change is proposed for all forms of CD calculations.
Background
The critical difference (CD), also known as the reference change value, is a parameter used to assist with interpretation of laboratory results. The CD is defined as the smallest difference between sequential laboratory results in a patient which is likely to indicate a true change in the patient. The CD can be expressed as a percent (CD%) or an absolute value in the measurement units of the analyte (CD u ). These are related by CD u = CD% × A units, where A is the analyte concentration from which the CD will be determined. The CD can be calculated for different probabilities (CD p ) that the difference is not due to random variability in the results although it is commonly set to 95% (CD95). The most commonly quoted formula for calculating the critical difference at the 95% confidence limit is CD95 % = 2.77 × √(CV a 2 + CV i 2 ) where CV a = analytical coefficient of variation and CV i = CV of within-subject biological variation. 1, 2 The coefficient of 2.77 is derived from √2 × 1.96 where 1.96 is the probability factor (Z) for 95% probability of a true change in either directions, multiplied by √2 to account for the fact that the CD includes variation in two measurements. For the purposes of the following discussion, the analytical and within-subject biological variation (including pre-analytical variation) are combined to make a total result variation as follows: CVtot = √(CV a 2 + CV i 2 ).
The usual formula for CD assumes that the SDtot (total result standard deviation) of the first result measurement and the measurement that would be made at the CD95 level are the same. This is a simplification that becomes progressively less true as the CVtot increases, and thus the difference between the initial concentration and the concentration at the critical difference increases.
Methods
The usual formula can be modified to include the fact that although the first result and the result at the CD were assumed to have the same CVtot, they would have different SDtot due to their different values. If the second result was higher than the first, then for the same CVtot, the SDtot would be larger than the SDtot for the first result, and the converse would apply if the second result was smaller. The expanded formula is as follows: CD% p = Z × √[(CVtot)2 + ((1 + CD% p ) × CVtot)2]. In this formula, the CVtot at the level of the CD was calculated by multiplying the CVtot at the first measurement concentration by 1 + CD. Although this formula was derived using a different CV at the second measurement, as this was applied to the concentration at the first measurement it was numerically equivalent to the same CV at different concentrations of the second measurement. This formula can be solved for CD% p after re-expression as a quadratic with two solutions. Solution 1 was the CD% p for an increase in concentration and solution 2 for a decrease in concentration. CD% p (1) = (−b − √(b 2 − 4 × a × c))/2a; CD% p (2) = (−b + √(b 2 − 4 × a × c))/2a where a = CVtot 2 − 1/Z 2; b = 2 × CVtot 2; and c = 2 × CVtot 2. A graphical example of the CD calculation using the usual equation and the revised approach is shown in Figure 1.
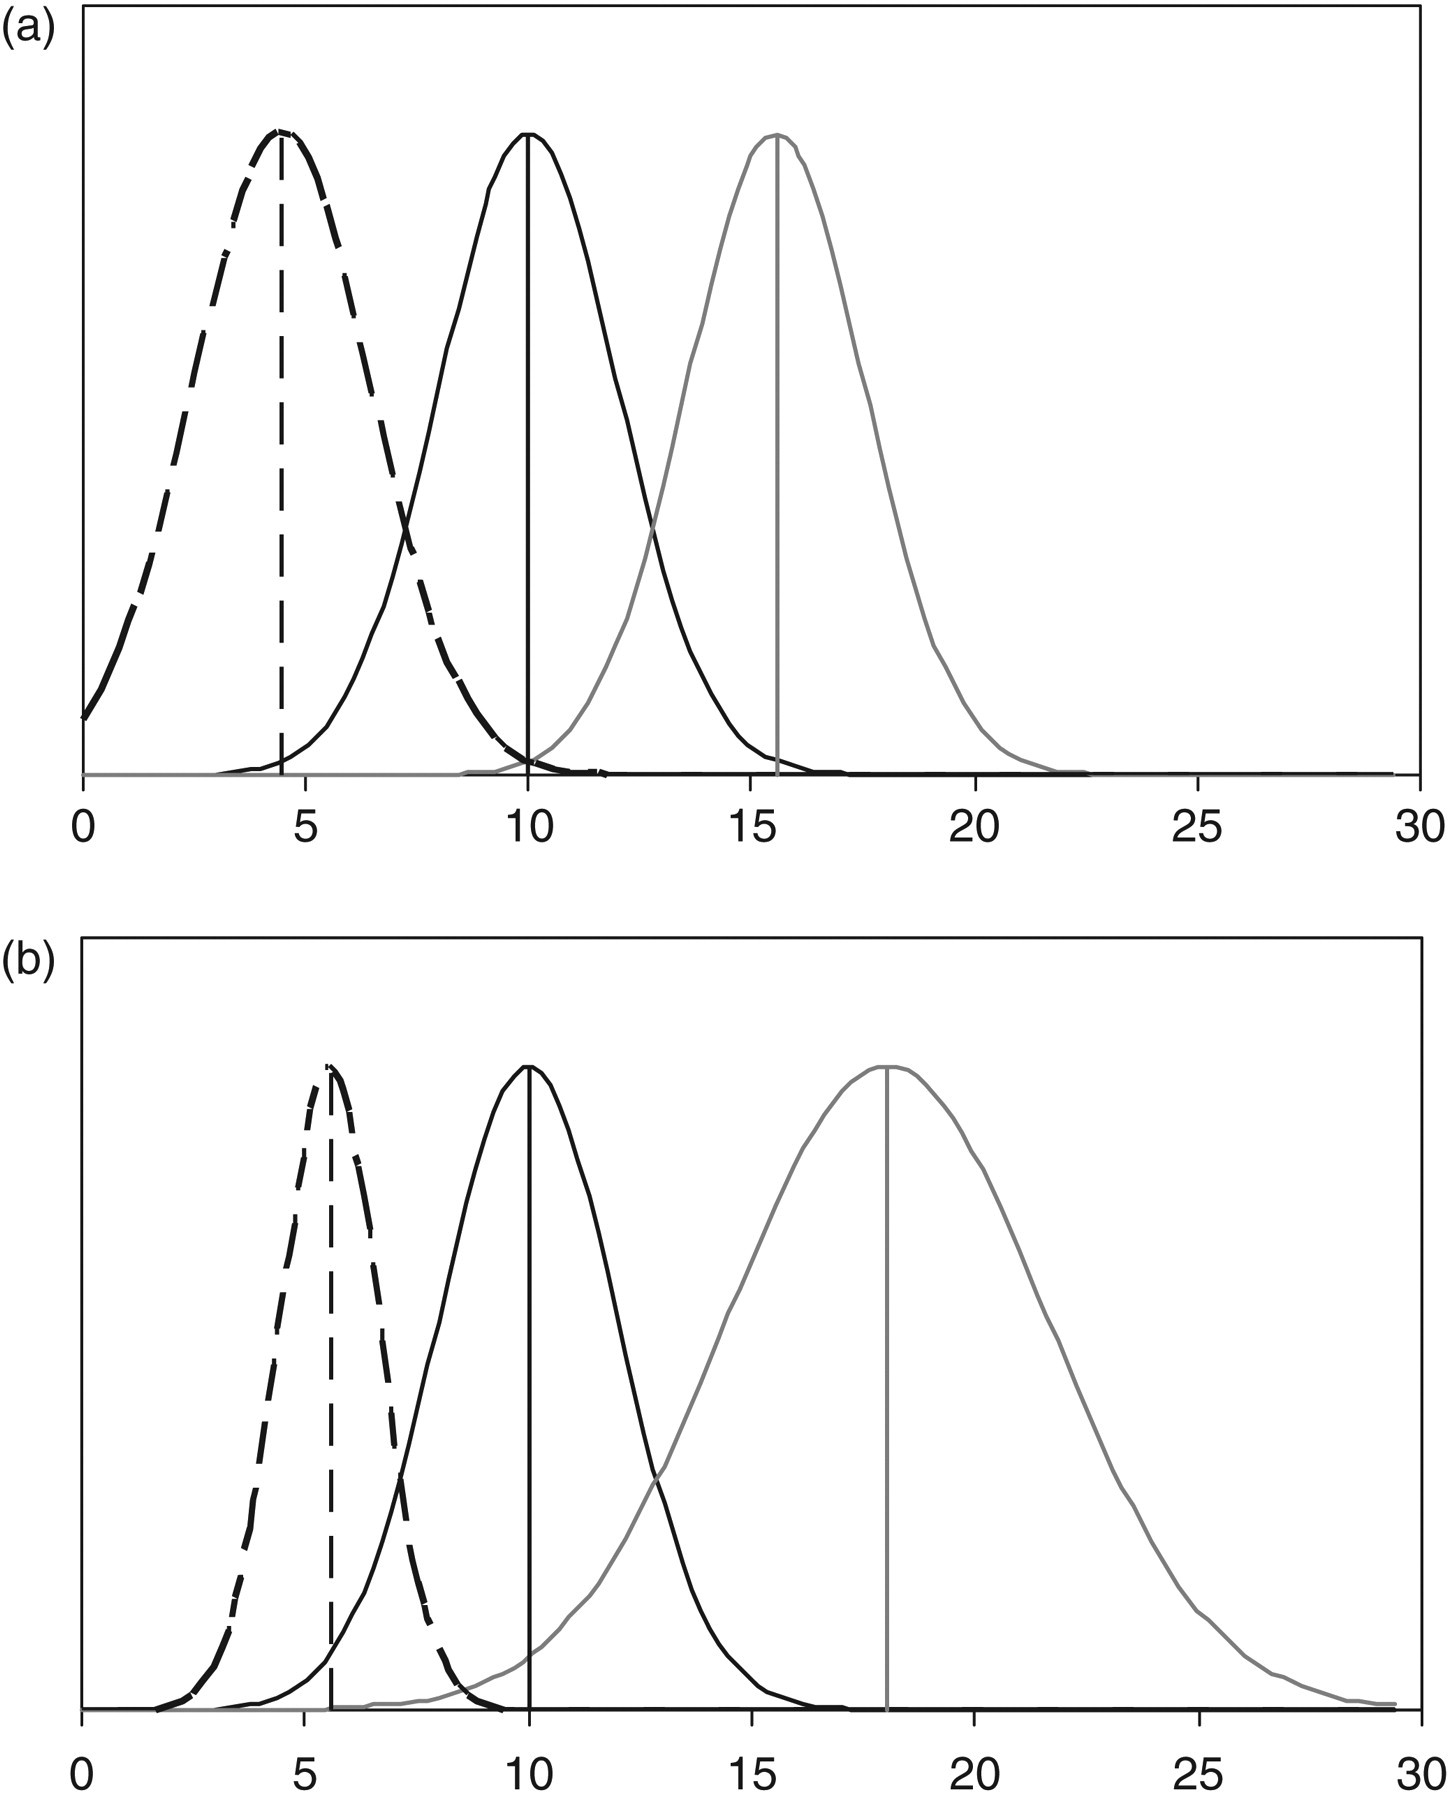
Graphical example of the current (a) and revised (b) calculations of critical difference (CD). A simulation of a test with a CVtot of 20% and a first result of 10 units. According to current CD calculations (a) the first result (vertical solid black line), the first result plus the CD95 (vertical solid grey line) and the first result minus the CD95 (vertical dashed black line) have the same standard deviation (SD) (distributions shown) and the values are equally spaced at ±5.54 units. With the revised CD calculations (b), the SD of each result varies with result concentration with a CD for an increase of 8.04 units and for a decrease of −4.45 units
Results
Using these formulae, the value of the coefficient by which CVtot must be multiplied to determine the CD% for different values of CV and Z can be calculated. These are shown in Table 1 for probabilities of 80, 90, 95 and 99%. In each case with increasing CVtot, there was a marked increase in the coefficient for increases in analyte concentration and a more gradual reduction with increasing values of CVtot for falls in analyte concentration. For example, for increases in analyte concentration at the 95% probability level, at a CVtot of 1% the CD95 is 2.8 × CVtot, at 10% is 3.3 × CVtot, at 20% is 4.1 × CVtot and at 30% is 5.6 × CVtot. For falls in analyte concentration the formula at a CVtot of 10% is 2.4 × CVtot, at 20% is 2.2 × CVtot and at 30% is 2.1 × CVtot. The ‘standard’ coefficient of 2.77 for 95% probability was approached as the CVtot became very small. Note also that for high values of CVtot, the calculation failed to produce a reasonable answer. For example at the 99% probability level, with CVtot greater than 40%, and for CVtot > 50% at the 95% probability level, the calculation for an increase in concentration produced a negative number. This occured when it was not possible to reach this level of significance due to the very wide scatter of the higher value.
Coefficients for critical difference (CD) calculations
CV, coefficient of variation
The table shows the coefficient by which the CVtot must be multiplied to determine the CD% for decreasing and increasing changes in the analyte concentration for different probabilities of a true change in the patient
*Unable to calculate CD for these values of probability and CVtot (see the text)
Conclusions
It can be seen that taking the variation in SD with analyte concentration into account has a number of consequences. Firstly, there are observed changes in the calculated CD from currently accepted values as shown in the table. Additionally, there is addition of an asymmetry to the CD values. Unless the CVtot is small, a following result must increase further to reach statistical significance than it must fall to reach the same significance. Another consequence is that the ‘bedside’ calculation becomes a little more complex. For example, with an analyte with a CVtot of 10%, the previous calculation for a difference with a 95% chance of being real would be a rise or fall of approximately 28%. Using the current theory, the difference would be a rise of 33% or a fall of 25%. For an analyte with a CVtot of 30%, a CD95 of ±84% becomes +170% or −63%. These values are calculated from Table 1 by multiplying the value for CVtot by the relevant coefficient. The approach described here is also relevant to skewed data which are log-transformed for CD calculations with the CD converted back to untransformed data for application. 3 In this case, the revised calculation should be applied to the transformed data prior to back-conversion.
The theory of CD is based on providing a theoretical understanding of the factors that contribute to result variability so that medical decisions can be improved. At this time it may be considered a theory in development with many areas in need of further research and understanding. Such areas may include variation in analytical CV at different analyte concentrations, 2 consideration of sensitivity as well as specificity in CD calculations, 4 variation in CVi in different states of health, 5 at different ages or over different time periods and defining the required level of significance for clinical decisions. 1 The effect of the reporting interval size (RIS) on CD calculations has already been described and a factor of approximately 1.5 × RIS should be added to CD u to allow for this effect. 6
In conclusion, the usual method for calculating the CD includes an assumption of similar total result SD for both measurements used in the calculation. If this assumption is replaced by calculation that includes differences in the total SD for the two measurements, an increasing CD is seen with increasing values of CVtot for rises in analyte concentration and a decrease in the magnitude of the CD is seen for falls in analyte concentration.
DECLARATIONS