
Abstract
Background
Apolipoproteins B (apoB) and AI (apoAI) are strong predictors of cardiovascular disease (CVD). We describe apolipoprotein distributions and their associations with lipids and diabetes subtype in diabetic young adult South Asians.
Methods
In 995 subjects with diabetes, we measured fasting total cholesterol (TC), high-density lipoprotein cholesterol (HDLC), triglycerides (TG), apoB and apoAI, glycosylated haemoglobin (HbA1c) and glutamic acid decarboxylase antibodies (GADA). Low-density lipoprotein cholesterol (LDLC) and non-HDLC (NHDLC) were calculated. We compared values in subjects aged 15–50 y from the United States National Health and Nutrition Examination Survey (NHANES).
Results
Median age and duration of diabetes were 38 (range 14–45) and 4 (0–24) y. Men had significantly higher TC, TG, NHDLC, TC/HDLC, apoB/AI and NHDLC/apoB, and lower apoAI than women. Compared with the reference group, patients with type 1 diabetes had lower TG, apoB:apoAI and HDLC:apoAI, and higher HDLC and apoAI. Patients with type 2 diabetes had higher TG, TC, LDLC, NHDLC, TC:HDL, apoB, apoAI and apoB:apoAI, and lower HDLC, LDLC:apoB and HDLC:apoAI. Among patients with type 2 diabetes, 54% had high apoB (>1.2 g/L) and 33% also had high TG (>1.5 mmol/L). Measures of obesity (body mass index and waist circumference) were weakly correlated with lipid and apoprotein parameters, suggesting a modest contribution to dyslipidaemia.
Conclusions
A large proportion of young adult Sri Lankan patients with type 2 diabetes has a low LDLC:apoB and high apoB and/or TG, suggesting that these patients are at increased risk of CVD.
Introduction
The prevalence of type 2 diabetes mellitus is increasing worldwide and people of South Asian origin are particularly susceptible. Cardiovascular disease (CVD) is also increasing in developing countries, and about 80% of CVD worldwide now occurs in these countries. 1 Diabetes mellitus is an independent risk factor for CVD 2 and CVD causes death in some 65% of persons with diabetes worldwide. 3 The atherogenic dyslipidaemia associated with type 2 diabetes is characterized by increased triglycerides (TG) and apolipoprotein B (apoB), reduced high-density lipoprotein cholesterol (HDLC) and apoliprotein AI (apoAI), and a predominance of small dense LDL (sd-LDL). 4 There is a one to one correspondence between apoB and the total number of atherogenic particles, the great majority of which (90% or more) are LDL particles (except in familial dysbetalipoproteinaemia and hepatic lipase deficiency). Each HDL particle contains at least one apoAI molecule. These two apoproteins predict CVD better than traditional risk factors such as total cholesterol (TC), HDL cholesterol (HDLC), LDL cholesterol (LDLC), TG and the ratio of TC:HDLC. 5 Furthermore, TC and LDLC are usually normal in diabetes. Because of the 1:1 relationship between apoB and LDL particles, elevated apoB in the presence of normal LDLC suggest the presence of sd-LDL particles, 6 which are difficult to measure. Here, we describe the pattern and distribution of lipids and apolipoproteins in a sample of young adults with diabetes in Sri Lanka.
Research design and methods
Patients were participants from the Sri Lanka Young Diabetes Study, 7 a cross-sectional study of 1007 subjects with diabetes younger than 45 y old whose diabetes was diagnosed at age 16–40 y. We recruited patients from government and private sector diabetic clinics in Sri Lanka. Ethical approval was obtained, and all participants provided informed consent.
An individual was considered to have diabetes if diagnosed by a physician. We classified individuals into subtypes according to the presence of autoantibodies to pancreatic islet cells (glutamic acid decarboxylase autoantibodies, GADA) and whether they required treatment with insulin within six months of diagnosis. 8 We classified GADA-positive patients requiring insulin treatment within six months from diagnosis as ‘type 1 diabetes’. Those who required insulin within six months, but who were GADA negative, were classified as ‘GADA-negative type 1 diabetes’. We classified patients who were GADA positive, but insulin independent during first six months of diagnosis, as ‘latent autoimmune diabetes of adulthood’ (LADA). All other subjects were considered to have type 2 diabetes.
We obtained information on demography, medical history and medication usage. We collected anthropometric measurements and fasting blood samples. Serum was stored at −20°C. TC, HDLC and TG were measured by enzymatic photometric methods using a Hitachi 704 chemical auto-analyser (Roche Diagnostics, Mannheim, Germany) in the Reproductive and Endocrinology Laboratory, Faculty of Medicine, University of Colombo, Sri Lanka. Serum samples were transported to the United Kingdom on dry ice (at −80°C) and stored at −80°C. ApoB and apoAI were measured by immunoturbidimetric methods traceable to WHO-IFCC reference materials SP3-07 and SP-01 9,10 on ADVIA 2400 Chemistry Systems (Siemens Healthcare Diagnostics, Newbury, UK) in the Clinical Biochemistry Department, John Radcliffe Hospital, Oxford. Inter-assay coefficients of variations (CVs) were <3.7% for apoB and <3.5% for apoAI. LDLC levels were calculated using Friedewald's formula in subjects with TG <4.52 mmol/L. 11 We estimated non-HDLC (NHDLC) by subtracting HDLC from TC. HbA1c was measured by HPLC (Biorad, Hercules, CA, USA) in National Diabetes Centre, Sri Lanka. GADA was measured by a radioimmunoassay using 35S-labelled full-length GAD65 in the Diabetes and Metabolic Unit, University of Bristol. Results above 14 WHO units/ml were considered positive. Complete data were available for 995 patients. We used the R system (R Development Core Team, Vienna) for all statistical analyses.
We examined the correlations among all patients between lipids and apoproteins, and ratios of apoB:apoAI, apoB:LDLC and apoAI:HDLC. We compared the distributions of lipids, apoproteins and HbA1c with examination and laboratory data from the third United States National Health and Nutrition Examination Survey (NHANES III) collected in 1988–1994 (
To estimate the prevalence of dyslipidaemias of diabetes within this population, we excluded subjects taking lipid-lowering drugs (statins) and tabulated the remainder as having high TG (>1.5 mmol/L) and/or apoB (>1.2 g/L). 12
Results
Of 995 patients, 574 were women (median age, 39 y) and 421 were men (median age, 37 y). Women had a slightly longer duration of diabetes (4.1 versus 3.9 y, P < 0.001), lower TC, TG, TC/HDLC, NHDLC and LDLC/apoB, and higher apoAI (Table 1).
Characteristics of the cohort
TC, total cholesterol; TG, triglycerides; HbA1c, glycosylated haemoglobin; BMI, body mass index; WC, waist circumference; NHDLC, non-HDLC; APoA, apolipoprotein B; SD, standard deviation; IQR, interquartile range; HDLC, HDL cholesterol; LDLC, LDL cholesterol
Data are mean (SD) for normally distributed and median (IQR) for non-normally distributed variables
*P < 0.05; **P < 0.01; ***P < 0.001
ApoB and apoB:apoAI were strongly and positively associated with TC, LDLC, NHDLC and TC:HDLC. ApoAI was moderately strongly correlated with HDLC. HbA1c was most strongly associated with TC, NDHLC and LDLC. Body mass index (BMI) and waist circumference were strongly associated with each other (r = 0.87). Both were lowest in those with type 1 diabetes and significantly higher in all other types of diabetes, the highest values being found in type 2 diabetes. Each had weak negative associations with HDLC, apoAI, LDLC, apoB, HDLC:apoA1 and HbA1c, while waist circumference had a negative association with NHDLC. Both had weak positive associations with TG, TC:HDL and apoB:AI, while waist circumference was weakly associated with apoB.
Of 995 patients, 891 had type 2 diabetes, 19 had type 1 diabetes, 33 had LADA and 52 had antibody-negative type 1 diabetes. Of these, 211 subjects were taking statins and were excluded from the comparisons with NHANES and between groups (Table 2, Figures 1 and 2). Compared with NHANES subjects, all patient groups had higher values of HbA1c, and lower BMI and waist circumference (Table 2). Compared with NHANES subjects, patients with type 1 diabetes had lower TG, apoB:apoAI and HDLC:apoAI, and higher HDLC and apoAI. Also compared with NHANES subjects, patients with LADA had lower HDLC and HDLC:apoAI (Figure 2), and higher TC:HDL, apoB (Figure 1) and apoAI. Again compared with NHANES subjects, patients with antibody negative type 1 diabetes and type 2 diabetes had higher TC, LDLC, NHDLC, TC:HDL, apoB (Figure 1), apoAI and apoB:apoAI, with lower HDLC, LDLC:apoB and HDLC:apoAI (Figure 2). In addition, patients with type 2 diabetes had higher TG. Compared with men, women had lower TC, TG, LDLC, NHDLC, TC:HDLC, apoB, apoB:apoAI, LDLC:apoB and HbA1c. Figures 1 and 2 show the distributions of ApoB and LDLC:ApoB, respectively, for the various groups.
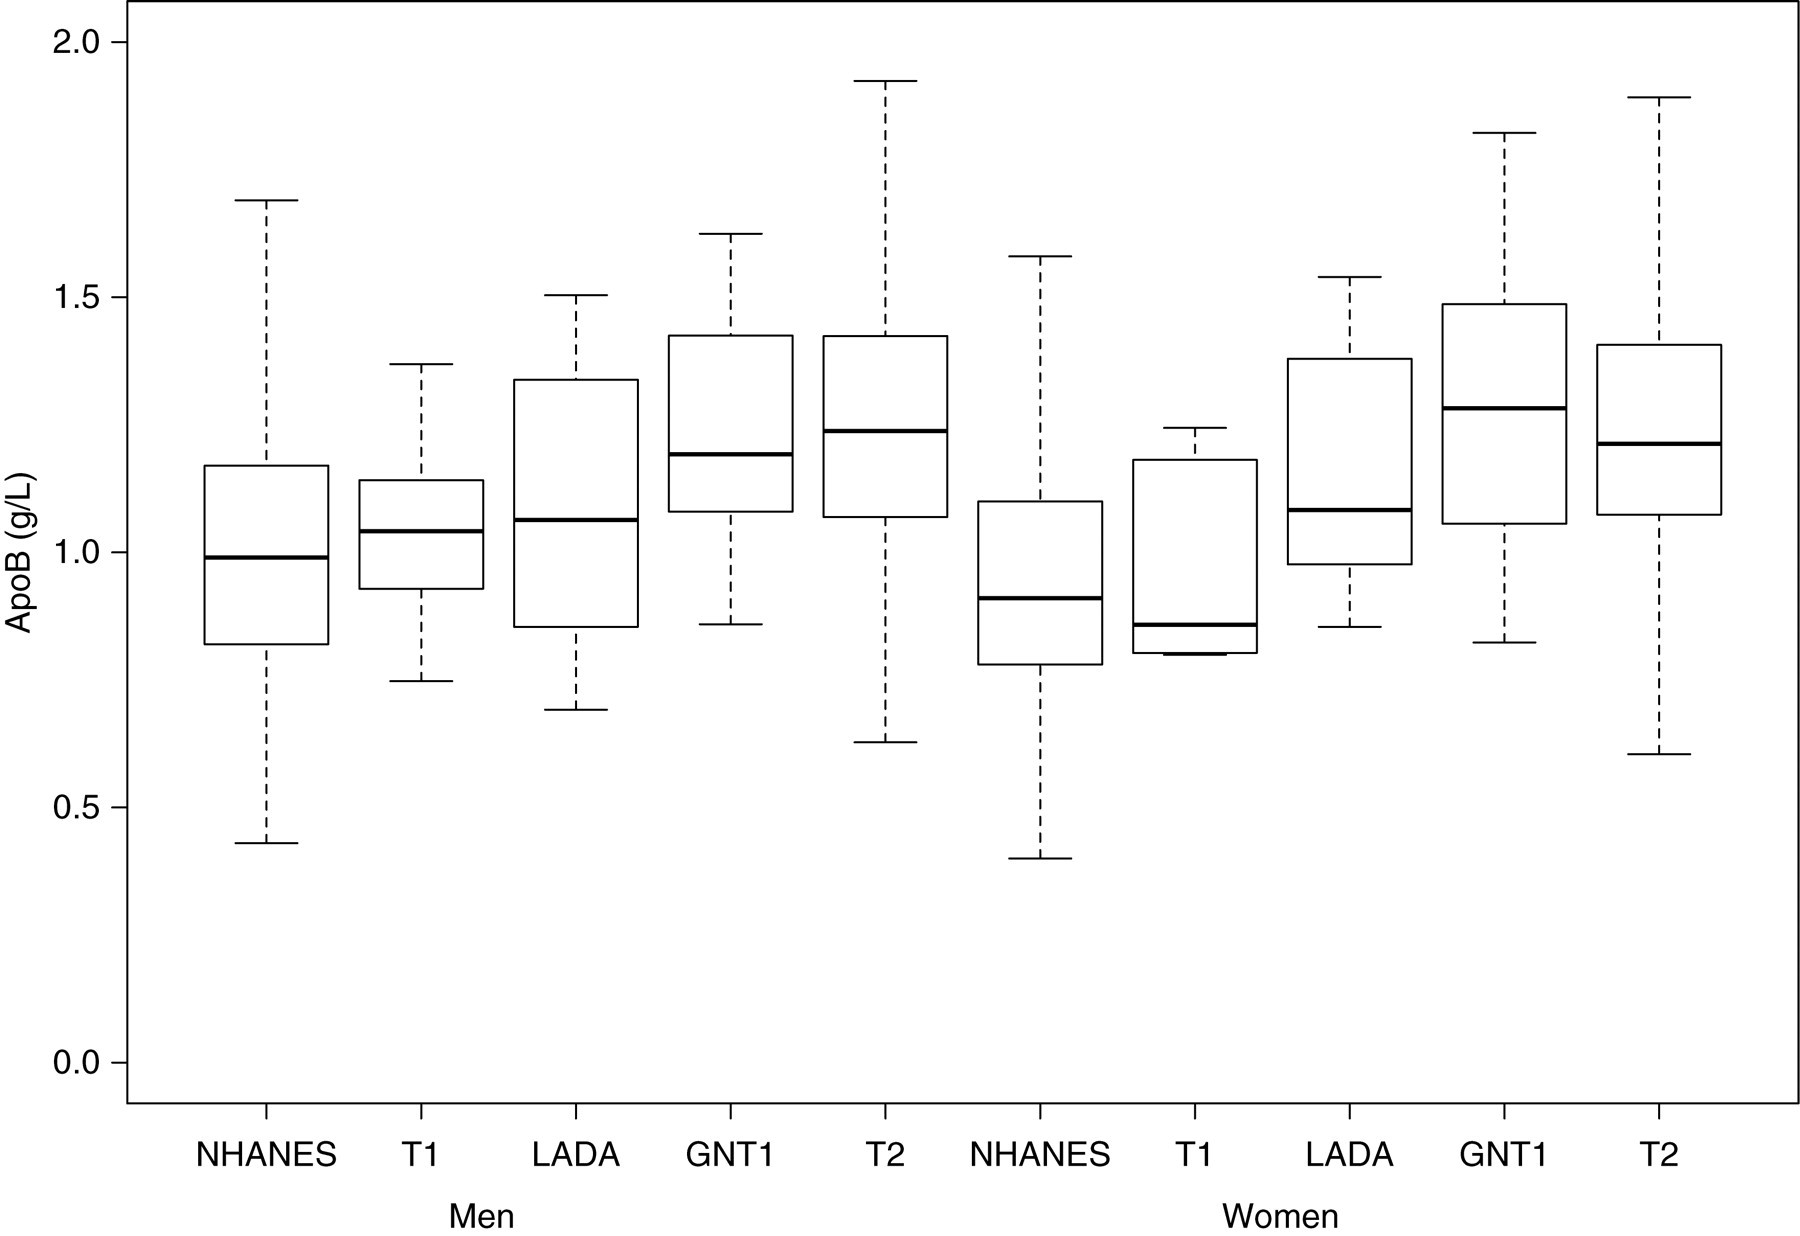
Boxplots of apolipoprotein B (apoB), subdivided by sex and status (T1, type 1 diabetes; GNT1, antibody-negative type 1 diabetes; T2, type 2 diabetes)
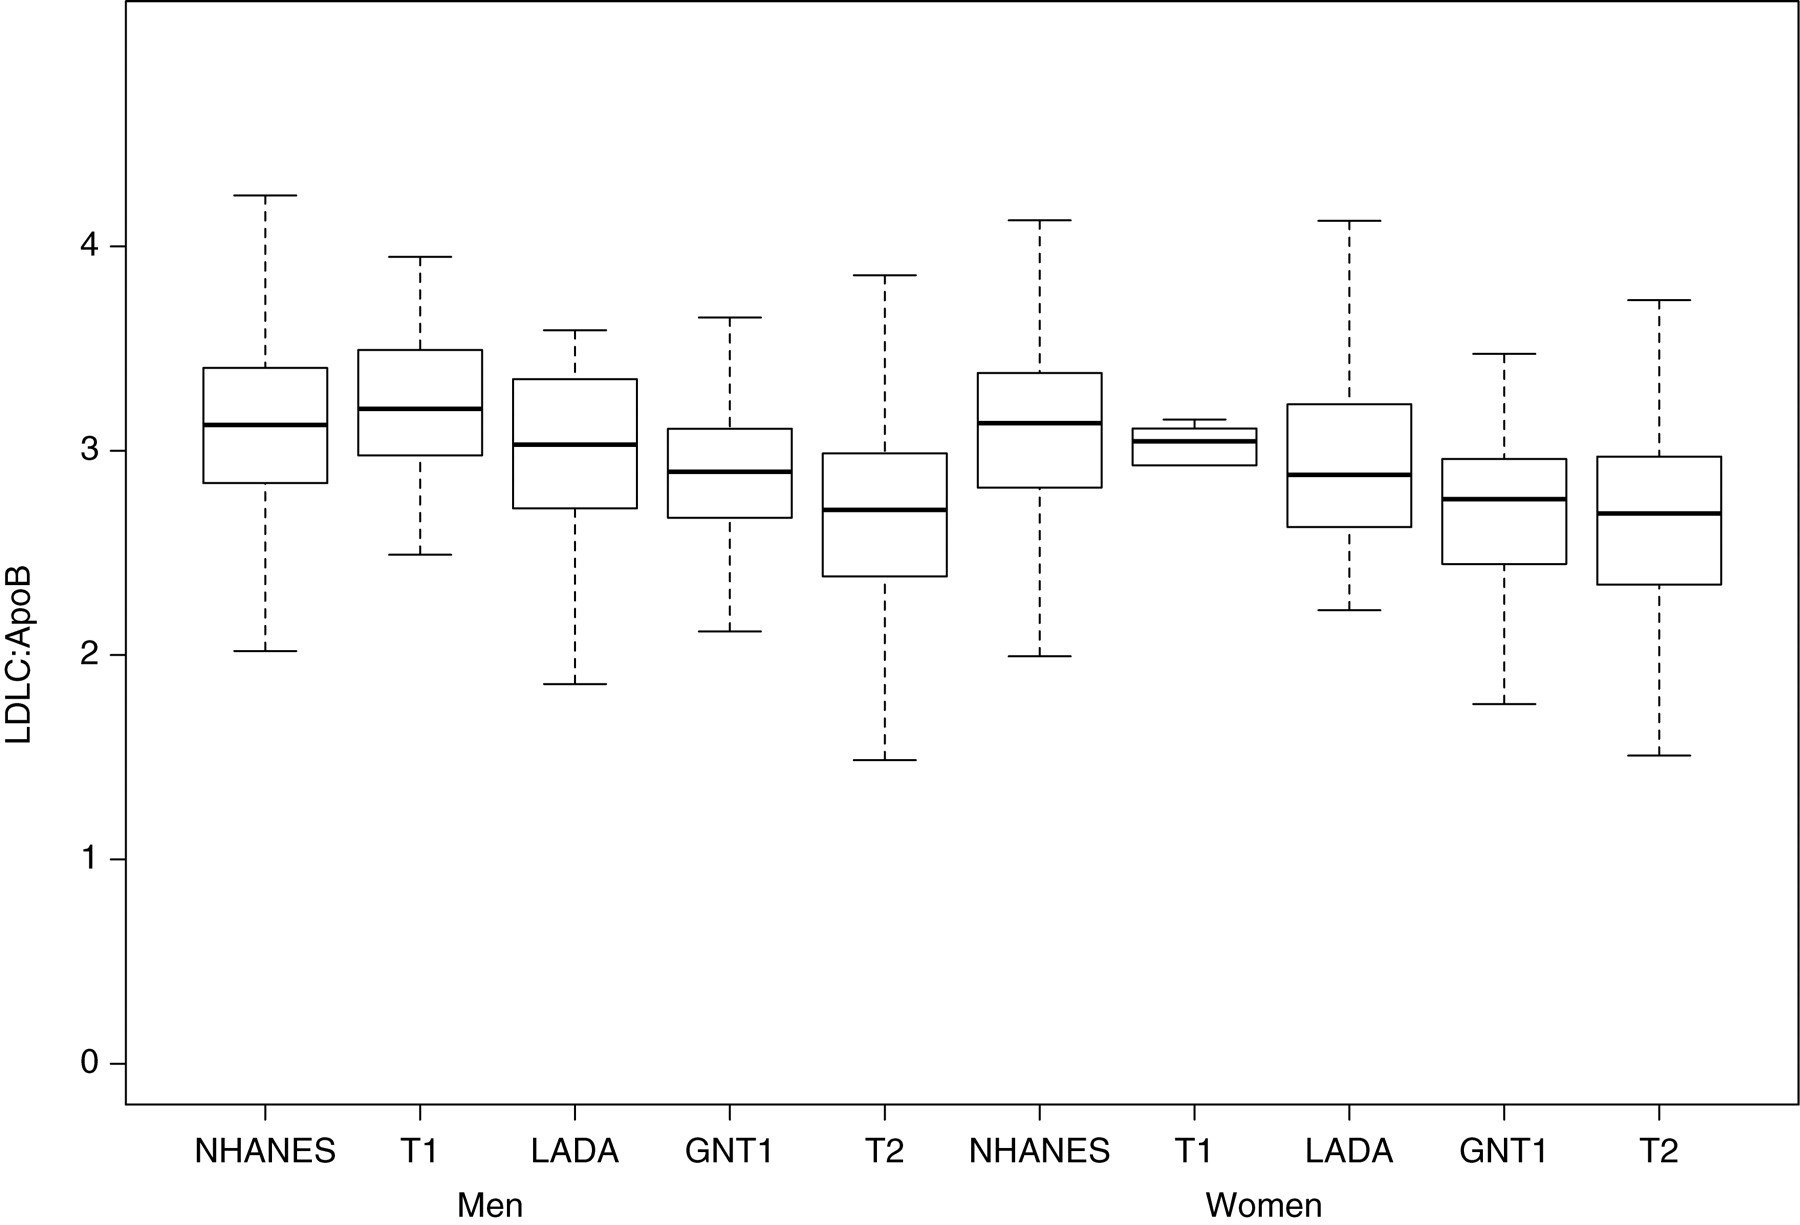
Boxplots of LDL-cholesterol (LDLC):apolipoprotein B (apoB), subdivided by sex and status (T1, type 1 diabetes; GNT1, antibody-negative type 1 diabetes; T2, type 2 diabetes)
Comparison of lipids and apolipoproteins in non-diabetic population and subtypes of diabetes
TC, total cholesterol;TG, triglycerides; HbA1c, glycosylated haemoglobin; BMI, body mass index; WC, waist circumference; NHDLC, non-HDLC; APoA, Apolipoprotein B; LADA, latent autoimmune diabetes of adulthood; HDLC, HDL cholesterol; LDLC, LDL cholesterol
*P < 0.05; **P < 0.01; ***P < 0.001; compared with non-diabetic population
After exclusion of patients on statin treatment, a TG value of >1.5 mmol/L and/or apoB >1.2 g/L was present in 37% of those in the NHANES sample, 23%, 48%, 65% and 69% of those with type 1 diabetes, LADA, antibody negative type 1 diabetes and type 2 diabetes respectively (Table 3).
Proportions of subjects with TG >1.5 mmol/L and/or apoB > 1.2 g/L
TG, triglycerides; NHANES, United States National Health and Nutrition Examination Survey; LADA, latent autoimmune diabetes of adulthood; GADA, glutamic acid decarboxylase antibodies; ApoB, apolipoprotein B
Discussion
This is the first study to document the distribution of lipoproteins and their associations with lipid parameters in a population of Sri Lankan individuals with diabetes. It also documents differences between lipid profiles by diabetes subtype in comparison with a largely non-diabetic reference population.
Although this study did not evaluate the presence of CVD, in other populations apoB and apoAI predict CVD more accurately than traditional risk factors such as TC, HDLC, LDLC, TG and the ratio of TC:HDLC. 5 HDL particles contain apoAI, while there is a one to one correspondence between apoB and the total number of atherogenic particles, of which 90% or more are LDL particles (except in familial dysbetalipoproteinaemia and hepatic lipase deficiency). Compared with normal, larger and more buoyant LDL, sd-LDL particles accelerate atherosclerosis because they contain less cholesterol per particle, are more easily oxidized, 13 better able to penetrate the arterial wall 14 and have higher affinity for proteoglycan. 15 The combination of an increased number of apoB carrying particles and the presence of sd-LDL particles is thought to be particularly atherogenic. sd-LDL particles are likely to be the dominant LDL fraction when the concentration of TG is between 1.5 and 2.5 mmol/L. 16–19 However, at present, sd-LDL can be measured only by methods not suited for routine clinical care. Apolipoprotein assays use simple immunoassay technology, are relatively cheap to perform, are readily available and do not require a fasting specimen. The assays are unaffected by high TG levels, and are internationally standardized, 9,10 accurate and precise.
Because of the 1:1 relationship between apoB and LDL particles, elevated apoB in the presence of normal LDLC suggests the presence of sd-LDL particles. 6 High TG, while not a good predictor of heart disease itself, appears to confer additional risk when combined with high apoB, perhaps acting as an indicator of the presence of sd-LDL. 12
In the present study, patients with type 1 diabetes had favourable lipid profiles, with few exhibiting high apoB and/or high TG. By contrast, patients with type 2 diabetes had elevated apoB, LDLC, apoAI, HDLC and apoB:apoAI, and low LDLC:apoB. In addition, 33% had high apoB and TG, and 21% high apoB alone, compared with 11% and 7% in the reference population.
It might be argued that these lipid abnormalities are to be expected in patients with diabetes and that they are partly a function of obesity. We examined this by comparing BMI and waist circumference in the Sri Lankan group and non-diabetic population. Among the Sri Lankan group, BMI and waist circumference were strongly correlated with each other, and were significantly lower in patients with type 1 diabetes than in those with other types. However, both were poor predictors of lipid parameters, the highest absolute correlation being −0.17 (with HDL). Moreover, both BMI and waist circumference were lower among patients with all types of diabetes than in the non-diabetic NHANES population, while their lipid profiles tended to be worse, especially among those with type 2 diabetes.
Other studies have reported high levels of apoB in type 2 diabetes. Among 249 Canadian (mainly Caucasian) patients with type 2 diabetes, 30.1% had raised apoB and TG, and 9.2% had raised apoB alone. 20 Among young American patients with diabetes, 21 36% with type 2 had apoB >1 g/L and 36% had TG > 1.69 mmol/L, compared with 83% and 39% in our group. The prevalence of high apoB among Oji-Cree patients was comparable to that in our group. 22
With regard to other South Asian populations, two studies have compared subjects from South Asia living in the UK with their siblings in the Punjab 23 and Gujarat 24 and have reported significantly higher apoB values among the migrants. In the latter study, although apoB and apoAI were higher in those with impaired glucose tolerance and diabetes, the differences were not significant. By contrast, patients in our study with type 2 diabetes exhibited higher apoB than any group in these two studies. In summary, the Sri Lankans with type 2 diabetes exhibited levels of atherogenic dyslipidaemia that exceeded those in most previous studies of patients with type 2 diabetes.
To our knowledge, no prospective study of lipoproteins subfractions and CVD among South Asians with or without diabetes exists. The Interheart Study 25 compared lipids and apolipoproteins among patients experiencing a first myocardial infarction with age- and sex-matched controls from 52 countries, including Sri Lanka. The study included 3577 South Asian participants, with median age 51 y. The overall median apoB was 0.93 g/L in cases and 0.88 g/L in controls, much lower than in our group (1.23 g/L); however, because of the higher apoAI in our group, the apoB:apoAI ratio was similar in Interheart cases (0.85) to our group. 25 Patients with diabetes were not specifically identified.
The strengths of this study are the size of the sample, the young age of the participants, and that it is the only such study in Sri Lankan patients. Because of an increasing burden of diabetes and of CVD, South Asians represent an important group, about whom little information exists. Possible weaknesses of the study include being clinic- and urban-based, which might include those with severe diabetes phenotype with limited generalizability to rural patients. That there was no Sri Lankan non-diabetic group with which to compare the lipid and apolipoprotein values limited our ability to speculate about the natural history of changes in lipoproteins in diabetes. Follow-up of this cohort will provide valuable data on the relationship of lipids and apolipoproteins and subsequent CVD.
In conclusion, several pieces of evidence imply that a high proportion of young patients from Sri Lanka with type 2 diabetes have atherogenic lipid profiles: elevated apoB often accompanied by elevated TG, high apoB:apoAI ratio and low LDLC:apoB ratio. These values appear worse than in other South Asians populations. Whether these profiles translate into CVD requires follow-up studies.
DECLARATIONS