
Abstract
Background
We have developed a liquid chromatography tandem mass spectrometry (LC-MS/MS) method for measuring salivary cortisol, which requires only 200 μL sample and no extraction.
Methods
Sample (200 μL) and 25 μL internal standard were added directly to a 96-deep-well plate. Of this, 50 μL was loaded onto a guard cartridge, the cartridge was then washed and the eluate was diverted to waste. The compounds were eluted from the guard cartridge onto the C18 analytical column. Cortisol and deuterated cortisol were monitored using transitions m/z 363.2 > 121.1 and 365.1 > 122.2, respectively.
Results
The method had a lower limit of quantitation of 2 nmol/L. Intra-assay and inter-assay imprecision were better than 9.5%. Comparison with an established dissociation enhanced lanthanide fluorescent immunoassay (DELFIA) gave good agreement for the majority of samples; LC-MS/MS = 1.0065 × DELFIA − 3.7 (n = 130). The reference range was determined to be 5.8–45.7 nmol/L at 08:00 h and <6.4 nmol/L at 23:00 h (n = 44).
Conclusions
We have developed a simple, robust assay to measure salivary cortisol using on-line solid-phase extraction to reduce sample clean-up requirements.
Introduction
Cortisol is present in saliva as it passes freely across body compartments due to its lipophilic nature. Only the cortisol in the serum that is not protein bound can pass freely; therefore, it is thought that salivary cortisol reflects the free cortisol concentration in the serum. As a reflection of free cortisol, salivary cortisol may be a more reliable indicator of cortisol status in patients with altered binding protein concentrations, such as people on the oral contraceptive pill or rarer cases, e.g. congenital cortisol binding globulin (CBG) deficiency.
Previous studies have shown salivary cortisol to have a curvilinear correlation with serum cortisol. 1 It is thought that this correlation only becomes linear once the CBG binding capacity has become saturated; supporting the theory that salivary cortisol reflects free cortisol status.
A further advantage of measuring salivary cortisol rather than serum cortisol is the non-invasive nature of the sample collection. Saliva collection devices are commercially available, which utilize a swab to absorb saliva and act as a filter when centrifuged to remove food particles and mucoproteins. These swabs may also be impregnated with citric acid to stimulate saliva flow. Previous studies have shown cortisol to be stable in these collection devices before centrifugation for at least three days at room temperature. 2–4 This would allow the saliva to be transported to the laboratory by mail, allowing collection at home. This would be particularly advantageous in the case of suspected Cushing's syndrome to allow the simple collection of a sample for midnight cortisol. 5 A further benefit would be for monitoring patients receiving hydrocortisone replacement therapy, who regularly undergo blood sampling for cortisol day curves. Theoretically, a salivary cortisol day curve could supply the same information without it being necessary for the patient to attend the hospital for sampling, reducing the inconvenience to the patient and the demand on outpatient services. We have already demonstrated the use of salivary cortisol measurement during dynamic endocrine testing. 6
Tandem mass spectrometry (LC-MS/MS) is becoming a popular technique for measuring steroids in serum and urine, e.g. testosterone, 7,8 androstenedione, 7 cortisol, 9,10 urinary free cortisol (UFC), 11 dehydroepiandrosterone (DHEAS), 12 vitamin D 13 and 17-hydroxyprogesterone. 14 Many of these assays have been shown to give lower concentrations than traditional immunoassays, suggesting that the immunoassays are prone to interferences. Previous studies have demonstrated that immunoassays for salivary cortisol can give higher results than a tandem mass spectrometry assay, suggesting that a saliva matrix is not free from this phenomenon. 15,16
We present a simple and quick assay for salivary cortisol that does not require lengthy sample extraction and is free from interference from all endogenous and exogenous steroids tested.
Materials and methods
Sample preparation
Stock solutions were prepared by dissolving hydrocortisone (Sigma, Poole, UK) in methanol (Sigma, Poole, Dorset) and were stored at −20°C for up to six months. A separate stock solution was prepared for standards and quality controls (QCs), both 10 mg/mL. Working standards and QCs were prepared by diluting the stock solution with phosphate-buffered saline (PBS) pH 7.4 (Sigma, Poole, Dorset) to give concentrations of 0, 3.4, 17, 34, 67 and 100 nmol/L and 5.6, 28 and 56 nmol/L, respectively. Aliquots of these were stored at −30°C for up to six months. Deuterated cortisol (D2) was used as internal standard (CDN Isotopes, Quebec, Canada) at a working concentration of 30 μg/L in methanol. D2-cortisol was used as this is currently in use for UFC in our laboratory. 11
Standard, QC or sample (200 μL) was manually pipetted directly to the well of a 96-deep-well block (Abgene, Epsom UK). To this, 25 μL of working strength internal standard was added. The block was thermosealed (Abgene, Epsom UK) and vortexed for one minute, then centrifuged at 1500
Chromatography
A Shimadzu Prominence LC system (Shimadzu, Milton Keynes, UK) was used for chromatography. The mobile phases utilized were: A, water with 2 mmol/L ammonium acetate (Sigma, Poole, UK) and 0.1% formic acid (VWR International Ltd, Leicestershire, UK); and B, methanol (LC-MS grade, Riedel-de Haen, Hanover, Germany) with 2 mmol/L ammonium acetate and 0.1% formic acid. The sample was injected onto a Phenomenex C8 4 × 2 mm guard cartridge (Phenomenex, Macclesfield, UK) using 10% mobile phase B at a flow rate of 1 mL/min for 0.6 min. The eluate from the guard cartridge during this time was diverted to waste to allow sample clean-up and removal of saliva matrix before elution onto the analytical column.
After 0.6 min, the mobile phase composition was stepped up to 60% B and flow rate reduced to 0.4 mL/min to elute the cortisol from the guard cartridge. The eluate was directed onto the analytical column, a Phenomenex 30 × 3 mm 4 μm Synergy Hydro-RP C18. The flow was maintained at 60% B until 2.5 min when it was stepped up to 100% B for 0.7 min before returning to 60% B for the final 0.8 min. The small delay between injections (40 s) on this system was enough to re-equilibrate the guard cartridge with 10% B while maintaining the analytical column at 60% due to the initial divert to waste. Both guard and analytical columns were maintained at ambient temperature.
Mass spectrometry
The eluate was injected directly into a Quattro Micro™ tandem mass spectrometer (Waters, Manchester, UK) with a Z spray ion source. MassLynx NT 3.5 software was used for system control, the MassLynx QuanLynx programme allowed data processing. This software used the height of the detected peaks, 1/x weighting and linear least-squares regression to produce a standard curve. The 1/x weighting gives greater accuracy at lower concentrations. The mass spectrometer was operated in electrospray positive mode, the capillary was maintained at 1 kV and the source temperature was 140°C. The desolvation temperature and gas flow were 400°C and 1000 L/h, respectively. The most abundant transitions identified for cortisol and D2-cortisol using 1 mg/L tuning solutions of each compound in 50% mobile phases were m/z 363.2 > 121.1 and 365.1 > 122.2, respectively. The cone and collision energies were 26 V and 22 eV for cortisol and 22 V and 22 eV for D2-cortisol. A confirmatory ion transition for cortisol was monitored at m/z 363.2 > 97.0. Transitions were monitored in multiple reaction monitoring (MRM) mode, with a dwell time of 0.15 s.
Sample collection
Anonymized paired saliva samples were collected from 44 volunteers for the production of a reference range and for validation studies. There were 20 female and 24 male volunteers with an age range of 25–55 y. Samples were collected using the Sarstedt Salivette® (Numbrecht, Germany) device. This device consists of two chambers; the top chamber contains a cotton swab impregnated with citric acid (to stimulate saliva flow). This is chewed for at least 30 s and the saliva is absorbed into the cotton swab. The swab is placed in the upper chamber of the Salivette and the device is centrifuged. A hole in the upper chamber allows the saliva to pass to the bottom chamber during centrifugation. Approximately 0.5–3 mL of saliva can be collected by this method. The cotton swab acts as a filter to remove particulates and mucoproteins. Samples for the reference range were collected at 08:00 and 23:00 h and over one hour after brushing teeth or eating (n = 44 for each time point) and stored at −30°C following centrifugation.
The saliva samples for the comparison study were also collected with a Sarstedt Salivette device; however, a cotton swab without citric acid was used for the sample collections.
Validation
The assay was validated against published acceptance criteria for linearity, precision, recovery and sample stability. 17
Linearity
To evaluate linearity of the calibration curves, three curves were prepared and analysed in a single batch. The ratios of analyte peak height to internal standard peak height were plotted against cortisol concentration in nmol/L. Calibration curves were judged linear if the correlation coefficient (r 2) was better than 0.9900 as calculated by weighted linear regression. The standard curve was also extended to 300 nmol/L and assessed in the same way to determine whether the assay continued to be linear above the working range.
Imprecision
Imprecision of the method was assessed against a range of concentrations using PBS QC samples. These samples were analysed daily for 12 days to calculate inter-assay imprecision. To determine intra-assay imprecision the same samples were analysed 12 times within one batch. Percentage deviation was calculated from the difference between mean observed and nominal concentrations to assess bias.
Limit of quantitation and detection
The lower limit of quantitation (LLOQ) was defined as the concentration for which 10 replicates of PBS-based samples prepared with low concentrations of cortisol gave a coefficient of variation (CV) of less than 20% and a bias of less than 20%. The lower limit of detection was defined as the concentration that gave a peak with a 3 to 1 signal-to-noise ratio.
Recovery
We took six saliva samples with cortisol concentrations ranging from 3.7 to 35.0 nmol/L. The concentrations of cortisol added to each patient sample were 10.3, 26 and 52 nmol/L, respectively. The recovery was calculated from measured compared with expected concentrations and absolute ion counts were compared for any variances between matrices. Cortisol was also spiked into water, PBS and saliva with an undetectable cortisol concentration to assess the use of PBS as a matrix.
Ion suppression
Ion suppression is a matrix effect that occurs when compounds in a sample compete with the analyte for ionization in the source. To investigate this we infused a 50 nmol/L solution of cortisol in methanol directly into the mass spectrometer to give a constant background signal. A saliva sample was injected simultaneously via the autosampler. A reduction in the background signal is observed when ion suppression is occurring. The ion suppression is deemed significant if a reduction in signal of >10% is observed where the compound of interest elutes. Saliva samples (n = 6) were diluted 1 in 2 repeatedly with water to assess the linearity of the dilutions while diluting the matrix. This would also give an indication of the presence of ion suppression. If matrix effects are occurring, the cortisol results would dilute in a non-linear fashion.
Ion suppression was also assessed by spiking two concentrations of cortisol into eight different late night saliva samples and comparing the responses to water spiked with the same concentrations. Late night samples were used for this experiment as in most samples the cortisol concentration below the LLOD and any cortisol measured in the spiked sample is due to the cortisol added. If ion suppression was occurring in these samples there would be a discrepancy between the measured cortisol concentration between the saliva and water samples.
Specificity
Solutions of various related steroids, both natural and synthetic, were prepared in 50% methanol/water to a final concentration of 1000 nmol/L and injected directly, without internal standard. This excess concentration was chosen to allow easy identification of any potentially interfering peaks. The retention times of any compounds found to give a signal in the specific channels for cortisol or D2-cortisol were subsequently assessed to determine whether they would cause interference. Steroids tested were testosterone, dehydroepiandrosterone sulphate, dehydroepiandrosterone, oestradiol, progesterone, aldosterone, cortisone, corticosterone, prednisolone, fludrocortisone, dexamethasone, methylprednisolone, spironolactone, 17 hydroxyprogesterone, 11 deoxycortisol and androstenedione. Prednisolone was also analysed at concentrations of 1 μg/L (2.8 nmol/L) and 500 μg/L (1.4 μmol/L) to reflect the concentrations seen at very high doses 18 as the M + 2 isotope of prednisolone may cause an isobaric interference in the cortisol transition.
Comparative assay 19
We compared the results obtained in 130 anonymized saliva samples measured by LC-MS/MS with an in-house DELFIA solid-phase competitive fluoroimmunoassay method for salivary cortisol used at the Endocrine Unit at Southampton University Hospital (SGH). In this assay, patient cortisol competes with biotinylated cortisol (prepared in-house at SGH) for rabbit anti-cortisol antibody (Biogenesis Ltd, Poole, UK). Biotin complexes formed with rabbit anti-cortisol are then immobilized onto the microtitre well by attachment to a goat anti-rabbit IgG (Biosource, Paisley, UK). Biotinylated antigen–antibody complexes are then labelled using a europium-labelled avidin system. Enhancement solution is added to dissociate europium (Eu3+) from the solid phase bound europium-labelled antibodies (prepared in-house at SGH) to form a homogenous and highly fluorescent Eu-(2-NTA)3(TOPO)2−3 chelate solution. Fluorescence measurements are made using a time-resolved fluorometer, where fluorescence is inversely proportional to cortisol concentration in the patient sample. Standards were made in-house using a TRIS-based buffer.
Samples from patients were stored at −20°C until analysis, first using the DELFIA assay, and then by LC-MS/MS.
Statistical analysis
All statistical analyses were performed using Analyse-it software (Analyse-it Software Ltd, Leeds, UK).
Results
Both cortisol and D2-cortisol had retention times of 3.1 min (Figure 1) and a cycle time, injection to injection, of four minutes. There was no significant suppression of ionization in the region of the chromatogram where cortisol elutes. The lack of ion suppression was confirmed by spiking cortisol into cortisol-free saliva samples and dilutional linearity experiments. Mean recoveries from six saliva samples were 104% and 99% when concentrations of 175 and 35 nmol/L were added. Similar responses were achieved by spiking water, PBS and an undetectable midnight cortisol sample with the same concentrations of cortisol.
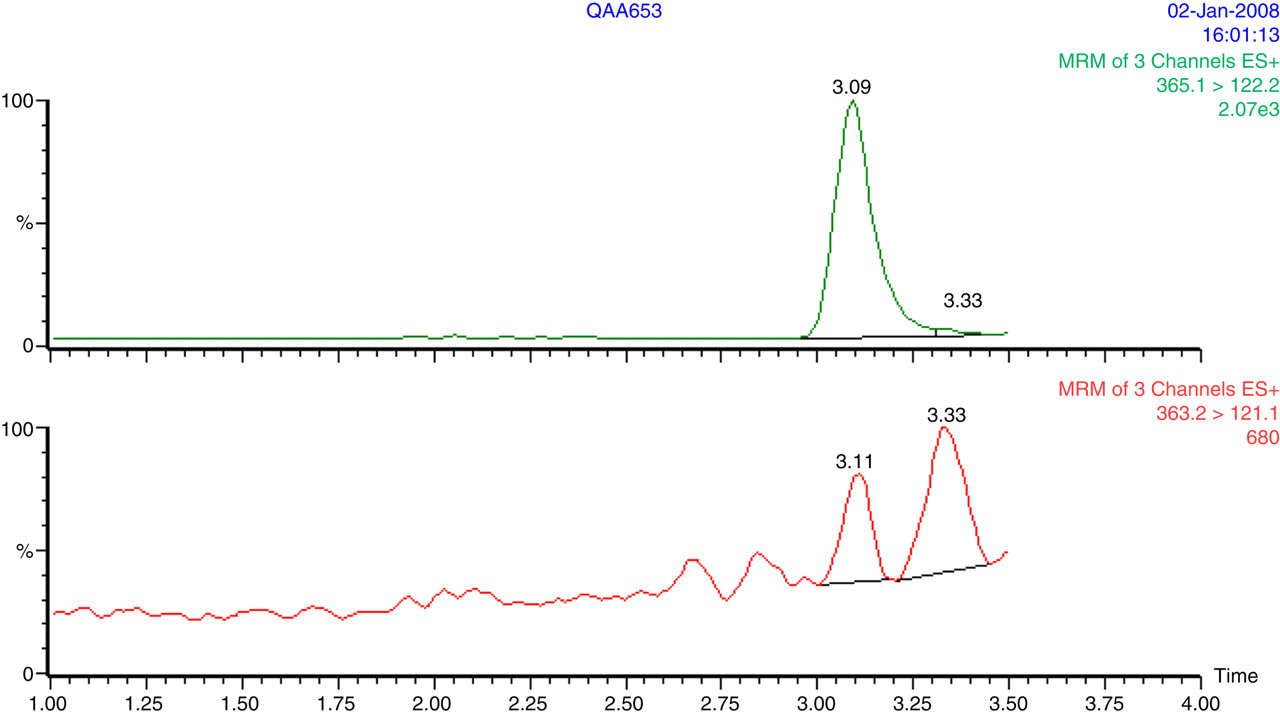
A typical chromatogram of a saliva sample with a cortisol concentration of 4.5 nmol/L. The top chromatogram shows the internal standard peak, and the lower chromatogram shows the cortisol peak at 3.1 min separated from a compound with the same transition at 3.3 min
Standard curves were made by plotting cortisol concentrations on the x-axis and cortisol/D2-cortisol peak height ratio on the y-axis. The curve was linear over the standard range, was reproducible between batches and continued to be linear up to a concentration of 300 nmol/L. The curve showed good correlation with the assigned standard values with an r 2 value of 0.999.
The lower limits of detection and quantitation were 1 and 2 nmol/L, respectively. The CV at 2 nmol/L concentration was 7.5% and the bias was −6%. At concentrations below this, the CV remained below 20% but the bias increased to over 30%.
The mean recoveries of the six samples were 97%, 101% and 104% (SD 9%, 17% and 13%) when 10, 26 and 52 nmol/L of cortisol was added and the increase in absolute ion counts for all matrices was similar. Testosterone, dehydroepiandrosterone sulphate, dehydroepiandrosterone, oestradiol, progesterone, aldosterone, corticosterone, fludrocortisone, dexamethasone, methylprednisolone, spironolactone, 17 hydroxyprogesterone, 11 deoxycortisol and androstenedione did not produce a peak in the MRM channels for cortisol or D2-cortisol. Cortisone did not produce a peak in either of the channels for cortisol and also had a different retention time using the chromatography described. Although prednisolone did co-elute with cortisol, it was not seen in the chromatogram until very high concentrations were injected (500 μg/L or 1.4 μmol/L) and we were unable to quantify this as it still remained below our LLOQ.
The inter-assay imprecision was 9.4%, 4.4% and 5.5% at concentrations of 4.7, 28 and 56 nmol/L. The intra-assay imprecision was 9.3%, 4.8% and 3.5% at the same concentrations. There was less than 7% deviation from expected concentrations.
The distribution of cortisol in morning and evening samples was skewed. The reference range (95% confidence interval) was determined to be 5.8–45.7 nmol/L at 08:00 and <6.4 nmol/L at 23:00 using the non-parametric reference interval analysis on Analyse-it for Excel.
Samples (n = 130) were analysed by both assays using the calibrators from the DELFIA assay to eliminate any calibration bias. The Bland–Altman analysis is shown in Figure 2. Passing and Bablok regression analysis gave the equation: LC-MS/MS = 1.0065 × DELFIA − 3.7 (n = 130). A small bias was observed between the two methods and the agreement was best at concentrations of <30 nmol/L. Some samples can be seen to give markedly different results between the two assays.
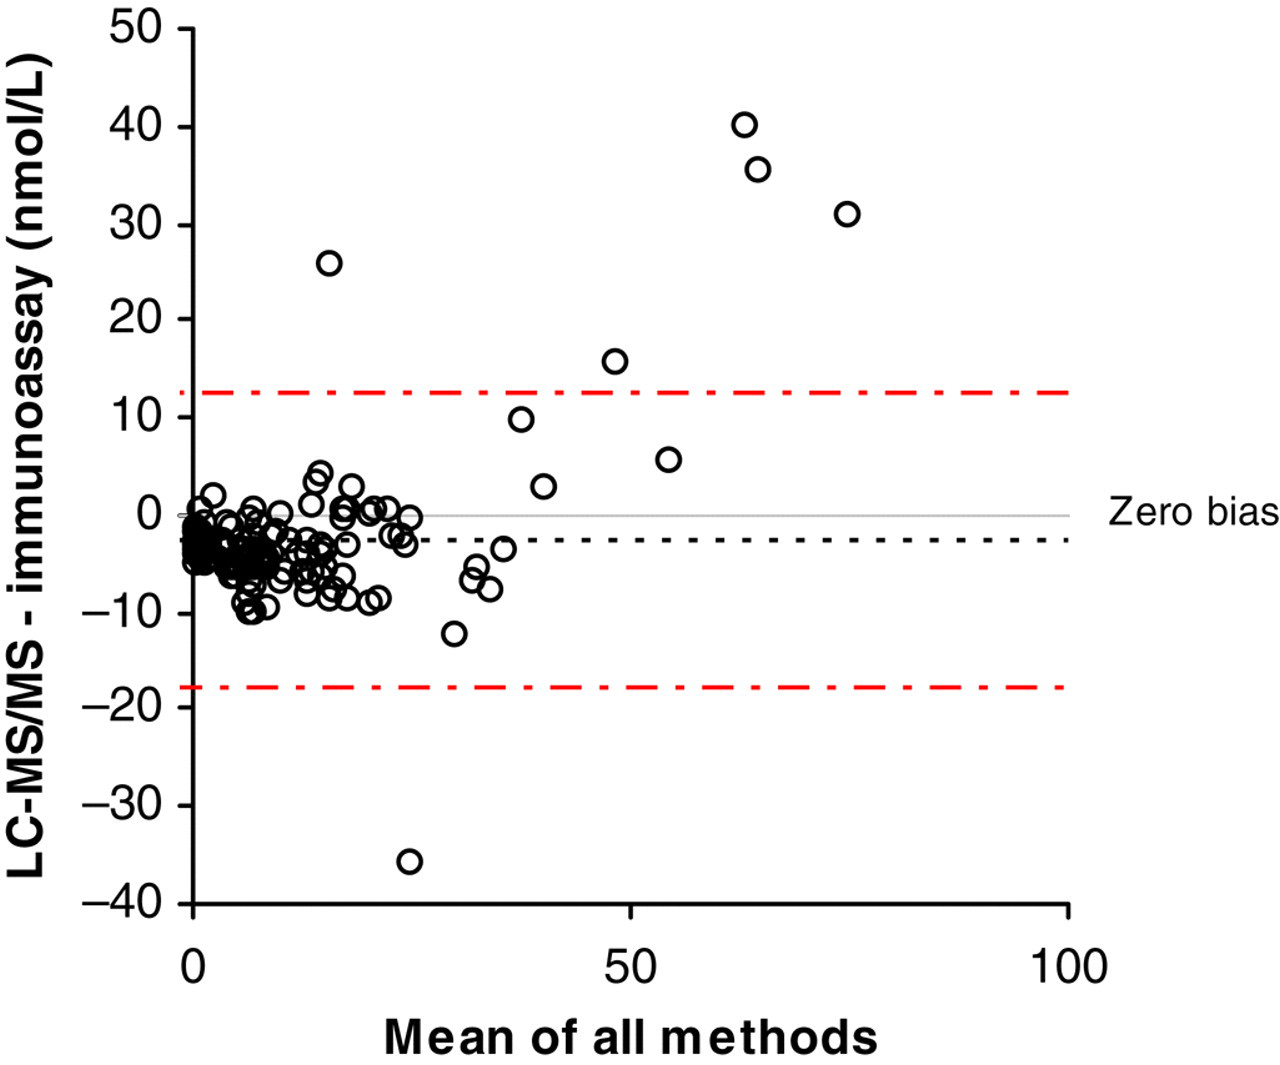
Bland–Altman analysis of 130 saliva samples by both LC-MS/MS and immunoassay using the same calibrators for each analysis
Discussion
There is a growing evidence base to support the use of salivary cortisol for the diagnosis of patients with adrenal pathology, but despite this not many laboratories are able to offer this service. This is often due to the limited availability of methods capable of measuring salivary cortisol.
We have described a method, utilizing LC-MS/MS equipment, to measure salivary cortisol in our department. The method has a very simple sample preparation step involving the addition of internal standard to centrifuged saliva. The cortisol in the sample is separated from the matrix using a guard cartridge before chromatography in an ‘on-line solid phase extraction’ configuration. This confirms that despite a crude sample preparation, the use of the guard column to trap the cortisol effectively allows the majority of the sample matrix to be eluted to waste before switching to the analytical column. Although another LC-MS/MS assay has been described, 16 this requires more time-consuming sample preparation. Utilizing on-line solid-phase extraction eliminates the need for lengthy extraction steps.
We have demonstrated the suitability of PBS as a matrix for calibrators by utilizing a midnight cortisol sample with undetectable cortisol concentration as a control matrix. We have previously shown that the use of an isotopic internal standard with only two deuterium atoms is acceptable as long as the internal standard concentration is kept suitably high enough to eliminate the M + 2 effect on the standard curve. 20 As all assays performed had r 2 of greater than 0.99, the linearity was maintained despite the use of a doubly deuterated internal standard.
The volume of saliva chosen for the analysis has not proven to be excessive and allowed us to sample more than once from each well; however, this may be scaled down pro rata for smaller samples if required. A smaller volume e.g. 100 μL would still be sufficient if partial loop injection mode is used to aspirate sample.
The validation of the assay was performed using salivettes containing a citric acid-impregnated cotton swab as this was the device used to collect sample for our clinical study. 6 The reference range in particular would only apply to samples collected by this technique. Further work is ongoing in our department to investigate the best way to collect samples for salivary cortisol since Sarstedt have now made available a salivette containing a polyester swab aimed for salivary cortisol analysis.
The chromatography was sufficient to resolve cortisone from cortisol and no interference was seen due to the natural M + 2 isotope. The corresponding isotope of prednisolone gave a small response just visible above baseline noise at the same retention time as cortisol when analysed in very high concentrations. A previous study has shown that an intravenous dose of 75 mg prednisolone gave a salivary prednisolone of up to 500 μg/L. 18 When this concentration of prednisolone was analysed in our assay we did not see a peak above our LLOQ and therefore was too low to quantitate. This differs to what has previously been seen for both cortisol and cortisone 21 but it may be that they fragment differently in the two assays. It is also unlikely, using current clinical guidelines, that a salivary cortisol assay would be requested in patients on prednisolone therapy. However, an important consideration is that metabolites of all the steroids tested may be present in saliva and it would be impossible to test for them all. The use of the confirmatory transition to calculate an ion ratio may be useful in identifying any endogenous or exogenous interferences.
Some immunoassays have been adapted to measure salivary cortisol 2,15,16 but the range of concentrations of cortisol in saliva varies between methods. A discrepancy has also been shown between mass spectrometry and immunoassay. 15,16 This may be due to cross-reactivity of the antibodies with similar steroids e.g. cortisone, but the calibration of assays is also an issue due the lack of a matrixed reference material. The comparison performed in this study supports this theory: Although the majority of samples gave a good comparison when the same calibrators were used to measure both sets (as shown in Figure 2), when each laboratory used their own calibrators a significant bias was observed. This difference in calibration may also affect results seen between LC-MS/MS assays. The reference range in this study is higher than a previously reported study 15 and differences in calibration could be the cause. Therefore, any laboratory setting up a method for measuring salivary cortisol should ensure they take this into consideration.
DECLARATIONS