
Abstract
Background
Type 2 diabetes is a complex disease that still requires a great deal of work to be carried out to understand the pathophysiology. Recently, researchers have focused on studying the organs and tissues known to be involved in the development of the type 2 phenotype using a proteomic approach. Little work has been reported on plasma of type 2 diabetics in whom the clinical status has been well characterized. In this study, changes in plasma proteins of type 2 diabetics were investigated by proteomic analysis in well-characterized individuals with type 2 diabetes (early and late stage) and control groups (with or without a family history of diabetes).
Methods
Samples were analysed by two-dimensional gel electrophoresis and significantly differentiated proteins were identified by nano-LC-ESI-MS.
Results
A total of 12 protein signatures that were differentially displayed with high significance compared with controls were selected. Four of the differentially displayed proteins were identified as haptoglobin alpha2, haptoglobin Hp2(fragment) and transthyretin and Chain A (formerly prealbumin), and all were up-regulated. Thiol-specific antioxidant protein, Chain A, tertiary structures of three amyloidogenic transthretin variants and haptoglobin-related protein precursor were all down-regulated in controls with a family history of diabetes, early and late diabetic patients in comparison with the control.
Conclusion
A proteomic-based approach was used to discover and identify the differentially expressed proteins in various states of type 2 diabetes.
Introduction
The incidence of diabetes, especially type 2 diabetes, has increased drastically over the past few decades in the developed world. According to the World Health Organization, 150 million people around the world now suffer from the disorder, with 90% of sufferers having type 2 diabetes. Type 2 diabetes, also known as non-insulin-dependent diabetes mellitus, is characterized by abnormal glucose homeostasis resulting in hyperglycaemia. An impaired early insulin secretory response of the pancreatic β-cell and decreased insulin sensitivity of muscle, fat and liver cells contribute to the state of hyperglycaemia. 1–3 Prolonged hyperglycaemia is associated with both micro- and macrovascular complications, which are the leading causes of morbidity and death in diabetes. 4,5 Type 2 diabetes is a complex disease with many causes. Genetic and environmental factors play important roles in the pathogenesis of type 2 diabetes.
There are key organs and tissues known to contribute to the development of diabetes and its complications and these are the pancreas, liver, muscle, adipose tissue, heart and kidney. To define the underlying pathophysiological processes that contribute to the disease development and to identify key pathways to target in the development of novel therapeutics will require a variety of approaches. In this context, it should be possible to take advantage of the tremendous power of proteomics to analyse protein expression profiles in tissues and plasma from normal individuals and patients with type 2 diabetes to identify proteins that may contribute to the disease. To date, most studies of diabetes using a proteomics approach have been carried out in cell lines and animal models of diabetes. 6–10 Since type 2 diabetes is associated with defects in multiple organs, proteomic analysis of plasma may provide considerable information relevant to the study of diabetes and its complications and has the potential to suggest diagnostic disease markers. Few proteomic analyses of plasma have been reported in relation to diabetes. 11,12 Moreover, clinical characterization of the study and control groups has rendered it difficult to interpret the relevance of the findings. Identification of differentially expressed proteins associated with diabetes has several long-term objectives. It should allow clinicians to devise preventive strategies for patients who are at a high risk of type 2 diabetes and the discovery of proteins involved in the disease should lead to a better understanding of the pathogenic processes. In addition, the establishment of appropriate protein markers may allow the precise classification of type 2 diabetic patients into subgroups for further effective targeted therapies. The aim of this study was to identify differentially displayed proteins in the development of type 2 diabetes by comparing plasma two-dimensional (2D) profiles of samples from subjects classified into four groups: controls without and with a family history of diabetes, and early and late stage type 2 diabetic patients.
Materials and methods
Patients and plasma sample preparation
Adult female volunteers of a similar age were subjected to a detailed clinical and biochemical investigation. All volunteers were evaluated with the oral glucose tolerance test (OGTT) for glucose metabolism. Before OGTT was performed, 250 g of a carbohydrate-containing diet (standard diet) was advised for three days preceding the test and after an overnight (12 hours) fast. Patients, who had impaired fasting glucose were administered 75 g of glucose (essentially, the criterion recommended by World Health Organization). Blood samples were withdrawn at baseline and 2 h. Glucose levels of 200 mg/dL (11.1 mmol/L) or higher at 2 h indicated type 2 diabetes. Fasting blood samples were drawn for insulin and HbA1c besides the other biochemical parameters. The diets of the each diabetes patient that were planned previously by their dietician were controlled before the tests. Insulin sensitivity was measured using the euglycaemic insulin clamp technique (Homeostatic Model Assessment; HOMA-IR). Blood samples were collected into EDTA tubes mixed and immediately centrifuged at 4°C, 3,000 g for 10 min. The plasma and buffy coat were carefully removed and stored at −80°C prior to analysis. Protein contents were assayed by the Bradford Method. 13
Anthropometry and body composition measurements were made by standard procedures. One hundred and twenty-four volunteers were classified into four groups: controls without a family history of diabetes, controls with a family history of diabetes, type 2 diabetics (duration ≤5 yr) and type 2 diabetics (duration ≥10 yr).
2D electrophoresis and protein identification
Plasma samples of four groups (seven for each, which were chosen as mean of statistics) were applied to 2-D electrophoresis (2-DE; Biorad's Protean II xi 2D Cell System, Hercules, CA, USA) according to Klose and Kobaltz
14
for protein separation. In all, 100 μL of plasma was solubilized with 108 mg urea, 10 μL 1.4 mmol/L DTT, 10 μL ampholite pH 3.0–10.0 (40%) and 10 μL CHAPS(40%). In the first dimension, vertical isoelectric focusing (IEF) using carrier ampholites in the range of pH 3–10 was performed and up to 650 μg of the protein sample was applied at the anodic side of the gel (160 × 1 mm) conducted at 200 V for 2 h, 500 V for 2 h, 800 V for 16 h and 1000 V for 30 min. After equilibration of the gels, the second dimension was a vertical sodium dodecyl sulphate-polyacrylamide gel electrophoresis as described by Laemmli
15
using 12% acrylamide gels (16 × 16 cm) where the IEF gel replaced the stacking gel of the Laemmli system. Following the staining with CBB R-250, 2-DE protein profiles were visualized and analysed by a Vilber-Laurmate image analyser using Bio-2D Software. Gels of the study groups (controls with a family history of diabetes, early and late type 2 diabetics) were compared with controls without a family history of diabetes and differentially displayed proteins were selected and cut out of the gels. After in-gel tryptic digestion according to the manufacturer's recommended procedure, proteins were analysed by nano-liquid chromatography-electrospray ionisation tandem mass spectrometry (nano-LC-ESI-MS-MS) (Proteom Factory, Berlin, Germany,
Differences among the four groups were tested by analysis of variance and Student's t-test. Values are expressed as means ± SD. A value of P < 0.0001 was considered significant. All statistical comparisons were compared by means of a statistical software package (SPSS for Windows).
The study was conducted according to a protocol approved by the Institutional Review Board of the Ege University, Medical School at Izmir.
Results
Subject characteristics
The aetiology of type 2 diabetes is multifactorial and probably genetically based, but it also has strong behavioural components. Compared with men diabetes is common among women as they are predisposed to certain diseases and syndromes that make them more susceptible to type 2 diabetes. In this study, female volunteers were grouped according to the clinical and biochemical characteristics and selection was made to eliminate the effect of other factors such as body mass index, total fat, triglyceride, cholesterol, low-density lipoprotein and high-density lipoprotein cholesterol on the study (Table 1). Patients with late-stage diabetes showed statistically greater values for waist, waist-to-hip ratio and fasting blood glucose and HbA1c were significantly higher in early and late diabetic groups in comparison to controls without a family history of diabetes. There were no significant differences between controls without a family history of diabetes and controls with a family history of diabetes. These data are important especially for controls with a family history of diabetes as they are an at-risk group. Type 2 diabetic patients who had had the disorder for more than 10 yr were also investigated for diabetic complications. Obese patients and those patients who had severe diabetic complications (angiopathy, retinopathy, nephropathy, etc.) were excluded from the study. Insulin resistance is a characteristic of type 2 diabetes. Insulin sensitivity was only compared between controls without a family history of diabetes, and controls with a family history of diabetes. Table 2 shows that the insulin sensitivity of both groups is similar (Student's t-test: Basal insulin; t = −0.054, P = 0.957, HOMA-IR; t = 0.218, P = 0.828).
Clinical and biochemical characteristics of study subjects
Controls (Group 1), controls with family history of diabetes (Group 2), type 2 diabetics (≤5 yr; Group 3), type 2 diabetics (≥10 yr; Group 4)
FBG, fasting blood glucose; LDL, low-density lipoprotein; HDL, high-density lipoprotein; BMI, body mass index; HbA1c, glycated haemoglobin[125]
Insulin sensitivity of study subjects
Identification of differentially displayed protein spots on 2-DE gels
Plasma samples from all groups were studied by 2-DE gel electrophoresis (Figures 1 and 2). A total of 11 protein signatures that were differentially displayed as compared with controls were selected for further analysis.
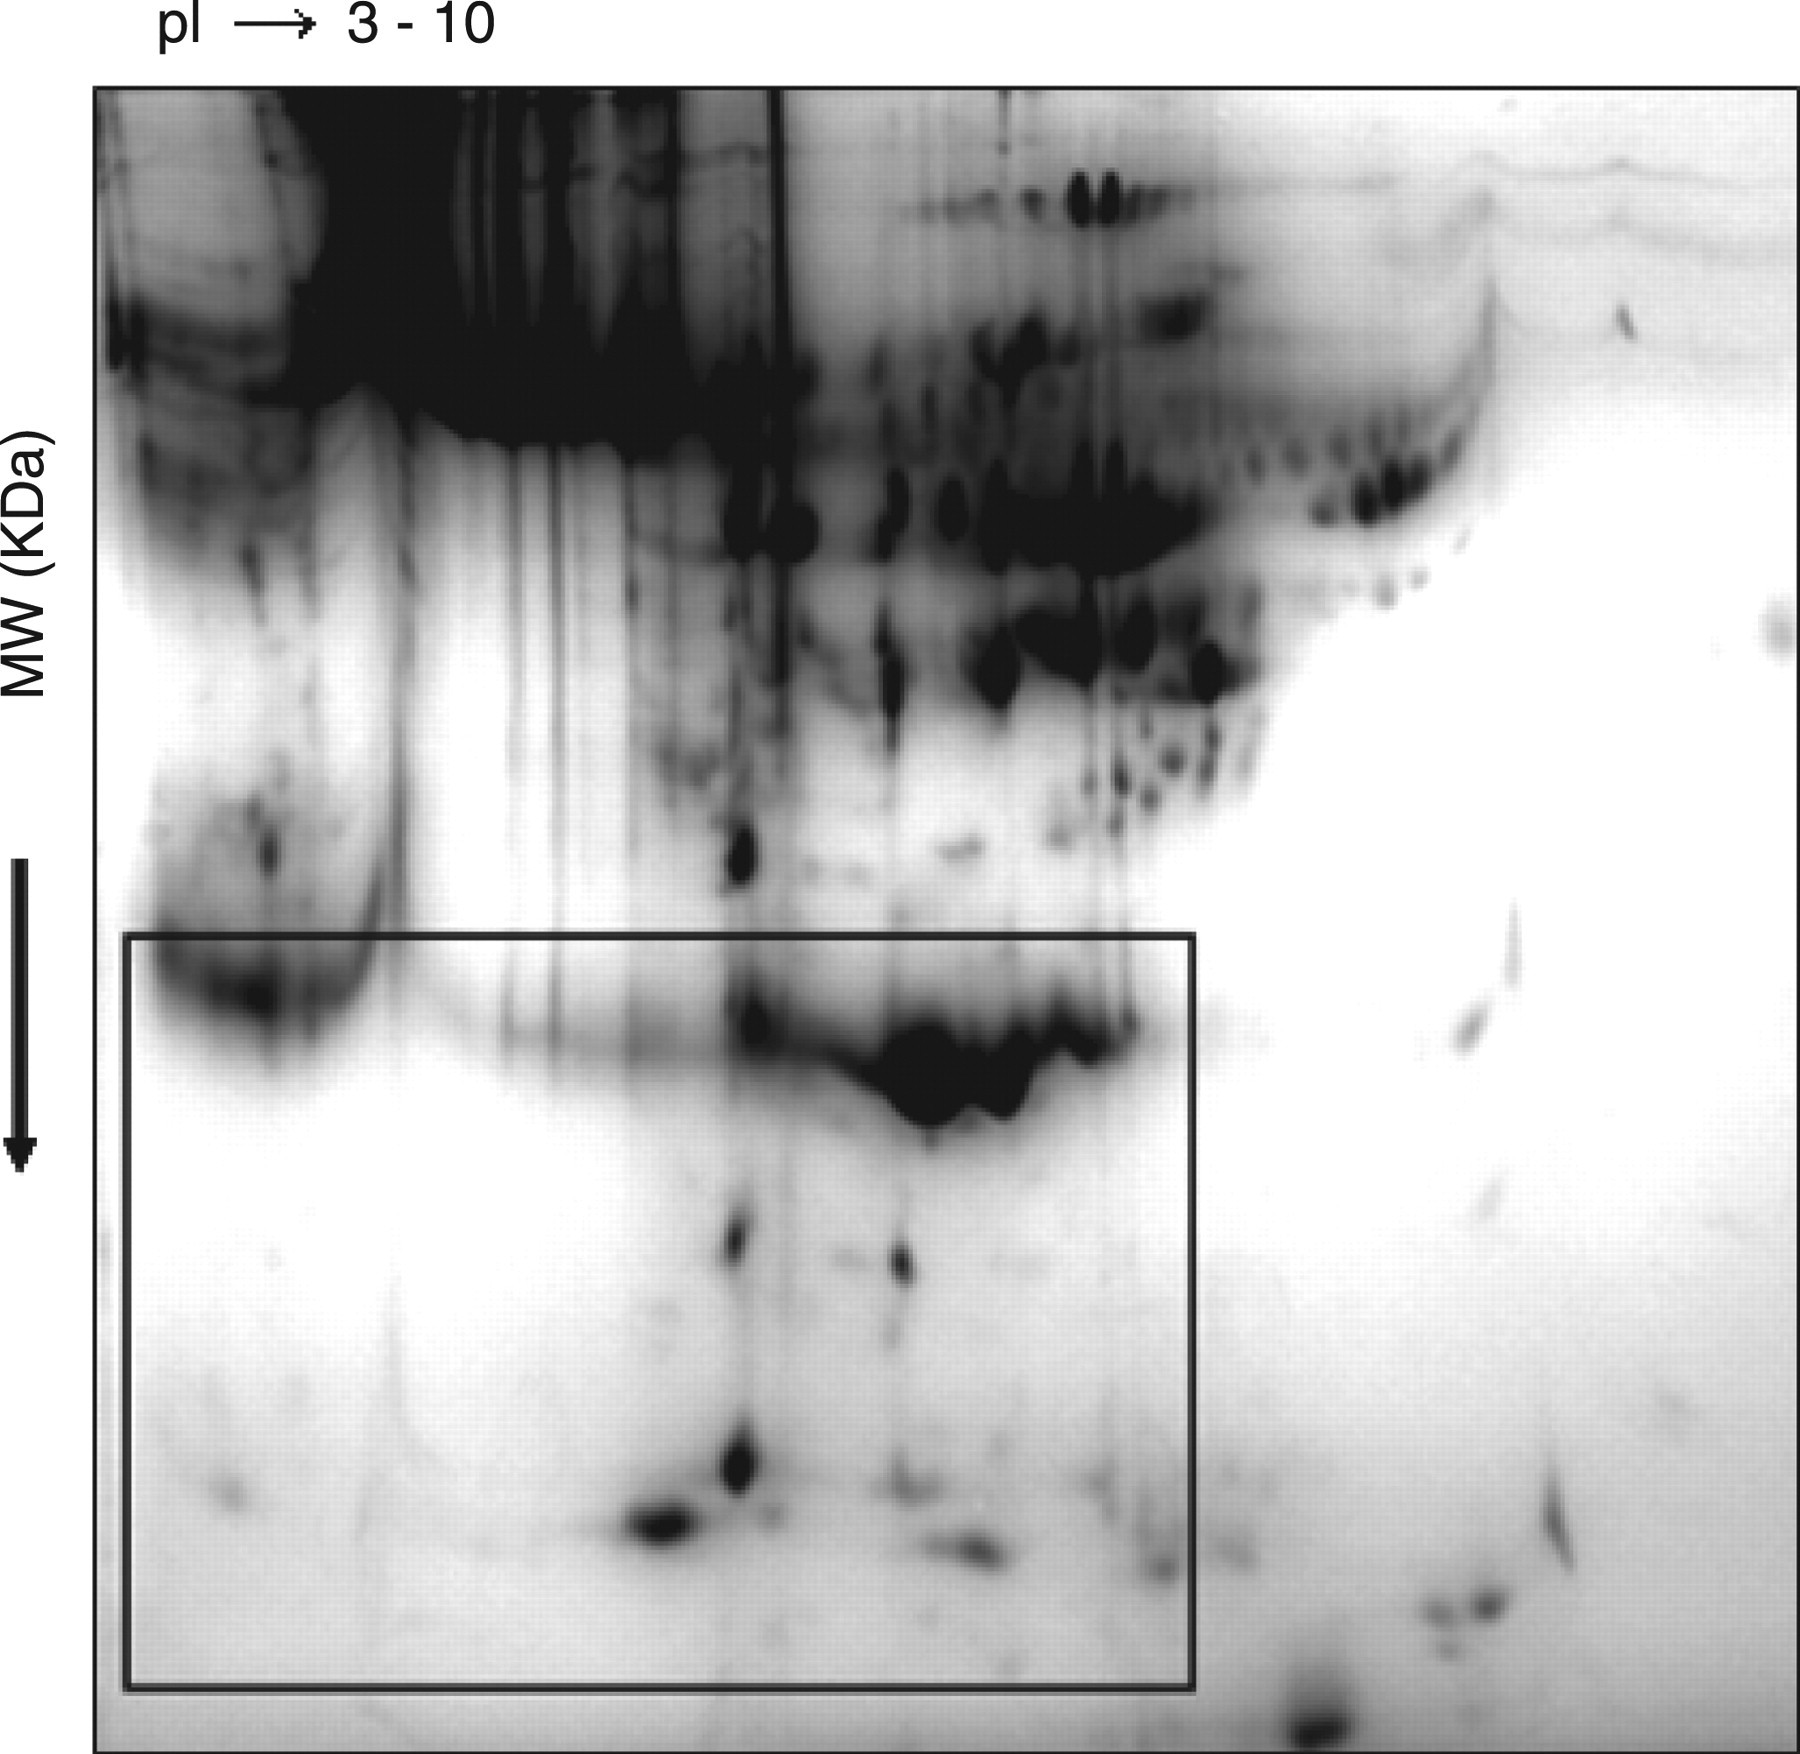
Representative 2D gel image of plasma controls. The location of the section for major differentially displayed proteins is indicated by the boxed area
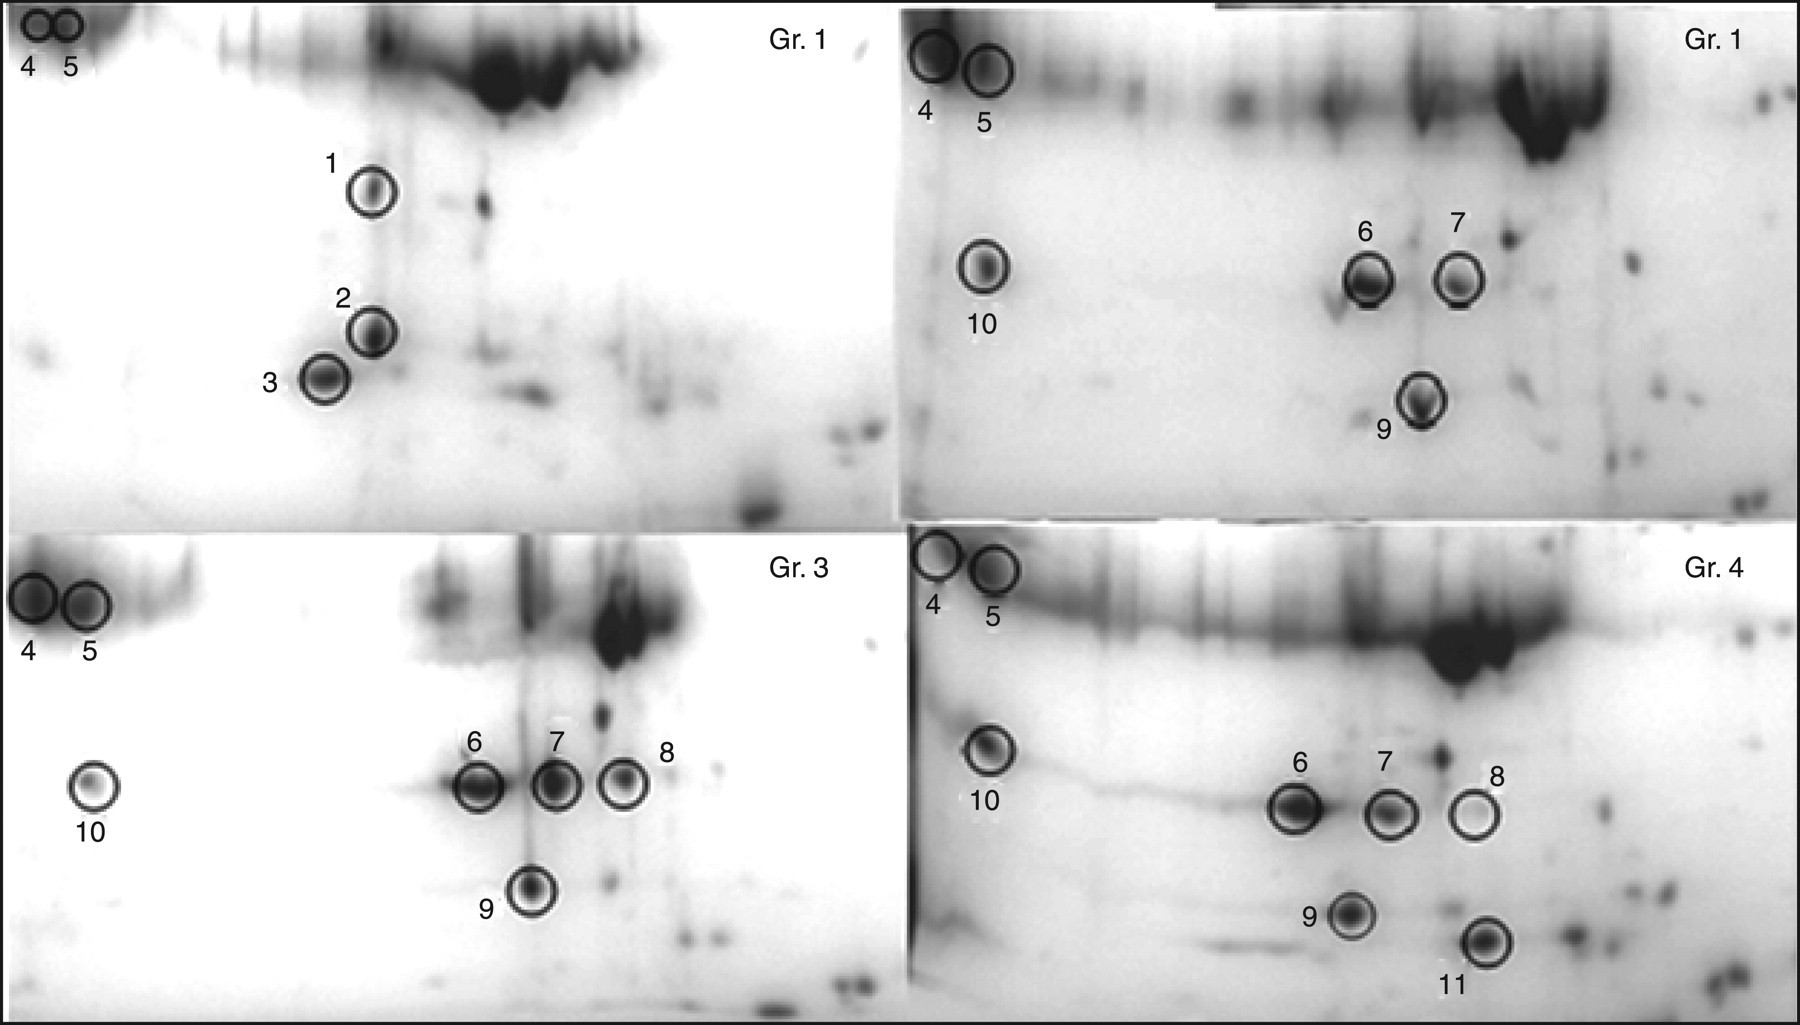
Comparison of enlarged corresponding areas for the study groups used to excise the proteins; controls (Gr. 1), controls with a family history of diabetes (Gr. 2), type 2 diabetics (≤5 yr; Gr. 3), type 2 diabetics (≥10 yr; Gr. 4)
Lower molecular weight proteins were visualized in non-albumin-depleted gels and the bottom part of the 2-DE gels was used to compare the major differentially displayed proteins indicated by the boxed area of Figure 1. Those patients in Group 2, that is those non-diabetics with a family history of diabetes, an at-risk group for type 2 diabetes were investigated using a proteome approach. Table 3 lists the selected proteins and their identities obtained from nano-LC-ESI-MS-MS analyses.
List of identified proteins in two-dimensional electrophoresis pattern of plasma in diabetes development
*Variable modifications: oxidation (methionine) for all proteins analysed except Chain A, tertiary structures of three amyloidogenic transthretin variants
Three of the differentially displayed proteins among the selected spots identified as;haptoglobin alpha2 (spot 6), haptoglobin Hp2 fragment (spots 7 and 10) and transthyretin; Chain A (formerly prealbumin, spot 9) were all up-regulated. Thiol-specific antioxidant protein, Chain A (spot 1), tertiary structure of three amyloidogenic transthretin variants (spot 2) and haptoglobin-related protein precursor (spot 3) were down-regulated in groups 2, 3 and 4 as compared with the controls.
Discussion
In this study plasma was examined to assess the differences in the protein profiles between normal individuals and those with a family history of diabetes, or early and late diabetic patients. Plasma was used since type 2 diabetes is associated with defects in multiple organs. Thus proteomic analysis of plasma might provide information on the pathogenesis of the study of the condition and associated complications.
Previous reports have shown that haptoglobin polymorphism is associated with the prevalence and clinical evolution of many inflammatory diseases. 9,16,17 Consistent with these reports our results showed that haptoglobin alpha 2 and haptoglobin Hp2 fragment were up-regulated in three groups (Groups 2, 3 and 4) relative to controls. Haptoglobins and their fragments are acute-phase proteins that are up-regulated in inflammation-related diseases such as diabetes, and the observation in Group 2 subjects suggests that it could be an early sign for the development of type 2 diabetes. Additionally, Figure 2 shows that haptoglobulins (alpha2 and Hp2 fragment) yields more than one spot. These appear to be degradation products of the full-length protein; however, it is unclear why the degradation products of all proteins are not seen in the 2D gels.
Transthyretin (TTR) exists both in a tetrameric and a 13.9 kDa monomeric form. The tetrameric form promotes β-cell function, while the monomeric form 18 is without effect. Increased blood levels of monomeric TTR have been reported and suggested to be associated with β-cell failure in type 1 diabetes. 19 We found that transthyretin (Chain A) levels are also up-regulated. This finding agrees with the data of Sundsten et al. 20 In contrast, in another study, the levels of TTR in patients with type 2 diabetes were not affected and in inflammatory states, TTR has been shown to decrease. 17,21 Methionine oxidized TTR in at-risk groups appears to be a potential indicator for type 2 diabetes. TTR has attracted much more attention because of its propensity for misfolding and aggregation diseases. 22,23 Accumulations of oxidized proteins have been demonstrated in degenerative diseases and may contribute to the development of type 2 diabetes. Methionine oxidation, which induces alterations of the 3D structure of proteins, is probably an early event of the disease process.
Finally, the protein spots 1–3 in control groups referring to thiol-specific antioxidant protein, chain A, tertiary structures of three amyloidogenic transthretin variants and haptoglobin-related protein precursor have been identified as common proteins in plasma. Thiol-specific antioxidant proteins play an important role in redox regulation of the cell and defence against oxidative stress. Oxidative stress via reactive oxygen species has been proposed to be the root cause underlying the development of insulin resistance, β-cell dysfunction, impaired glucose tolerance and diabetes mellitus. 24 The down-regulation of thiol-specific proteins reflects oxidative protein damage and can be considered to be a unifying link in diabetes mellitus. However, only limited data relating the degree of oxidative protein damage to diabetes mellitus 2 in prediabetic states are available.
The proteins identified in the subject groups in this study provides an initial frame work upon which additional proteomic studies can build a database to explore the pathophysiology of type 2 diabetes. Further studies are needed to investigate effects on proteins that occur at low concentrations in plasma.
In conclusion, diabetes is a complex disease and much work lies ahead before we can gain detailed insights at the molecular level into the pathophysiology of the disease. Proteomic technology may provide some answers much sooner than anticipated.
DECLARATIONS