
Abstract
Proteinuria is a classic sign of kidney disease and its presence carries powerful prognostic information. Although proteinuria testing is enshrined in clinical practice guidelines, there is surprising variation among such guidelines as to the definition of clinically significant proteinuria. There is also poor agreement as to whether proteinuria should be defined in terms of albumin or total protein loss, with a different approach being used to stratify diabetic and non-diabetic nephropathy. Further, the role of reagent strip devices in the detection and assessment of proteinuria is unclear. This review explores these issues in relation to recent national and international guidelines on chronic kidney disease (CKD) and epidemiological evidence linking proteinuria and clinical outcome. The authors argue that use of urinary albumin measurement as the front-line test for proteinuria detection offers the best chance of improving the sensitivity, quality and consistency of approach to the early detection and management of CKD.
Introduction
Proteinuria is the cardinal sign of kidney disease. Measurement of total protein in urine is a traditional, inexpensive and well-established test for kidney injury, and the nephrological literature, until recently, has been predicated on daily urinary total protein loss. Urinary protein measurement to detect underlying kidney disease is indicated in a range of clinical situations, including newly discovered chronic kidney disease (CKD), newly discovered haematuria, newly diagnosed hypertension, suspected pre-eclampsia, unexplained oedema, suspected heart failure, suspected multisystem disease (e.g. systemic lupus erythematosus), systemic vasculitis and diabetes mellitus. Monitoring of urinary protein loss forms part of the standard care of patients with established CKD. 1
Stage 3–5 CKD (glomerular filtration rate [GFR] <60 mL/min/1.73 m2) affects about 8.5% of the adult UK population. 2 It is likely that a further 5% have stage 1–2 CKD, 3 generally diagnosed in the presence of proteinuria or albuminuria in patients with stage 1 (normal GFR, >90 mL/min/1.73 m2) and stage 2 (mildly reduced GFR, 60–89 mL/min/1.73 m2). A small number of these patients, approximately 0.2% of the population, will progress to kidney failure, requiring either dialysis or transplantation to maintain life. Not all CKD patients will have proteinuria, but the presence of proteinuria appears to identify a subpopulation of CKD patients that are at greatly increased risk of kidney disease progression, 4–8 cardiovascular disease and death. 9–14 A preliminary study using renin–angiotensin system blockade to target reduced protein loss as a therapeutic aim has demonstrated improved outcomes in terms of renal preservation. 15
Testing urine samples for the presence of protein is an essential part of the identification of kidney disease. Endorsement of proteinuria testing in at-risk groups has been recommended by the English and Welsh Renal National Service Frameworks (NSF) 16,17 and by national and international guidelines. It facilitates risk stratification and appropriate management of the large number of patients with CKD identified within primary and secondary care following the introduction of automated GFR reporting by laboratories. 18 Assessment of proteinuria allows therapeutic interventions to be directed at high-risk patients and avoids unnecessary treatment of low-risk patients. In the UK, from April 2009 the Quality and Outcomes Framework will include an indicator related to proteinuria testing in patients with CKD.
However, there are a number of problems that require addressing:
There is no clear agreement among published guidelines on the threshold concentration or rate of loss that defines clinically significant proteinuria. There is no clear agreement among published guidelines as to whether proteinuria should be defined in terms of albumin or total protein loss, with a different approach being used to stratify diabetic and non-diabetic nephropathy. Estimates of total protein in urine differ between laboratories and some laboratories have abandoned total protein measurement in favour of albumin. Reagent strip (‘dipstick’) analysis continues to be recommended by some guidelines as the front-line test, despite its potential for missed diagnoses, lack of demonstrable clinical advantage or cost-effectiveness.
This review will consider the above issues. There is a debate regarding which sample is the most appropriate for proteinuria detection. The 24-h collection is typically regarded as the reference procedure and other sample types (overnight, random and early morning urine) have been compared with this. A significant evidence base supports the use of protein-to-creatinine ratio (PCR) on random or early morning ‘spot’ samples as a convenient and suitable alternative to the 24-h collection:
19–27
this has been endorsed in the Renal NSF for England. Similarly, a body of literature supports the use of albumin-to-creatinine ratio (ACR) as a suitable alternative to a timed measurement of urine albumin loss.
28–31
Therefore, this review will not consider this aspect of proteinuria testing but will focus instead on how, rather than whether, spot urine samples should be tested for proteinuria.
Definition of proteinuria
There is no consistent definition of proteinuria (Table 1). This is acknowledged in the Caring for Australasians with Renal Impairment (CARI) guidelines, 32 where it is stated that the cut-off for abnormal varies between 150 and 300 mg/24 h, depending on the laboratory. An upper limit of normal loss of 150 mg/24 h is equivalent to a urinary PCR of 15 mg/mmol (given an average daily creatinine excretion of 10 mmol) (Table 2). Approximately 50% of the protein normally lost in the urine is Tamm–Horsfall glycoprotein (THG), derived from distal tubular cells. 33 In health, relatively small amounts of albumin (<30 mg/24 h) are lost in the urine. Because of this, and additionally because total protein assays are imprecise at low concentrations, relatively large increases in urine albumin loss can occur without causing a significant measurable increase in urinary total protein loss.
Summary comparison between major guideline recommendations with respect to proteinuria detection
ACR = albumin-to-creatinine ratio; CARI = Caring for Australasians with Renal Impairment; CKD = chronic kidney disease; KDIGO = Kidney Disease Improving Global Outcomes; NICE = National Institute for Health and Clinical Excellence; NKF-KDOQI = National Kidney Foundation-Kidney Disease Outcomes Quality Initiative; PCR = protein-to-creatinine ratio; SIGN = Scottish Intercollegiate Guidelines Network
Expressions of urinary protein concentration and their approximate equivalents and clinical correlates
*It should be noted that there are a variety of urine reagent strips available on the market and each manufacturer's device can give a range of semi-quantitative results. The results from manufacturer A are not freely interchangeable with the results from manufacturer B, although there are some common categories. The nomenclature employed by different manufacturers varies. For example: both Roche Diagnostics Ltd and Siemens have a ‘negative’ category, but in addition Siemens have a ‘trace’ category whereas Roche does not. Therefore, it is only possible to report a ‘trace’ result if using a Siemens' device. A level of 0.3 g/L is called ‘+’ by Siemens, but ‘1+’ by Roche. Though Siemens' ‘++’ and Roche's ‘2+’ both equate to 1 g/L, Siemens' ‘+++’ equates to 3 g/L while Roche's ‘3+’ equates to 5 g/L. Siemens has an additional category of ‘++++’ (>20 g/L)
The table assumes an average creatinine excretion of 10 mmol/d and an average urine volume of 1.5 L/d. N.B., men and women have different thresholds for the diagnosis of microalbuminuria as a consequence of the lower urinary creatinine excretion in women.
Proteinuria is commonly detected at the point of care using urine reagent strip devices (‘dipsticks’), and ‘clinical’ proteinuria has sometimes been defined as equivalent to a colour change of ‘ + ’ or greater on the relevant pad on the strip. This equates to approximately 300 mg/L of total protein or a PCR of 50 mg/mmol, or a protein loss of 500 mg/24 h (assuming an average daily urine volume of 1.5 L).
Consistent with this, the UK CKD Guidelines 1 defined proteinuria as a PCR ≥45 mg/mmol but suggested that, in the absence of concomitant haematuria, proteinuria should not act as a trigger for active intervention until the ratio exceeds 100 mg/mmol. The Scottish Intercollegiate Guidelines Network, 34 the UK Consensus Conference 35 and the Wales Renal NSF 17 have defined proteinuria as a PCR of ≥100 mg/mmol, approximately equivalent to a loss of 1000 mg/24 h. The National Institute for Health and Clinical Excellence (NICE) CKD Guideline defines proteinuria as a PCR ≥50 mg/mmol or an ACR ≥30 mg/mmol (approximately equivalent to a total protein loss of 500 mg/24 h or an albumin loss of 300 mg/24 h). 36 Both the Scottish Intercollegiate Guidelines Network (SIGN) and NICE guidelines recommend that the classification of CKD should be extended to include a suffix ‘p’ to identify patients with proteinuria at any stage of kidney disease, acknowledging the importance of proteinuria as a risk factor. North American guidelines define proteinuria as a PCR >23 mg/mmol. 37,38 In the setting of pre-eclampsia, significant proteinuria is defined as ≥300 mg/24 h. 39
Among patients with diabetes, the classification of diabetic nephropathy has been based upon urinary albumin loss (commonly expressed as an ACR). In contrast to urinary total protein loss, definitions of normo-, micro- and macroalbuminria are reasonably consistent across international guidelines, allowing for slight differences in units of expression. a In the UK, patients are categorized as normoalbuminuric (≤2.5 mg/mmol males and ≤3.5 mg/mmol in females), microalbuminuric (>2.5/3.5–29 mg/mmol) and macroalbuminuric or proteinuric (≥30 mg/mmol) (Table 2). 36,40
The Kidney Disease Improving Global Outcomes (KDIGO) classification of CKD is clear in that it requires urinary albumin measurement as a marker of kidney damage to facilitate diagnosis of stage 1 and 2 CKD, with a diagnostic threshold value of 3.4 mg/mmol. 41 In other words, the presence of low-level albuminuria (‘microalbuminuria’) in an individual with a GFR ≥60 mL/min/1.73 m2 is indicative of CKD irrespective of whether diabetes mellitus is present or not. This classification was adopted by the English Renal NSF 16 and formed part of the scope for the NICE CKD guidelines. 36
Are reagent strip devices suitable for proteinuria detection?
Reagent strip devices for proteinuria detection have been in use for more than 50 years. Although purporting to measure total protein, the reagent pad is most sensitive to albumin and less sensitive to globulins, Bence Jones protein, THG and haemoglobin. 42–44 Indeed, somewhat confusingly, one commercial application of this principle has been manufactured as Albustix™, although the chemical principle underlying this test is identical to those devices that claim to measure ‘protein’. 42 Data from the United Kingdom National External Quality Assessment Scheme would indicate that single analyte ‘Albustix’ reagent strips are not in common use, although the eight and 10 analyte devices (‘Multistix’) including the analyte ‘protein’ are. There is evidence that strips from different manufacturers perform differently at the cut-off concentration of 300 mg/L and degrees of ‘plus-ness’ between different manufacturers do not always correspond to the same nominal concentration of protein in urine (Table 2).
Protein concentration in urine clearly depends on hydration (i.e. how concentrated the urine is). Urine of high specific gravity may therefore give a colour change in the positive range of a reagent strip device even though protein loss remains normal and vice versa. False-positive results may occur if the urine is alkalinized (e.g. due to urinary tract infection) or in the presence of quaternary ammonium compounds that alter the pH of the urine. The performance of reagent strips is operator dependent 45 and affected by the presence of coloured compounds such as bilirubin and certain drugs (e.g. ciprofloxacin, quinine and chloroquine). 46 An evaluation of two commercial reagent strips concluded that these devices could reliably distinguish between urinary protein concentrations of <200 and >3000 mg/L: greater analytical discrimination could only be achieved by laboratory analysis. 44
Several studies have compared the diagnostic accuracy of reagent strip testing with laboratory estimation of 24-h urinary total protein loss. Ralston et al. 21 observed poor specificity for reagent strip analysis in detecting protein loss of 300 mg/24 h in a rheumatology outpatient population. A pooled analysis of six studies undertaken in obstetric patients reported positive and negative likelihood ratios for ‘ + ’ protein or greater on reagent strip analysis for predicting 300 mg/24 h proteinuria as 0.6 (95% CI 0.45–0.8) and 3.48 (1.66–7.27), respectively. 47 This suggests that reagent strips are not good at either ruling in or ruling out significant proteinuria. SIGN concluded that urine dipstick testing cannot reliably be used to diagnose the presence or absence of proteinuria. 34 Guidelines from NICE similarly guard against the use of reagent strips to detect proteinuria, unless they are capable of specifically measuring albumin at low (i.e. microalbuminuric) concentrations. 36
An evidence-based systematic review undertaken by the US National Academy of Clinical Biochemistry (NACB) recommended against routine screening for proteinuria with reagent strip analysis. 48 They found no evidence that the use of urine reagent strip testing for proteinuria at the point of care improved patient outcomes with significant evidence of a high false-negative rate and poor negative predictive value compared with laboratory testing. Clinical guidelines developed by the CARI group reached similar conclusions. 32 Unsurprisingly, a positive reagent strip result suggests a poorer renal prognosis. 5–7 However, it is acknowledged by the National Kidney Foundation Kidney Disease Outcomes Quality Initiative (NKF-KDOQI), NACB, SIGN and NICE that the major risk with these devices is poor sensitivity for disease, failing to detect some forms of kidney disease in the early stages and giving false-negative results in cases where the urine is dilute. 34,36,38,48
Guidelines that incorporate reagent strip testing commonly suggest follow-up laboratory testing of positive results, but do not state whether a negative reagent strip result is sufficient to exclude significant disease. 1 The NKF-KDOQI guidelines suggest that negative reagent strip tests should be supplemented with laboratory protein measurements when the result is ‘inconsistent with the clinical picture’. 38 Given that kidney disease is commonly asymptomatic until it is advanced, this is somewhat unhelpful. The NKF-KDOQI guidelines state that monitoring of patients with known proteinuria should be undertaken using laboratory testing.
The traditional approach to proteinuria screening in which reagent strip testing has primacy appears to risk missing significant disease. The cost- and clinical-effectiveness of such an approach (i.e. reagent strip testing followed by laboratory measurement) compared with an approach in which samples are submitted directly to the laboratory (for either albumin or protein measurement) has recently been evaluated in a NICE health economics model. 36 The model favoured abandoning the use of reagent strips for identification of proteinuria.
The UKNEQAS surveys the quality of reagent strip devices. Although several types of device are in use, the predominant method group (87 of 135 participants) is that manufactured by Siemens (Siemens plc, Camberley, Surrey, UK). A recently distributed sample (Figure 1) had an all-method mean total protein concentration of 0.28 g/L: 8% of Siemens users classified this sample as negative, 30% as ‘trace’, 56% as + and 6% as ++ or greater. This inconsistency in response (and of potential ensuing clinical management) is of concern – while half of the patients presenting with this sample will have been deemed to demonstrate clinical proteinuria with likely clinical and laboratory follow-up, one-third would have been noted as having trace proteinuria, generally a dismissible finding. At an all-method mean concentration of 0.90 g/L (Figure 2), 63% of Siemens participants identified the sample as ++. However, 31% of participants recorded this sample as +++ (equivalent to approximately 3 g/L), 5% as + and 1% as ++++, further illustrating the semi-quantitative nature of these devices.
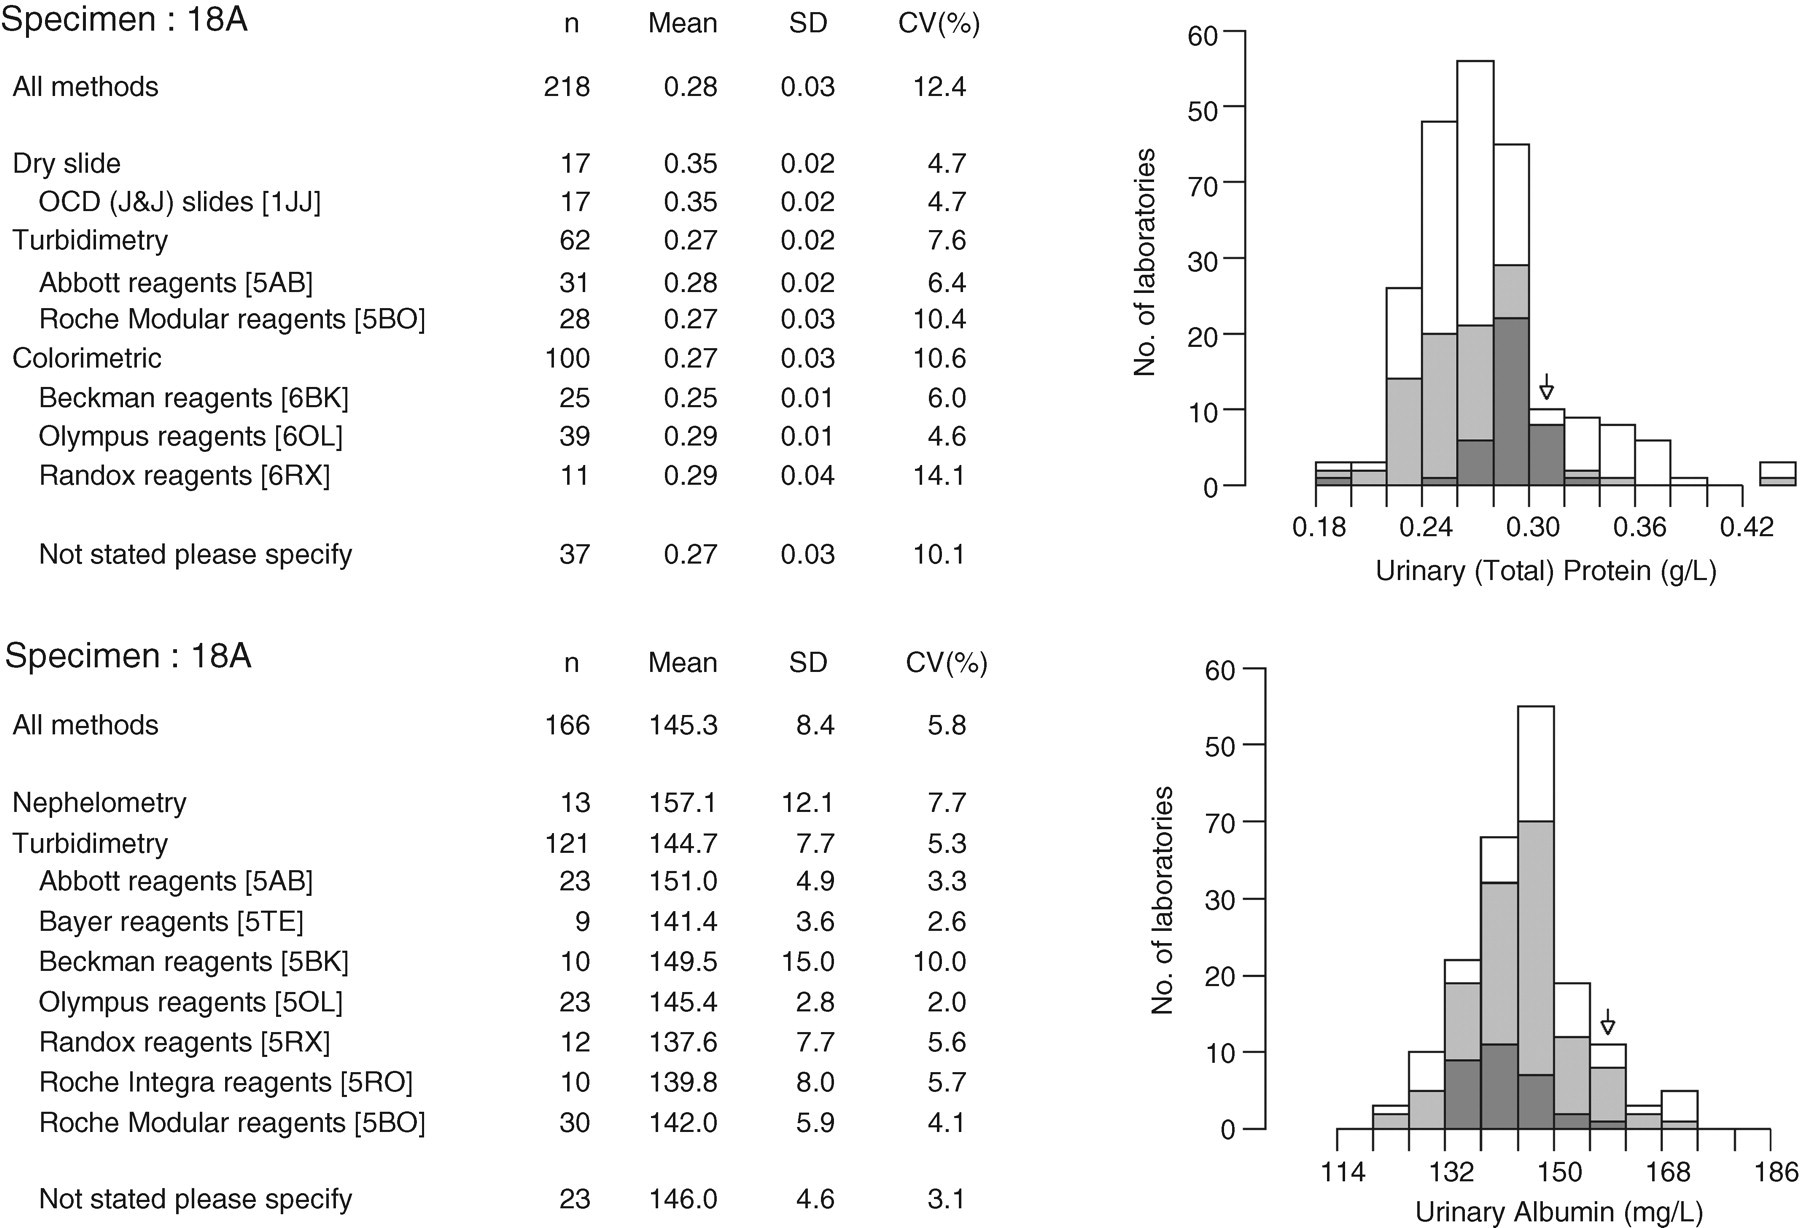
Data from the United Kingdom National External Quality Assessment Scheme (UKNEQAS, May 2007) illustrating typical between-laboratory agreement of urinary total protein (upper panel) and albumin (lower panel) assays in a urine sample with a total protein concentration approximately equivalent to ‘ + ’ on a dipstick. Performance of dipstick analysis in this distribution is described in the text
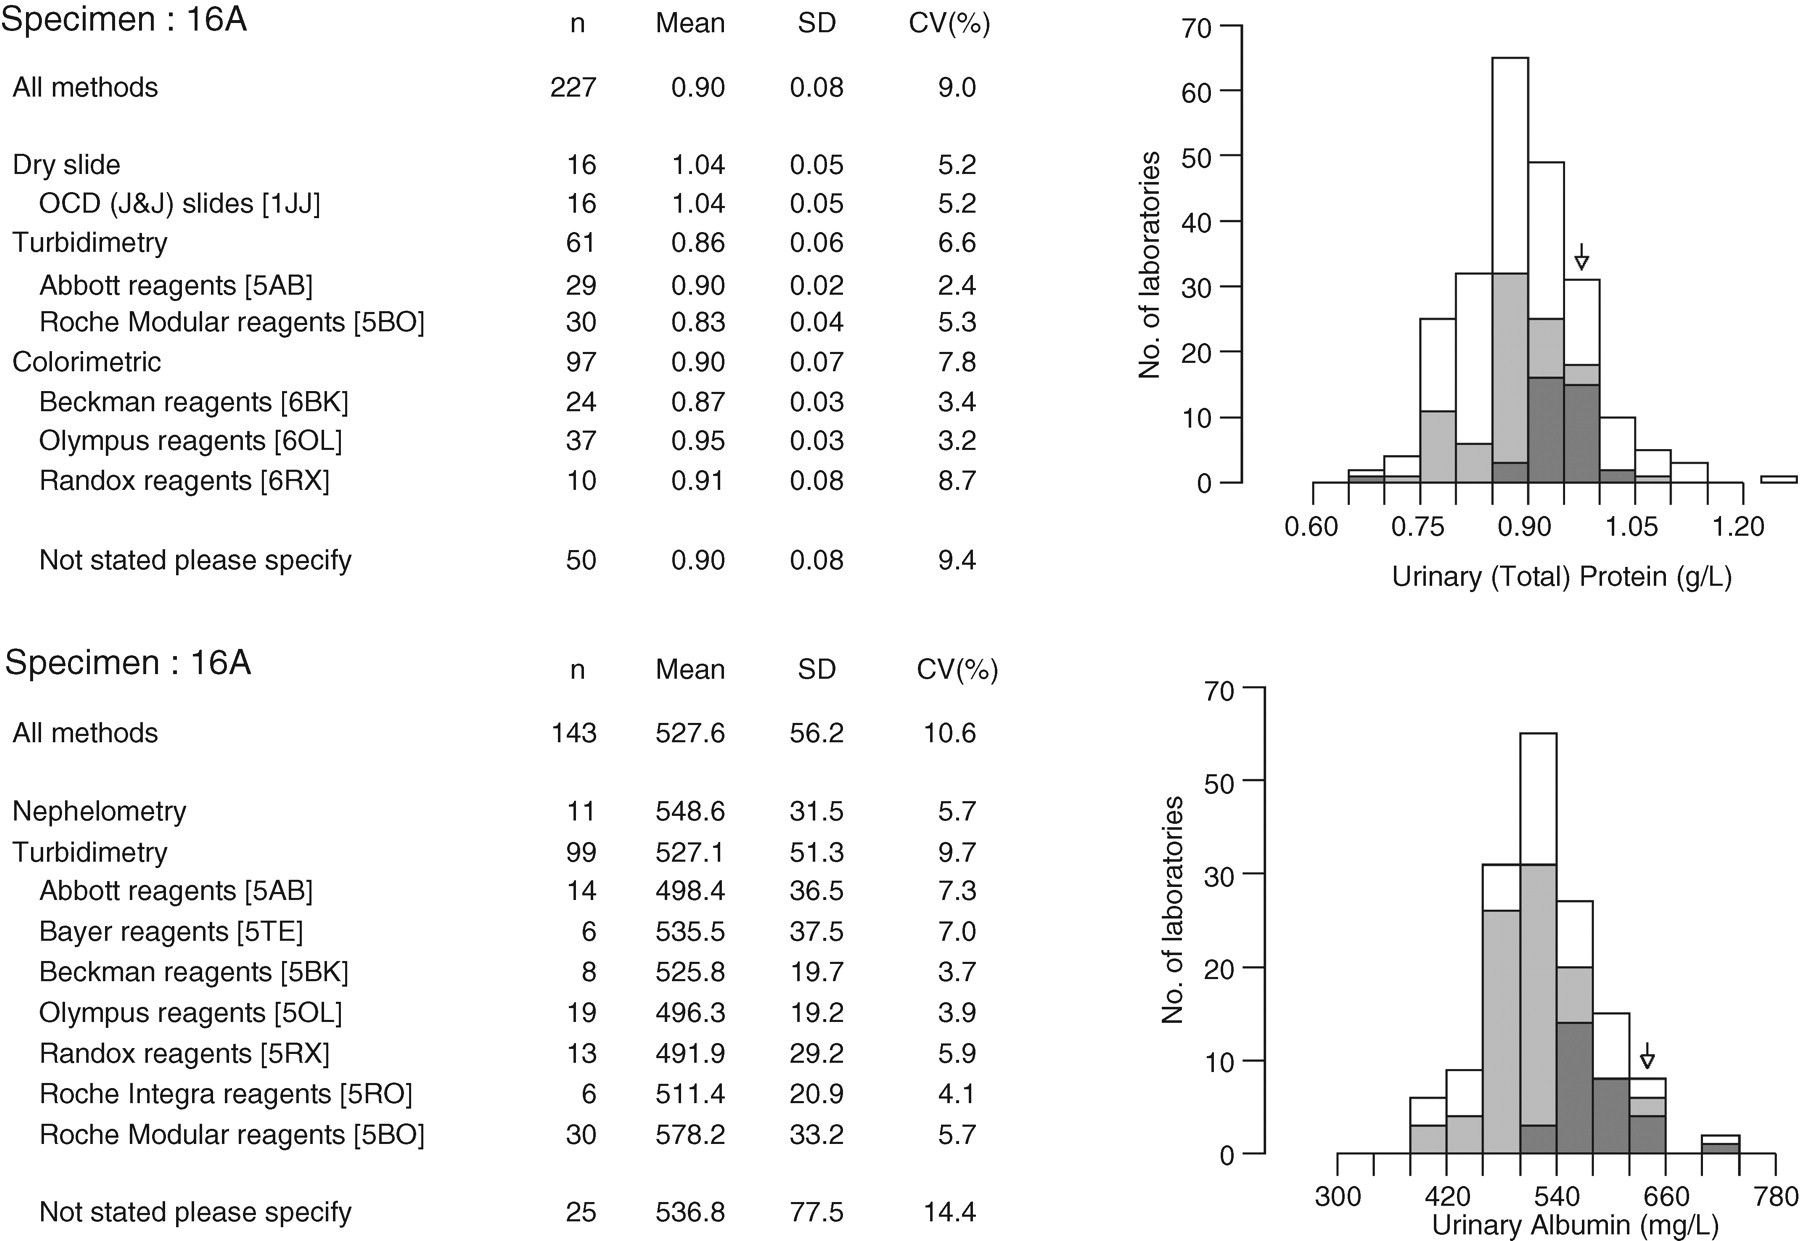
Data from the United Kingdom National External Quality Assessment Scheme (UKNEQAS, March 2007) illustrating typical between-laboratory agreement of urinary total protein (upper panel) and albumin (lower panel) assays in a urine sample with a total protein concentration approximately equivalent to ‘ + +’ on a dipstick, or 1 g/L. Performance of dipstick analysis in this distribution is described in the text
Recently, automated devices capable of reading the colour changes of reagent strips using reflectance spectrometry have become available. These reduce interoperator variability and improve diagnostic accuracy. 45,49,50 Agarwal et al. 51 evaluated an automated strip reader (Clinitek 200 +, Siemens plc, Camberley, Surrey, UK) in an outpatient renal clinic setting. They found that sensitivity and specificity for detecting ≥1 g/24 h proteinuria (defined as a laboratory estimated PCR > 1130 mg/mmol) was maximized when the reagent strip result was +++ or greater. A result of ++ had 98% sensitivity but only 66% specificity for identifying >1 g/24 h proteinuria. A creatinine test pad (using the peroxidase-like activity of transition metal creatinine complexes) has been added to some reagent strip systems to enable a PCR to be reported and so reduce the intraindividual variation seen with random urine collections. An evaluation of one such device (Multistix PRO® 10LS, Siemens plc, Camberley, Surrey, UK) read semi-quantitatively on the Clinitek Status® automated strip reader in a renal outpatient setting concluded that the test was suitable for ruling out significant proteinuria (>0.3 g/24 h). 52
Reagent strip point-of-care testing devices capable of measuring low concentrations of albumin (i.e. in the ‘microalbuminuric’ range) have also become available. For example, the Clinitek Microalbumin reagent strip read on a Clinitek Status analyser (both Siemens plc, Camberley, Surrey, UK) produces semi-quantitative ACR results whereas the DCA 2000+ device (Siemens plc, Camberley, Surrey, UK) is capable of reporting a fully quantitative ACR result. We are unaware of quality assessment scheme data relating to these devices. However, Medicines and Healthcare products Regulatory Agency reports 53,54 and other published evaluations 55,56 have demonstrated reasonable analytical performance. Waugh et al. 50 have reported excellent diagnostic performance in the detection of significant proteinuria in hypertensive pregnancy using this system and Guy et al. 57 have confirmed that both the Clinitek Microalbumin and DCA 2000+ devices are capable of ruling out significant albuminuria (>30 mg/24 h) in a CKD outpatient population. Recently, Graziani et al. have confirmed acceptable performance of the Clinitek Microalbumin device for ruling out albuminuria (>3.4 mg/mmol) in a general population study. 58 While all of these studies have been somewhat limited in size, they demonstrate the potential of these devices to play a significant role in the care pathway of patients suspected of having CKD. Economic evaluations of these systems have not been undertaken.
Should urinary albumin or total protein be the test of choice to detect proteinuria?
Methodology and standardization
Many laboratories in the UK measure urinary total protein for the detection of non-diabetic kidney disease, reserving urinary albumin for the detection of diabetic nephropathy. Some, although a minority, of the laboratories in England have abandoned urinary total protein measurement completely in favour of albumin. Of the laboratories registered in the UKNEQAS urine chemistry scheme (December 2007), 221 participated for both urinary albumin and total protein, while 44 submitted data only for urinary albumin and 20 for total protein alone.
Total protein measurement is more difficult in urine than in serum. The concentration of urinary protein is normally low (100–200 mg/L); large sample-to-sample variation in the amount and composition of proteins is common; the concentration of non-protein interfering substances is high relative to the protein concentration and very variable; and the inorganic ion content is high. All these factors affect the precision and accuracy of the various methods.
Total protein in urine has been measured by chemical (e.g. biuret and Folin–Lowry reactions), turbidimetric and dye-binding (colorimetric) methods. Most laboratories in the UK currently use either turbidimetry or colorimetry (Figures 1 and 2). In turbidimetry, a protein precipitant, such as trichloroacetic acid, benzethonium chloride or ammonium chloride, is added to the sample, and the denatured protein precipitates in a fine suspension that is quantified turbidimetrically. The turbidity varies appreciably with the chemical nature of the acid precipitant, the type of protein, the concentration of the acid, the temperature, and the time elapsed between addition of the acid and turbidimetric measurement. Dye-binding methods include ponceau-S, 59 Coomassie Brilliant Blue G-250, 60 pyrogallol red molybdate 61 and pyrocatechol violet-molybdate, which is used in dry-slide applications.
As with urine reagent strip analysis, turbidimetric and dye-binding methods do not give equal analytical specificity and sensitivity for all proteins. Most approaches tend to react more strongly with albumin than with globulin and other non-albumin proteins, 62–64 although incorporating sodium dodecyl sulphate in pyrogallol red reagent is claimed to rectify this issue. 65 Significant interferences include aminoglycosides, 66 invisible haematuria 67 and infused modified gelatin solutions used as plasma expanders, 68 all of which falsely increase urine protein concentrations when measured by pyrogallol red methods.
There is no Joint Committee for Traceability in Laboratory Medicine (JCTLM) listed reference measurement procedure and no standardized reference material for urinary total protein. The variety of methods in use means that there is inevitably significant between-laboratory variation. This variation tends to diminish at higher concentrations of urinary total protein, presumably in part as albumin becomes the predominant protein. In addition to the methodological differences between the various protein assays, calibration has been found to be one of the major determinants of inter-method variability. 69–71 Since a variable mixture of proteins is measured, it is difficult to define a standardized reference material.
Urinary albumin is also measured by most diagnostic laboratories, predominantly (approximately 90% in the UK) using turbidimetric approaches (Figures 1 and 2). There is also currently no JCTLM listed reference measurement procedure or standardized reference material for urine albumin, although the National Kidney Disease Education Program and the International Federation of Clinical Chemistry and Laboratory Medicine have recently established a joint committee to address these issues. 72,73 Most commonly, urinary albumin assays are standardized against a serum-based calibrant (CRM 470) distributed by the Institute for Reference Materials and Measurements of the European Commission, as has been recommended by KDIGO. 41 Although, intuitively, these issues should be more easily addressed than those for total protein measurement, albumin is known to undergo polymerization and fragmentation on storage, when freeze-thawed and when lyophilized. 72,74 Recent data also suggest that a significant proportion of albumin present in urine may be non-immunoreactive, 75–78 although this finding has been questioned. 79,80
Commercial urinary albumin assays commonly have analytical ranges that are exceeded at albumin concentrations greater than approximately 500 mg/L. A concern is therefore that using this test to identify CKD in the ‘at-risk’ population will generate many samples exceeding the analytical range, resulting in manual or automatic dilutions of the sample with attendant increases in cost. In one district general hospital where only urinary albumin measurement is offered, <6% of samples received require an automatic (‘on board’) dilution with manual dilutions rarely being undertaken (Dr G Lawson, personal communication). This laboratory uses a turbidimetric assay on a Roche Modular system with a linear range up to 400 mg/L. A further concern is the risk of the antigen excess (‘prozone’) phenomenon, in which samples with very high albumin concentrations may be falsely reported as low or normal using some immunoassay approaches. Data from UKNEQAS, using manipulated samples, suggest that this problem varies greatly between analytical systems but that, overall, approximately 10% of participating laboratories may report a falsely low result in a sample containing a high concentration (e.g. approximately 3 g/L) of albumin. It is not known how significant this problem is likely to be in the non-diabetic population being tested for CKD.
Quality comparisons
Because a single protein is being measured using a specific immunoassay approach, analytical performance of albumin assays tends to be superior to that of total protein assays, at least at lower concentrations. Previous publications have drawn on quality assessment data to illustrate the poor performance of total protein assays. A study by Chambers et al. 81 in 1989 found that 20% of participants in the UKNEQAS scheme reported a false-positive result for proteinuria in a normal urine sample with a total protein (exclusively albumin) concentration measured by laser nephelometry of <50 mg/L. The same group also demonstrated the poor between-laboratory precision that existed in urinary total protein measurement. 70 The worst-performing, and also the commonest, assays at that time were based on precipitation with sulphosalicylic acid. These assays are no longer in common use and the quality of urinary total protein measurement has improved to some extent, but still remains suboptimal. Figures 1 and 2 illustrate comparative performance data from the UKNEQAS. Figure 1 (upper panel) shows the results of data from 218, predominantly UK, laboratories participating in the urinary total protein scheme. The mean concentration is 280 mg/L (0.28 g/L), almost equivalent to + using a reagent strip device. A variety of methods are in use and there is a between-laboratory coefficient of variation (CV) of 12.4%. A patient submitting this sample to a local laboratory could therefore get a result between approximately 0.20 and 0.40 g/L. Approximately, this translates into PCRs between 30 and 60 mg/mmol, i.e. either side of the NICE 50 mg/mmol threshold. This situation can be compared with that for urinary albumin (Figure 1, lower panel). It can be seen that nearly all laboratories are using specific antibody-based turbidimetric methods. The mean result is 145 mg/L (0.145 g/L) and between-laboratory agreement is better than that for total protein, with a CV of 5.7%. At higher concentrations the between-laboratory variation of total protein methods improves and equals that of urinary albumin measurement (Figure 2).
Such data are produced on a monthly basis by UKNEQAS at a variety of protein/albumin concentrations and clear patterns are demonstrable. At lower concentrations (i.e. the sort of concentrations necessary for establishing the presence of microalbuminuria in patients with diabetes), albumin assays are clearly superior to total protein assays (Figure 3). UKNEQAS also present data in the form of ‘penalty box plots’ (Figure 4, see legend for explanation). Specimens in the UKNEQAS are of necessity manipulated to obtain protein concentrations at representative levels (for example spiked with human albumin or with human serum), and may not completely reflect the picture in unadulterated urine samples. However, it seems relatively clear that urinary albumin assay performance is superior to that of total protein. The questions are whether we need a better assay than urinary total protein and whether the health economy is willing to pay for it? A further question is whether the evidence base in total protein loss can be translated into urinary albumin equivalents?
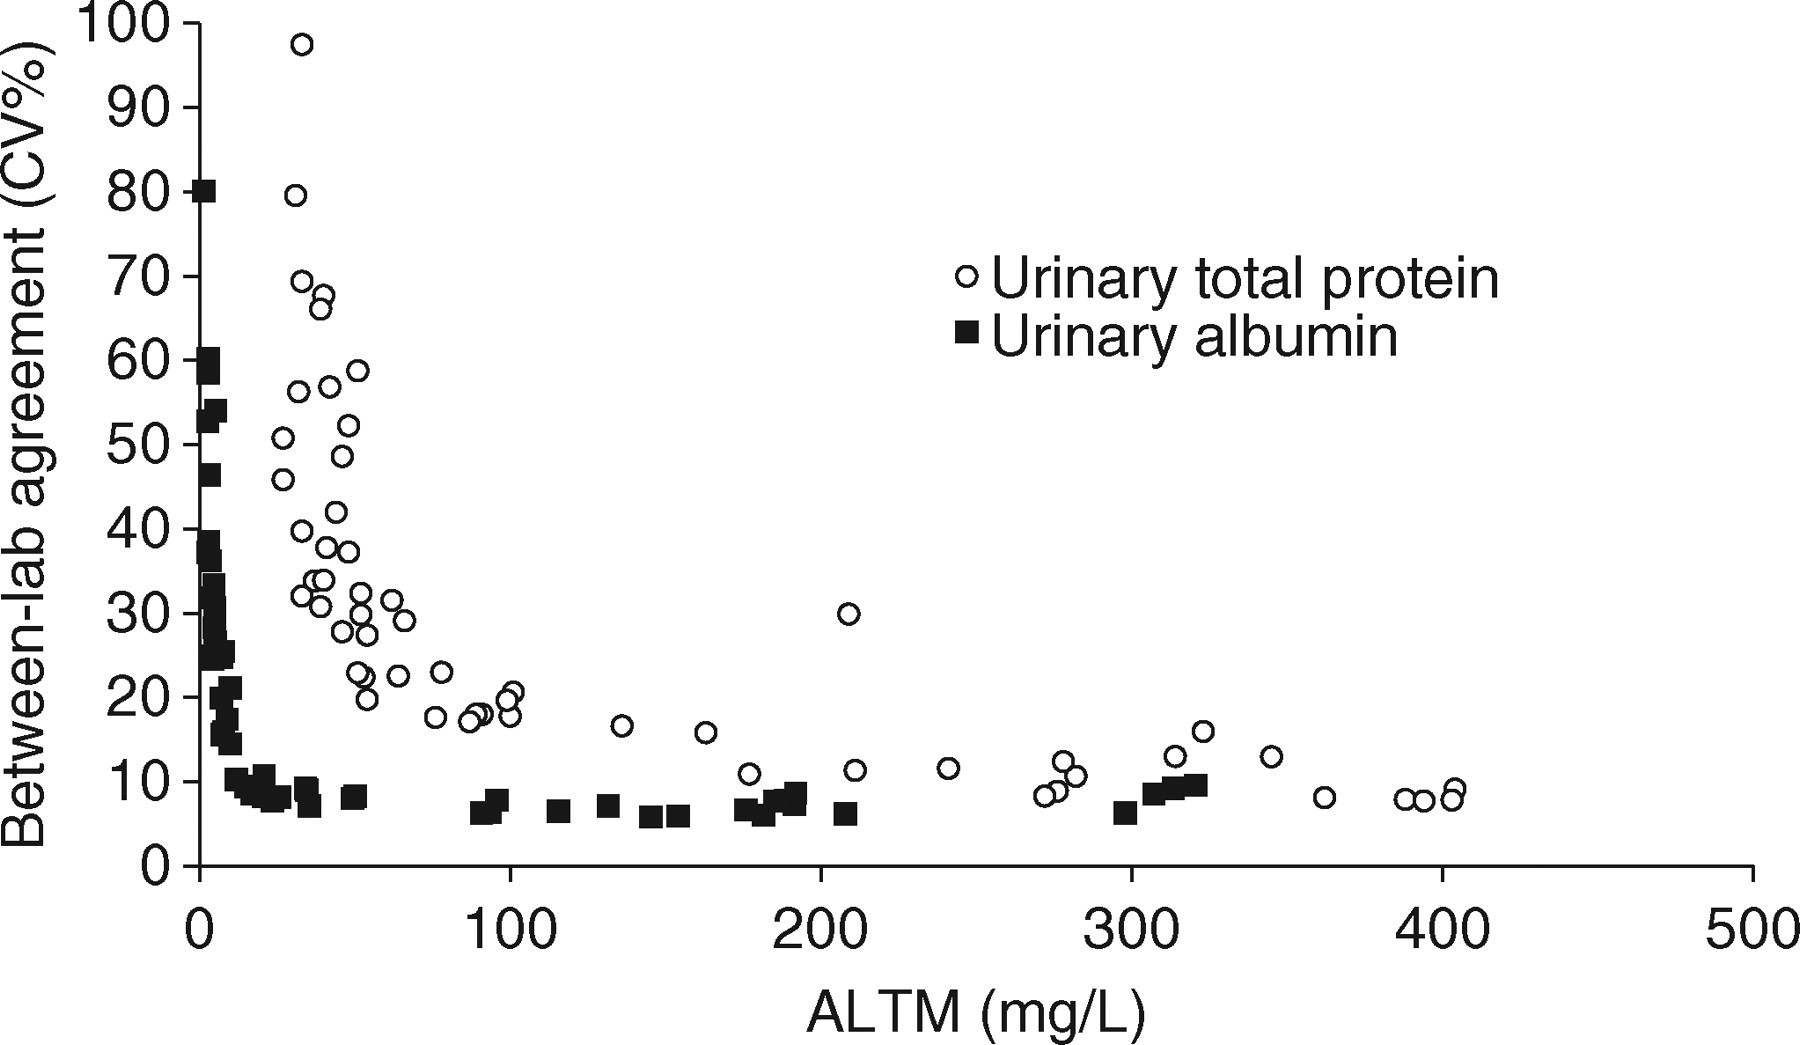
Between-laboratory agreement for urinary albumin and total protein in samples distributed in the first 21 distributions of the United Kingdom National External Quality Assessment Scheme scheme between November 2005 and August 2007 inclusive with protein concentrations below 500 mg/L
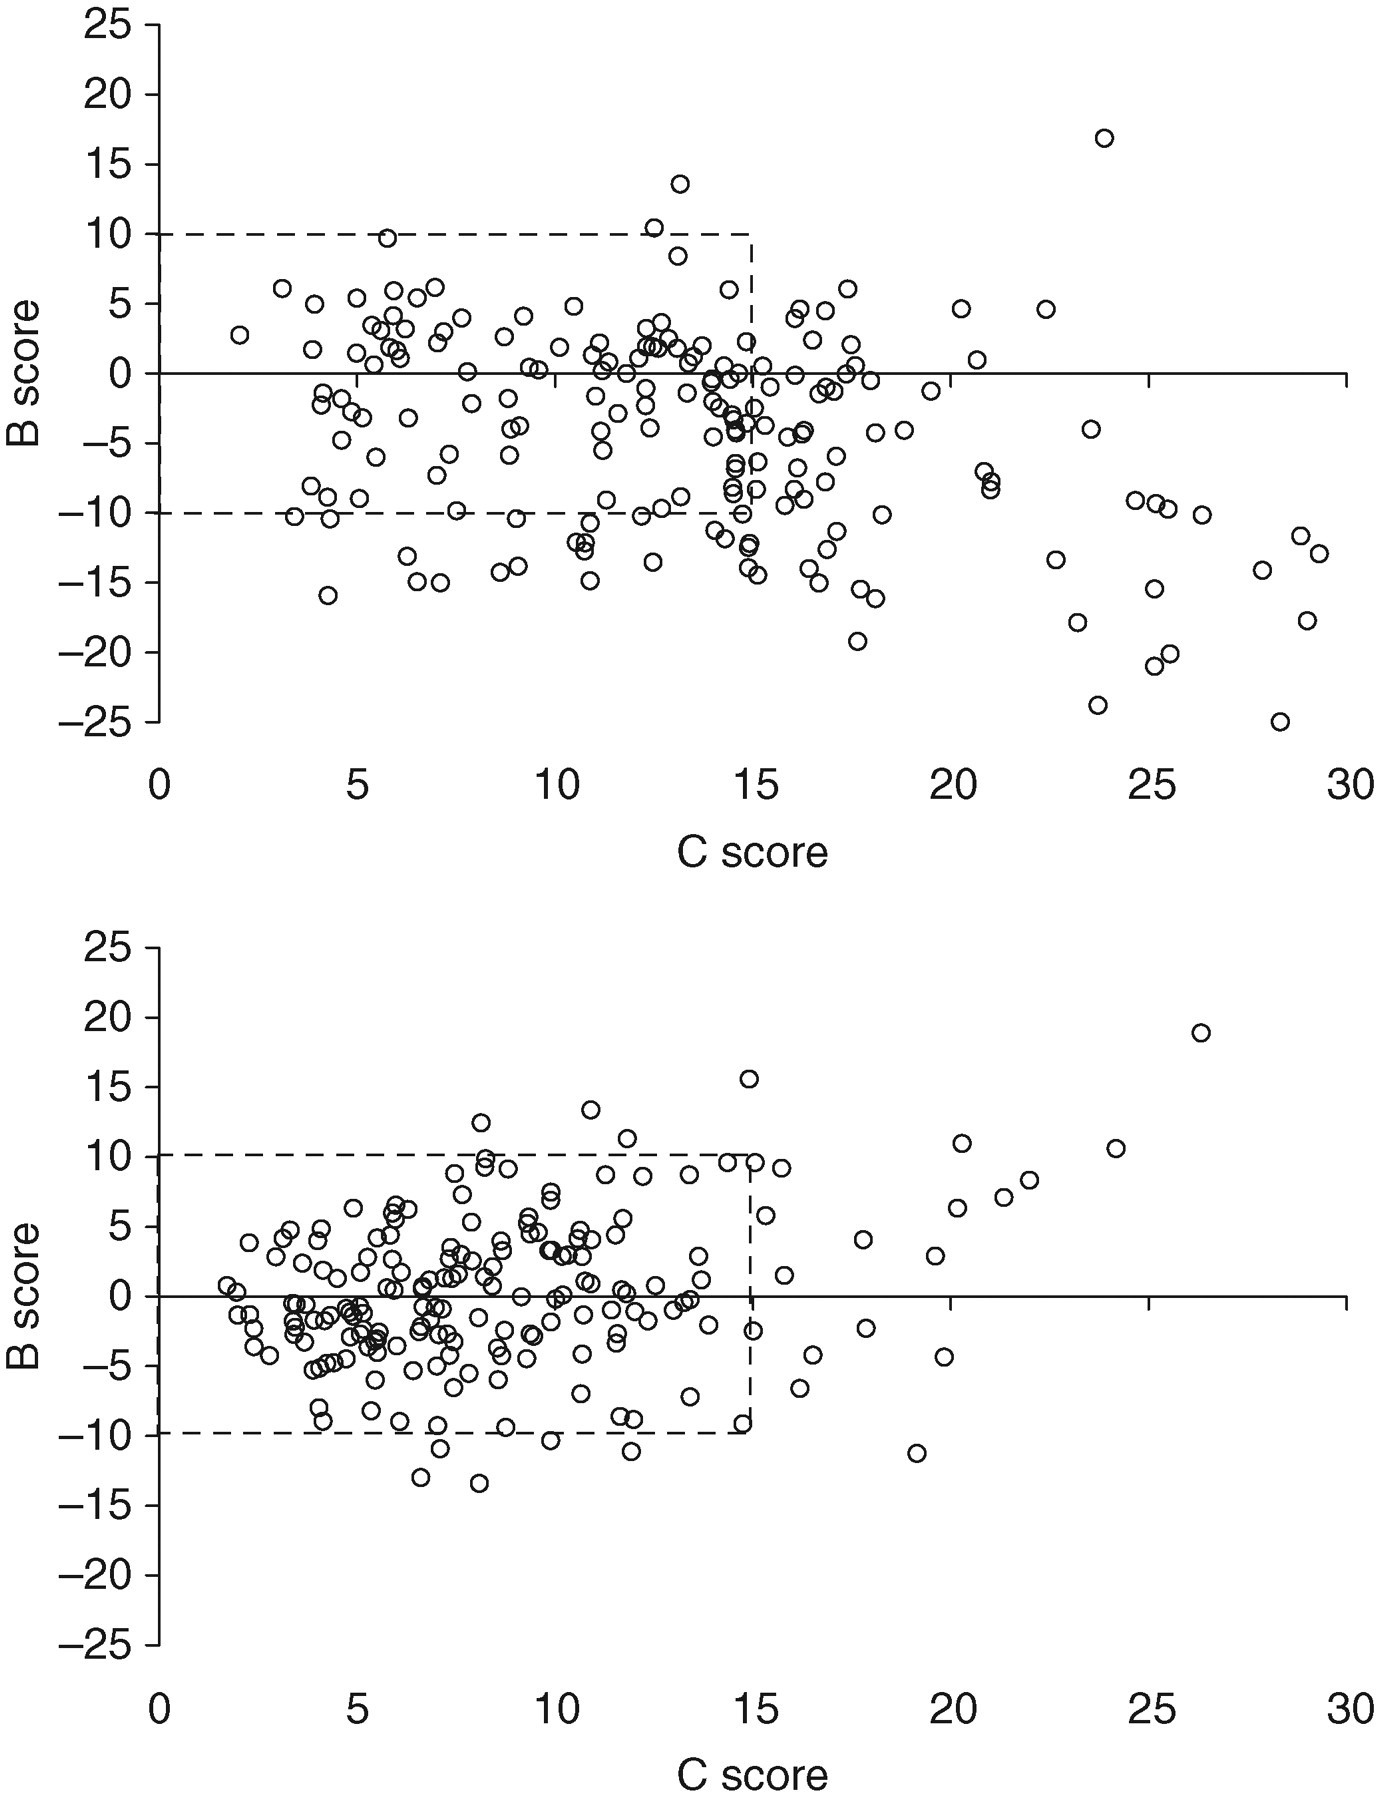
United Kingdom National External Quality Assessment Scheme ‘penalty box plot’ display for urinary total protein (upper panel) and albumin (lower panel) for samples distributed in the urine chemistry scheme at a ‘snapshot’ time point of August 2007, incorporating results from the current and previous five distributions, i.e. a total of six distributions covering all data between March 2007 to August 2007. Each laboratory's data are plotted as a single B (bias) and C (consistency) coordinate. B and C limits are arbitrarily set at ± 10% and 15%, respectively. The ideal position for a laboratory to be is at the origin; being situated outside the ‘penalty box’ is essentially poor performance
What is the clinical need in terms of sensitivity?
From the above, one can conclude that urinary albumin measurement is technically superior to total protein measurement. However, a problem is that previous studies of the natural history of treatment of kidney disease, and hence the current evidence base for management decisions, have used 24-h total protein loss to stratify patients rather than albumin. 4,5,8,82–85 A further confounder is that some studies have defined proteinuria using reagent strip technology, effectively (crudely) measuring albuminuria but reporting results in terms of total protein. 5 It is somewhat unclear at what point, in terms of urinary albumin or protein loss, nephrological management of a non-diabetic patient might change, i.e. when should nephrologists be interested in albuminuria?
It has been accepted for many years that total protein measurement is insufficiently sensitive to detect the onset of diabetic nephropathy and that urinary albumin must be used for this purpose. This is enshrined in many clinical practice guidelines, including those for type 1 and 2 diabetes produced by NICE. 40,86 There is strong evidence linking urinary albumin loss to cardiovascular mortality and kidney disease progression in diabetes. 87 There is also evidence that urinary albumin is a more sensitive test to enable detection of glomerular pathology associated with some other systemic diseases, including hypertension and systemic sclerosis. 88,89 In a methodological study of urines from patients attending renal transplant, general nephrology and medicine and obstetric clinics, Newman et al. 90 observed increased albumin concentrations (>25 mg/24 h) in 63% of samples with total protein concentrations <250 mg/24 h.
Microalbuminuria is also common among the non-diabetic population and there is strong evidence linking albuminuria to cardiovascular and non-cardiovascular mortality in non-diabetics. 10,91–93 Hillege et al. 91 observed microalbuminuria to be present in 7.2% of the adult general population of the town of Groningen in the Netherlands, and to be independently associated with age, hypertension, diabetes, smoking, previous myocardial infarction and stroke. Even after excluding individuals with diabetes and hypertension, the population prevalence was still 6.6%. Follow-up of this cohort demonstrated an independent dose–response relationship between urinary albumin concentration and both cardiovascular and non-cardiovascular death, 9 decline in GFR and requirement for renal replacement therapy. 94 The relationship with death was continuous, extending down to urinary albumin concentrations within the ‘normal’ range. A doubling of urinary albumin concentration was associated with a 1.29 higher risk of cardiovascular death and a 1.12 higher risk of non-cardiovascular death at all levels of albumin loss. 95 Individuals losing >30 mg/24 h albumin with GFR >60 mL/min/1.73 m2 (stage 1 and 2 CKD) were found to be at similar cardiovascular risk and risk of kidney disease progression to those with stage 3 CKD. Further, subdividing stage 3 CKD according to the presence or absence of albumin loss exceeding 30 mg/24 h was found to improve risk stratification. 10 In the Nordic–Diltiazem Study, microalbuminuria (detected in a morning urine sample using the Roche Micral test, Roche Diagnostics Ltd, West Sussex, UK) predicted cardiovascular events in a hypertensive population independently of renal function and other cardiovascular risk factors. 12 The Framingham Heart Study reports similar associations between albuminuria and cardiovascular events in non-hypertensive, non-diabetic individuals. 96 Two recently published longitudinal cohort studies looking at factors predictive of CKD (defined as GFR <60 mL/min/1.73 m2) both identified albuminuria as a significant factor after correction for multiple confounders. 13,14
The observational screening study of Iseki et al. 5 in a Japanese population confirmed that the risk of future ESRD was increased even at reagent strip ‘trace’ levels of proteinuria, although the absolute risk was not deemed to be significant unless ++ or more proteinuria was present. A 12-year follow-up population screening study of 460,000 Taiwanese individuals showed significant increases in all-cause mortality at all levels of GFR in the presence of a trace or + finding for protein on reagent strip compared with individuals with a negative reading. 97 A large meta-analysis of non-diabetic patients identified protein losses >2 g/24 h to be associated with the highest risk of kidney disease progression, but losses in excess of 1 g/24 h were also associated with increased progression in the presence of hypertension. 8
The epidemiological data above suggest that albumin rather than total protein measurement is required to identify those most at risk, and that lower levels of GFR and albuminuria are synergistic in terms of risk of adverse outcomes (renal and cardiovascular). However, there is currently little information concerning the risks and benefits of intervention, e.g. with angiotensin converting enzyme inhibitors (ACEIs) or angiotensin II receptor blockers, in microalbuminuric non-diabetic individuals. Asselbergs et al. 98 observed a non-significant (P = 0.1) trend towards a reduction in cardiovascular events among a predominantly non-diabetic microalbuminuric cohort treated with ACE inhibition. In a meta-analysis of 11 randomized trials (n = 1860), Kent et al. 99 observed that patients with non-diabetic kidney disease and daily total protein loss exceeding 500 mg benefited from treatment with ACEIs in terms of reduced kidney disease progression. Consequently, it can be argued that we need assays capable of accurately discriminating patients losing more than, from those losing less than, 500 mg/24 h total protein (approximately 300 mg/24 h albumin or an ACR of 30 mg/mmol) and possibly lower concentrations. Across a range of urines of differing concentration, such discrimination is probably most reliably made using urinary albumin rather than total protein measurement. While there is a lack of evidence relating to the benefits of treatment of non-diabetic patients with levels of proteinuria less than 500 mg/24 h (ACR <30 mg/mmol) with angiotensin–aldosterone system blockade, there is also no evidence to suggest that this benefit will be different from that seen in patients with diabetes.
What is the relative cost of urinary albumin versus total protein assays?
The costs of diagnostic tests vary, depending on local financial agreements between hospitals and suppliers. In East Kent Hospitals we estimate the reagent costs of an ACR and a PCR to be £0.50 and £0.20, respectively. In terms of reagent strip devices, Siemens Albustix cost £0.09 and Siemens Multistix 10SG £0.21. The staffing cost of undertaking a reagent strip test outside of the laboratory within the National Health Service is likely to be similar to that for laboratory staff, unless the clinician assessing the patient is undertaking the testing personally. NICE sampled a small random number of laboratories and estimated the average cost of an ACR to be £2.16 whereas a PCR cost £1.42. 36 It is acknowledged that increased use of ACR testing may reduce the unit cost on the basis of economies of scale. In relation to albumin-specific reagent strips, Incerti et al. 100 report a cost of approximately $4 for a Micral test II (Roche Diagnostics) compared with $2 for a laboratory ACR.
Is there a consistent relationship between urine albumin and total protein concentration?
A barrier to the implementation of albumin as a replacement for total protein is the lack of a constant numerical relationship between the two, which would enable clinicians to translate the existing evidence base (expressed as total protein) into an albuminuria equivalent. As described above, at normal levels of protein loss, albumin is a minor component of total urinary protein; as protein loss increases, albumin becomes the most significant single protein present. Further, at lower levels of proteinuria the proportional contribution of albumin tends to be far more variable than at higher levels. 101 The SIGN guidelines suggest that a rough conversion can be obtained by doubling the ACR to give the PCR when total protein loss is <1 g/24 h, while at protein losses exceeding this value ACR should be multiplied by 1.3 to give PCR. 34 In a cross-sectional population study of >10,000 adult Australians, the relative contribution of albumin at differing levels of protein loss (PCR) was 21% at <23 mg/mmol, 48% at 23–44 mg/mmol, 61% at 45–89 mg/mmol and 73% at >89 mg/mmol. 102 At 1130 mg/mmol (1 g/g, approximately equivalent to 1 g/24 h), the relationship approached unity. Albumin was measured using rate nephelometry and total protein using pyrogallol red. In the study of Newman et al. 90 , where albumin was measured by immunoturbidimetry and total protein using the biuret reaction, the relative contribution of albumin to total protein was 5% at <2.5 mg/mmol, 45% at 2.5–15 mg/mmol, 63% at 15–100 mg/mmol and 72% at >100 mg/mmol. Collier et al. 103 describe albumin (measured using immunoturbidimetry) as representing 22%, 34%, 51%, 65% and 72% of total protein (measured using benzethonium chloride) at negative, trace, +, ++ and +++ dipstick (Siemens Multistix SG) levels, respectively.
What about ‘missed’ tubular proteinuria?
A criticism that is commonly levelled against the suggestion that albumin should replace total protein as the front-line test for the detection of proteinuria is that non-albuminuric (effectively tubular and overflow) proteinuria will be missed. There is little evidence on which to judge the significance of this issue. In the AusDiab study, of those with proteinuria (2.4% of the population, defined as a PCR ≥23 mg/mmol) 92% had albuminuria (defined as an ACR ≥3.4 mg/mmol); 8% (0.2% of the general population) had an ACR within the reference range. 102 These individuals were less likely to have diabetes than those with both proteinuria and albuminuria, but no further information is available as to the nature of the proteinuria in these individuals or its likely significance. The authors speculate that these individuals could have had light chain proteinuria or interstitial nephropathies. Using albuminuria testing to identify proteinuria had a specificity of 95%. The negative predictive value was 99.8% and the positive predictive value was 32.4%. The authors concluded that testing for albuminuria rather than proteinuria was supported.
As discussed above, quite significant increases in urinary albumin loss have to occur before such an increase is detectable on the background of a total protein assay. The situation is even more extreme for tubular proteins which, in health, are present in urine at lower concentrations than albumin (e.g. normal daily losses of retinol binding protein, α1-microglobulin and β2-microglobulin are 0.08, 3.6 and 0.1 mg/24 h, respectively). 104 This problem will be exacerbated by the fact that the recognition of tubular proteins by some total protein assays is poor. 105
In disease states concentrations of tubular proteins, at least collectively, can reach levels detectable by total protein assays. For example, among patients with tubulo-interstitial disease but without renal insufficiency, median concentrations of α1-microglobulin were 37 mg/L, with concentrations up to 100 mg/L being observed: higher concentrations were seen in patients with renal insufficiency. 106 Among a group of patients with acute tubular necrosis requiring dialysis treatment, median α1-microglobulin concentration was 34.5 mg/mmol creatinine. 107 However, although tubular proteinuria is characterized by a relative increase in low molecular weight protein concentrations, generally albumin still remains a significant component of the total protein concentration. Indeed, it is thought that tubular disease results in an increase in albumin loss as a result of decreased tubular reabsorption of filtered albumin. For example, Gosling 104 estimates that when tubular absorption fails completely, β2-microglobin loss increases to 180 mg/24 h (approximately 1800-fold normal) but there will also be an increase in urinary albumin loss to about 360 mg/24 h (approximately 20-fold normal). In a series of patients with Dent's disease, a classical tubular disorder, 21 of the 23 patients demonstrating increased urinary α1-microglobulin and β2-microglobulin loss also had increased urinary albumin loss: those that did not had borderline increases in tubular protein losses that would almost certainly not have been detectable using a total protein measurement approach. 108 The authors comment that in those patients in whom proteinuria was marked (>1 g/24 h), urinary albumin loss was also markedly increased.
Possibly testing for proteinuria using a urine albumin approach may occasionally miss cases of tubular proteinuria, but the significance of this problem is probably overestimated and should be the subject of further research. Conversely, testing for tubular proteinuria using a total protein approach almost certainly has very poor sensitivity for detecting tubular disease. When an isolated tubular lesion is suspected, this is probably best investigated by measuring a specific tubular protein (e.g. α1-microglobulin) using an immunoassay approach.
What do the guidelines say?
The NKF Proteinuria, Albuminuria, Risk, Assessment, Detection, Elimination (PARADE) position statement endorsed testing for proteinuria using albumin in diabetic and hypertensive patients (and others at high risk of cardiovascular or renal disease) and using total protein (reagent strip followed by laboratory quantitation) when screening for proteinuria in other individuals. 37 An abnormal PCR was stated to be >23 mg/mmol and an abnormal ACR >3.4 mg/mmol. The NKF-KDOQI guidelines essentially adopt the PARADE approach (Table 1). 38 They state that in most cases screening with urine reagent strips is acceptable for detecting proteinuria, but that when screening adults at increased risk of CKD, albumin should be measured in a random sample using either an ACR or an albumin-specific reagent strip. Further, they recommend urinary albumin measurement in preference to total protein when detecting and monitoring proteinuria, because in the most common types of CKD (i.e. that due to diabetes, hypertension and glomerular disease) and in kidney transplant recipients it is both the most abundant protein in urine and a more sensitive marker of disease. They cite non-diabetic kidney disease in children as an exception, on the basis that loss of low molecular weight, non-albumin proteins may be important and use of total protein measurement is therefore preferred. As discussed above, we do not agree with this. NKF-KDOQI suggest that monitoring proteinuria using a PCR instead of an ACR may be acceptable when the ACR is significantly elevated (e.g. >55 mg/mmol). The CARI guidelines state that proteinuria in high-risk populations (patients with hypertension, vascular disease or a family history of renal disease) should be identified using an initial PCR, with an ACR being reserved for individuals with diabetes or a high ethnic risk of kidney disease (Aboriginal and Torres Strait Islanders). 32
The UK CKD Guidelines recommended that either albumin or total protein could be used to confirm proteinuria detected by a reagent strip, with urinary PCR and ACR ratios of >45 mg/mmol and >30 mg/mmol, respectively, being considered positive tests for proteinuria. 1 It was considered more cost-effective to use total protein assays for non-diabetic kidney disease, with albumin measurement being reserved for patients with diabetes. The Wales Renal NSF and SIGN guidelines adopt a similar position. 17,34 Conversely, as discussed earlier, KDIGO are clear that urinary albumin should be measured to detect kidney disease and that microalbuminuria should be considered the significant threshold in both diabetic and non-diabetic individuals. 41
In the NICE guideline, it was decided to recommend a single approach to urinary protein quantification for routine clinical practice in an attempt to introduce consistency and improve CKD detection. 36 From a CKD perspective the amount of albuminuria was considered the most relevant measurement. It was recommended that all people with diabetes, people without diabetes with a GFR < 60 mL/min/1.73 m2 and people with risk factors for CKD should have their urinary albumin loss quantified by an ACR. In a non-diabetic individual an ACR ≥30 mg/mmol (equivalent to a total protein loss of approximately 0.5 g/24 h) is deemed to be therapeutically significant proteinuria, whereas cut-offs for people with diabetes are consistent with other NICE guidelines. 40,86
Research recommendations
What is the nature of the proteinuria, and its clinical significance, in individuals who test negative for albuminuria but positive for proteinuria? Does the prozone phenomenon contribute to this observation?
What is the threshold level of albuminuria below which treatment with angiotensin–aldosterone system blockade in non-diabetic CKD patients no longer confers benefit in those with, and without, hypertension?
What is the value of newer reagent strip methodologies capable of quantifying an ACR?
Conclusions
Proteinuria detection identifies a subgroup of CKD patients that are at increased risk of progression both in terms of renal disease and in terms of cardiovascular comorbidity. Early identification of patients with significant proteinuria will prompt early referral and initiation of renal protective therapy. Such therapy will slow the rate of decline in the renal function of patients and either avoid or delay the need for dialysis with associated health economic benefits. Conversely, low-risk patients will be spared the anxiety and costs associated with a potentially unnecessary referral for a consultant nephrologist's opinion. However, it would appear to be critical that such risk stratification is based upon an agreed, consistent and relevant approach to detection and definition of proteinuria.
It is the opinion of the authors that reagent strip tests measuring total protein with no correction for urinary concentration should be abandoned in favour of quantitative laboratory measurements of proteinuria. More recently launched reagent strip devices capable of producing albumin or total protein results as a ratio to urinary creatinine require further evaluation to provide evidence that they have equivalent sensitivity and specificity to laboratory tests and are economically advantageous.
Laboratory tests purporting to measure total protein are commonly flawed, often being standardized against, and predominantly sensitive to, albumin, having poor precision at low concentrations, demonstrating poor between-laboratory agreement, being insensitive, non-specific and subject to a range of false-positive and false-negative problems. By contrast, urinary albumin measurement provides a quantitative, relatively standardized measurement of loss of the single most important protein in most nephropathies, albeit at increased cost. Urinary albumin measurement is widely accepted as the test of choice for the detection of diabetic nephropathy and is commonly requested by primary care physicians, while total protein measurement continues to be used by specialists investigating kidney disease. There is a need to reconcile these approaches. Increasingly, the initial detection and management of CKD is being undertaken by general practitioners and other non-nephrologists. The current dual system of proteinuria/albuminuria reporting is at the least confusing and to patients probably unfathomable.
While there are still problems with urinary albumin measurement, use of this marker as the front-line test for proteinuria detection appears to offer the best chance of improving the sensitivity, quality and consistency of approach to the early detection and management of kidney disease.
DECLARATIONS
Footnotes
a
USA guidelines express albuminuria or proteinuria as mg/g creatinine whereas other guidelines use mg/mmol creatinine. An approximate conversion factor of 0.1136 can be used to convert results in mg/g to mg/mmol (e.g. 200 mg/g = 23 mg/mmol, 30 mg/g = 3.4 mg/mmol).