
Abstract
Background
Circulating cell-free DNA (CFD) levels may be elevated in trauma, stroke, sepsis, pre-eclampsia and cancer. Owing to the complex and expensive methodology, detection of CFD has hitherto been confined to research laboratories. This study presents a simple, inexpensive and accurate test for CFD.
Methods
Using the commercial fluorescent SYBR® Gold stain, biological fluids were directly assayed for CFD without prior DNA extraction and amplification. Stain was added to the sample in 96-well plates (final stain dilution: 1:10,000) and fluorescence was read by a fluorometer (excitation wavelength 488 nm, emission wavelength 535 nm).
Results
The assay was validated with serum, whole blood, urine and supernatant of cell cultures. Specificity and linearity were demonstrated over a wide range of concentrations; the results correlated with the conventional quantitative polymerase chain reaction assay of β-globin (R 2 = 0.9987, P < 0.001). The assay was not affected by exposure of whole blood or serum to room temperature for four or 24 h, respectively. Intra and day-to-day coefficients of variation (16–4.8% and 31–8%, respectively; depending on DNA level) compared well with published data describing more work-intensive tests. The limit of quantitation (170 ng/mL) was below the mean DNA level in a cohort of normal individuals (471 [203] ng/mL). Finally, free DNA in supernatant of cell cultures after cell lysis accurately reflected cell number (R 2 = 0.974, P < 0.0001).
Conclusions
The direct SYBR® Gold assay proved to be an accurate and simple technique for measuring CFD in biological fluids.
Introduction
The diagnostic potential of measuring cell-free DNA (CFD) is becoming increasingly recognized as a tool in the management of patients in various dynamic clinical situations such as trauma, stroke, sepsis, pre-eclampsia and cancer. Reflecting cell necrosis and apoptosis, CFD can be used to assess the activity and severity of the disease. 1–5 Currently available methods for accurate measurement of serum CFD are work-intensive and expensive requiring DNA extraction, gel electrophoresis and realtime–polymerase chain reaction (PCR) amplification with specific primers. Consequently, CFD measurements are not used during routine patient management.
Ultraviolet (UV) absorbance spectroscopy is the traditional method for quantifying DNA. This method is accurate but not applicable to biological samples like serum because of interference from organic solutes that absorb light at a similar wavelength as DNA. Alternatively, DNA may be extracted from serum and quantified using specific dyes by colorimetry or emission fluorometry. This method has been applied in some research laboratories using DNA DipStick and PicoGreen® (Invitrogen, Paisley, UK), respectively, the latter being one of the commercially available fluorochromes replacing the more toxic and less sensitive ethidium bromide. 6
In the present study, a convenient and accurate DNA assay applied directly to biological samples was validated. This assay uses the fluorochrome SYBR® Gold, 7 which does not require prior processing of samples, i.e. DNA extraction and amplification. Thus, the assay had an improved sensitivity and accuracy in addition to the simplicity of its technique. Future studies should evaluate the efficacy of this method in clinical situations where follow-up of changing concentrations of CFD are indicative of disease activity.
Materials and methods
CFD was detected with the present assay directly in biological fluids. SYBR® Gold Nucleic Acid Gel Stain, (Invitrogen, Paisley, UK) was diluted first at 1:1000 in dimethyl sulphoxide (DMSO, Sigma-Aldrich, Rehovot, Israel) and then at 1:8 in phosphate-buffered saline (PBS, Biological Industries, Beth Haemek, Israel). Ten microlitre of DNA solutions were applied to a black 96-well plates (Greiner Bio-One, Frickenhausen, Germany). Forty microlitre of diluted SYBR® Gold was added to each well (final dilution 1:10,000) and fluorescence was measured with a 96 well fluorometer (Spectrafluor Plus, Tecan, Durham, NC, USA) at an emission wavelength of 535 nm and an excitation wavelength of 485 nm.
Background fluorescence of serum
For the assessment of background reading and to establish the optimal serum concentration in DNA standard solutions, we used pooled human serum from 10 healthy donors. Sera were preincubated at 37°C overnight with either RNase (100 U, Sigma-Aldrich, Rehovot, Israel) or for 5 h with DNase (500 U, 5-PRIME Inc., Gaithersburg, USA). DNase was inactivated by 20 mmol/L ethylenediaminetetraacetic acid prior to addition of DNA standards.
For the assessment of background and quenching of serum, serum was diluted with PBS to various concentrations (0%, 10%, 20%, 30% and 40% serum, respectively); the same amount of salmon sperm DNA was added to all solutions resulting in a final DNA concentration of 1140 ng/mL. Assay was performed in triplicate. Serum solutions at similar concentrations not containing DNA were used to determine background fluorescence.
DNA standards
For the fluorometric assay, standards were prepared with commercial Salmon sperm DNA (Sigma-Aldrich). For comparison with the conventional quantitative polymerase chain reaction (QPCR) assay, human DNA was extracted from blood leukocytes using QIAamp Blood Kit (Qiagene, Hilden, Germany) according to the manufacturer's protocol. Concentrations of DNA used for the standard curves were determined by UV absorbance at 260 nm using a Nano-drop spectrophotometer (Thermo Fisher Scientific, Wilmington, DE, USA).
Biological fluids
To assess the dose response of the assay in different fluids, salmon sperm DNA was diluted at various concentrations in four different fluids: (A) 20% solution of pooled serum from 10 healthy donors in PBS; (B) 2% solution of bovine serum albumin (BSA, Biological Industries, Beth Haemek, Israel) in PBS; (C) heparinized fresh whole blood from a healthy donor and (D) pooled urine from 10 healthy donors buffered to pH 7.4 with 10 mmol/L (4-[2-hydroxyethyl]-1-piperazineethanesulphonic acid) HEPES (Biological Industries).
Effect of storage conditions
Whole blood: refrigeration versus room temperature
To asses the effect of storage temperature on the assay, eight whole blood samples were collected from healthy volunteers into commercial gel tubes using the BD Vacutainer® system (Becton, Dickinson and Company, Plymouth, UK). Centrifugation was postponed; five tubes from each donor were stored for 0.5, 1. 4, 5 and 24 h at room temperature (RT) and three tubes were stored for 0.5, 4, and 24 h at 4°C. At respective time points, tubes were centrifuged, sera were collected and assayed for DNA by the direct SYBR® Gold assay.
Serum: RT
In a further experiment, aliquots of one human serum were incubated at RT and each aliquot was assayed at different time points. In addition, 10 random sera from our serum bank were grouped according to their DNA level as measured by the direct SYBR® Gold assay into one of three groups: low, elevated and high range of DNA level (low range group: 580, 460, 475 ng/mL; elevated range group: 2410, 2180, 2440, 2005 ng/mL; high range group: 3515, 3975, 3570 ng/mL). Sera were thawed and aliquots were incubated for 24 h at RT and compared, for their DNA levels, with their corresponding aliquots that were kept at −20°C.
Serum: repeated freezing and thawing
Aliquots of the same 10 sera were frozen and thawed five times and compared, for their DNA levels, with their corresponding aliquots that were kept at −20°C and thawed only once.
Within-day variation
Intraday variation of the assay was assessed by comparing readings of 12 assays performed independently on separate plates at different times over one working day. In each assay, duplicates of three sera with low, elevated and high DNA concentrations (197, 1096 and 4107 ng/mL, respectively) were analysed.
Day-to-day variation
Day-to-day variation was assessed by comparing readings of aliquots from the same sera on four different days. A total of 12 aliquots were analysed in duplicates from three donors with low, elevated and high DNA concentrations (383, 1152 and 2735 ng/mL, respectively).
Comparison with conventional CFD assay
We also compared the direct SYBR® Gold assay with a conventional method of CFD assay as follows: standards of human DNA were analysed by quantitative realtime PCR (QPCR) amplification of the β-globin gene. The amplification mixture contained: 7 μL of DNA samples or human DNA standards (15–1000 ng/mL) in QIAamp elution buffer 2 μL of each primer (20 μmol/L), 10 μL of ABsoluteBlue QPCR SYBR Mix Rox (ABgene, Surrey, UK) and water to a final volume of 20 μL. The primers and QPCR conditions of the human β-globin gene have been previously described: 8 Forward primer:5′ ACACAACTGTGTTCACTAGC 3′, reverse primer: 5′ CAACTTCATCCACGTTCACC 3′.
The reaction was carried out in a Rotor-Gene realtime PCR machine (Corbett-Research, Northlake, Australia). Cycle conditions were: initial activation step at 95°C for 15 min, followed by 45 cycles of denaturation at 95°C for 15 s, annealing at 56°C for 20 s and extension at 72°C for 15 s. Concurrently, the human standards were diluted in 20% DNase-treated pooled sera and assayed by the direct SYBR® Gold assay. Correlation between the direct SYBR® Gold assay and the QPCR assay was assessed by the Spearman rank test.
Reference values
Reference values were established by analysis of sera from 47 healthy volunteers. The volunteers were mostly students who declared themselves to be healthy and without chronic disease. The cohort consisted of 22 female and 25 male subjects with an average age of 26.3 ± 4.7 yr. Three samples were excluded from the reference group: two of them due to haemolysis and one donor who was diagnosed with acute infectious mononucleosis.
Culture media DNA after cell lysis
Cultured fibroblast cells (L-cells) were seeded at various numbers in triplicates (0, 40, 60, 80, 100, 120, 150 and 200 × 103 cells/well) in 24-well plates with 1 mL of Dulbecco's Modified Eagle's Medium (DMEM) medium containing 10% fetal calf serum (Biological Industries). Cell lysis was induced with a detergent (0.1% NP40) and gentle agitation for 30 min. Supernatants were collected and assayed for DNA concentration by the direct SYBR® Gold assay. In addition, lactate dehydrogenase (LDH) activity was assayed in the supernatant using a commercial kit (BioVision, Mountain View, CA, USA) according to the manufacturer's protocol.
Statistics
Statistical analysis was performed with GraphPad Prism® software (edition 4.01), statistical significance was determined by t-test or analysis of variance. The significance of correlation was analysed by Pearson's r-test. A P value of <0.05 was considered significant. Gaussian distribution of the data has been certified by the D'Agostino and Pearson omnibus normality test.
Results
In preliminary studies, the assay was tested in plasma and serum. Identical results were obtained in both cases (not shown). Quantification of human serum DNA with the direct SYBR® Gold assay is linear over a wide range of concentrations in various biological fluids (Figure 1). The background readings as determined in DNase-treated sera were comparable to readings of BSA solution in PBS: slope of readings in 20% serum solutions and 2% BSA solutions being 9.363 ± 0.1176 and 9.019 ± 0.1330, respectively (Figure 1a and b). Limit of quantitation was 170 ng/mL, determined as the mean concentration plus 10 standard deviation of blank samples of 2% BSA in PBS (n = 10). 6 We compared our method with the conventional CFD assay and measured the same standard samples either by our assay or by QPCR of the β-globin gene. Direct DNA quantification by the direct SYBR® Gold assay correlated significantly with conventional DNA quantification of the β-globin gene (Figure 1e).
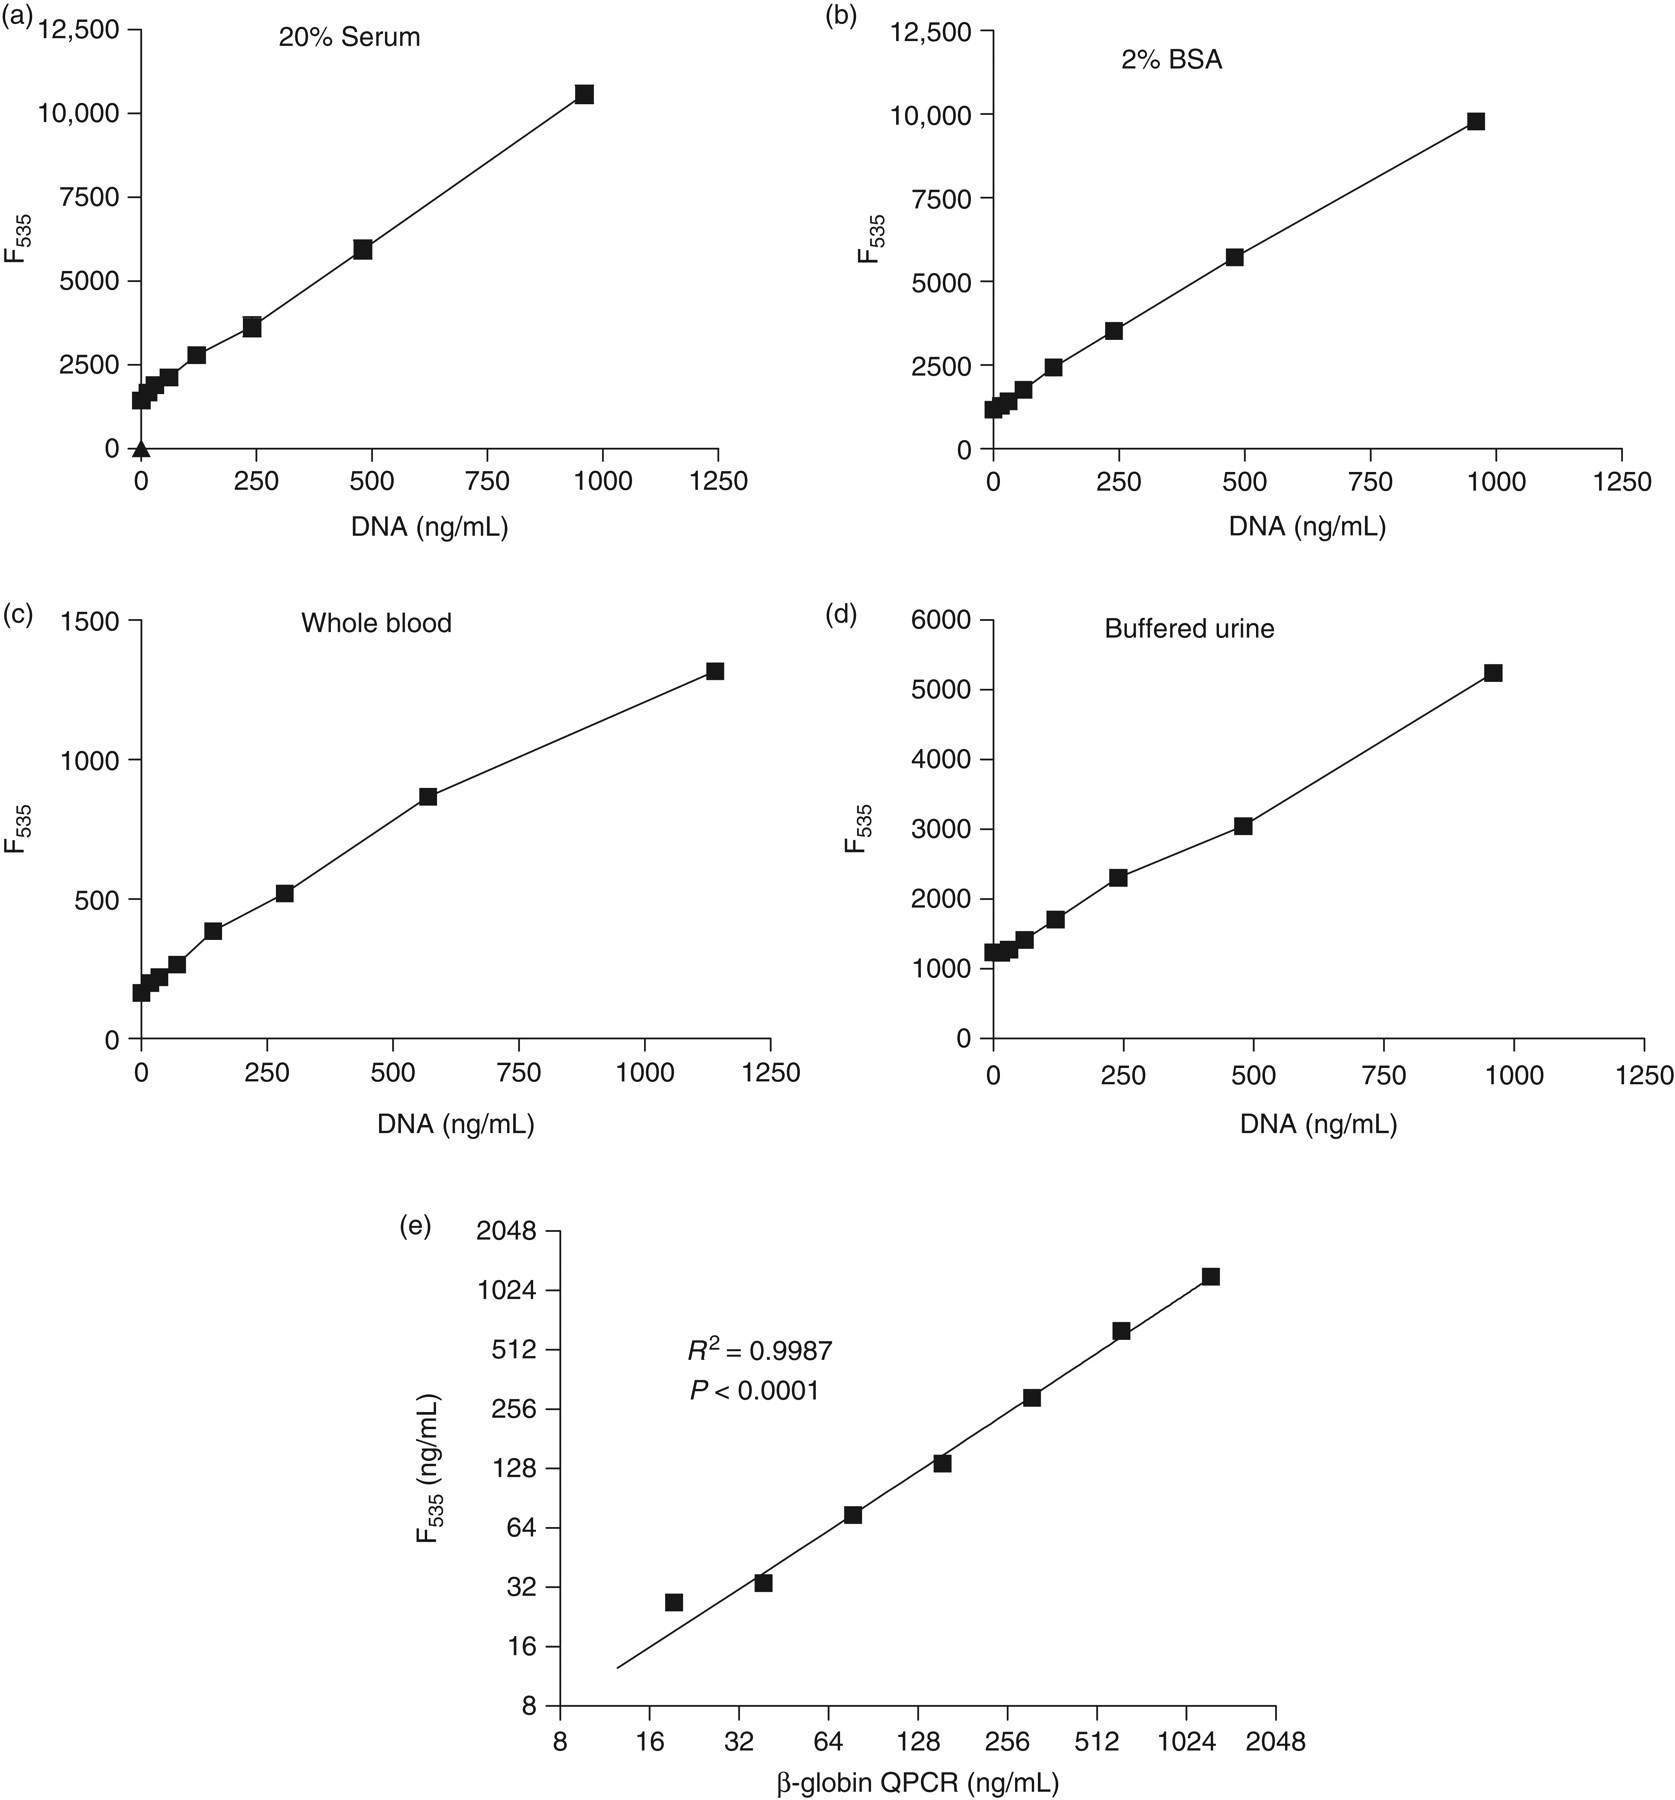
DNA assay with direct SYBR® Gold and conventional β-globin quantitative polymerase chain reaction (QPCR) assay Commercial Salmon sperm DNA was dissolved at various concentrations in four different fluids: (a) 20% solution of DNase-treated pooled serum from 10 healthy donors in PBS. (b) 2% solution of bovine serum albumin (BSA) in PBS. (c) Fresh heparinized whole blood from a healthy donor and (d) Pooled urine from 10 healthy donors. Urine was buffered to pH 7.4 with 10 mmol/L HEPES. DNA solutions were added in duplicates to black 96 well plates, SYBR® Gold was added to each well (1:10,000) and fluorescence was measured at 535 nm (F535) by a plate reader fluorometer. (e) Human DNA was purified from leukocytes of a healthy volunteer and quantified by optical density (260 nm) using a nanodrop spectrophotometer. Serial dilution of DNA concentration was then determined by the SYBR® Gold assay (F535) and by realtime PCR (QPCR) using specific primers for β-globin
Preincubation of serum with RNase did not change the readings obtained in the direct SYBR® Gold assay. By contrast, fluorescence readings consistently dropped to background values after preincubation of the sample with DNase, suggesting that the fluorescence readings mainly represent emission from DNA (Figures 2a and b). The background reading from DNA-free serum was dose dependent (Figure 2c). Quenching of the specific DNA signal by serum reached significance at a serum concentration of 40% (Figure 2d). Therefore, for a standard direct SYBR® Gold assay, serum samples are diluted five-fold (20%), thus avoiding a significant reduction of the specific DNA signal by quenching.
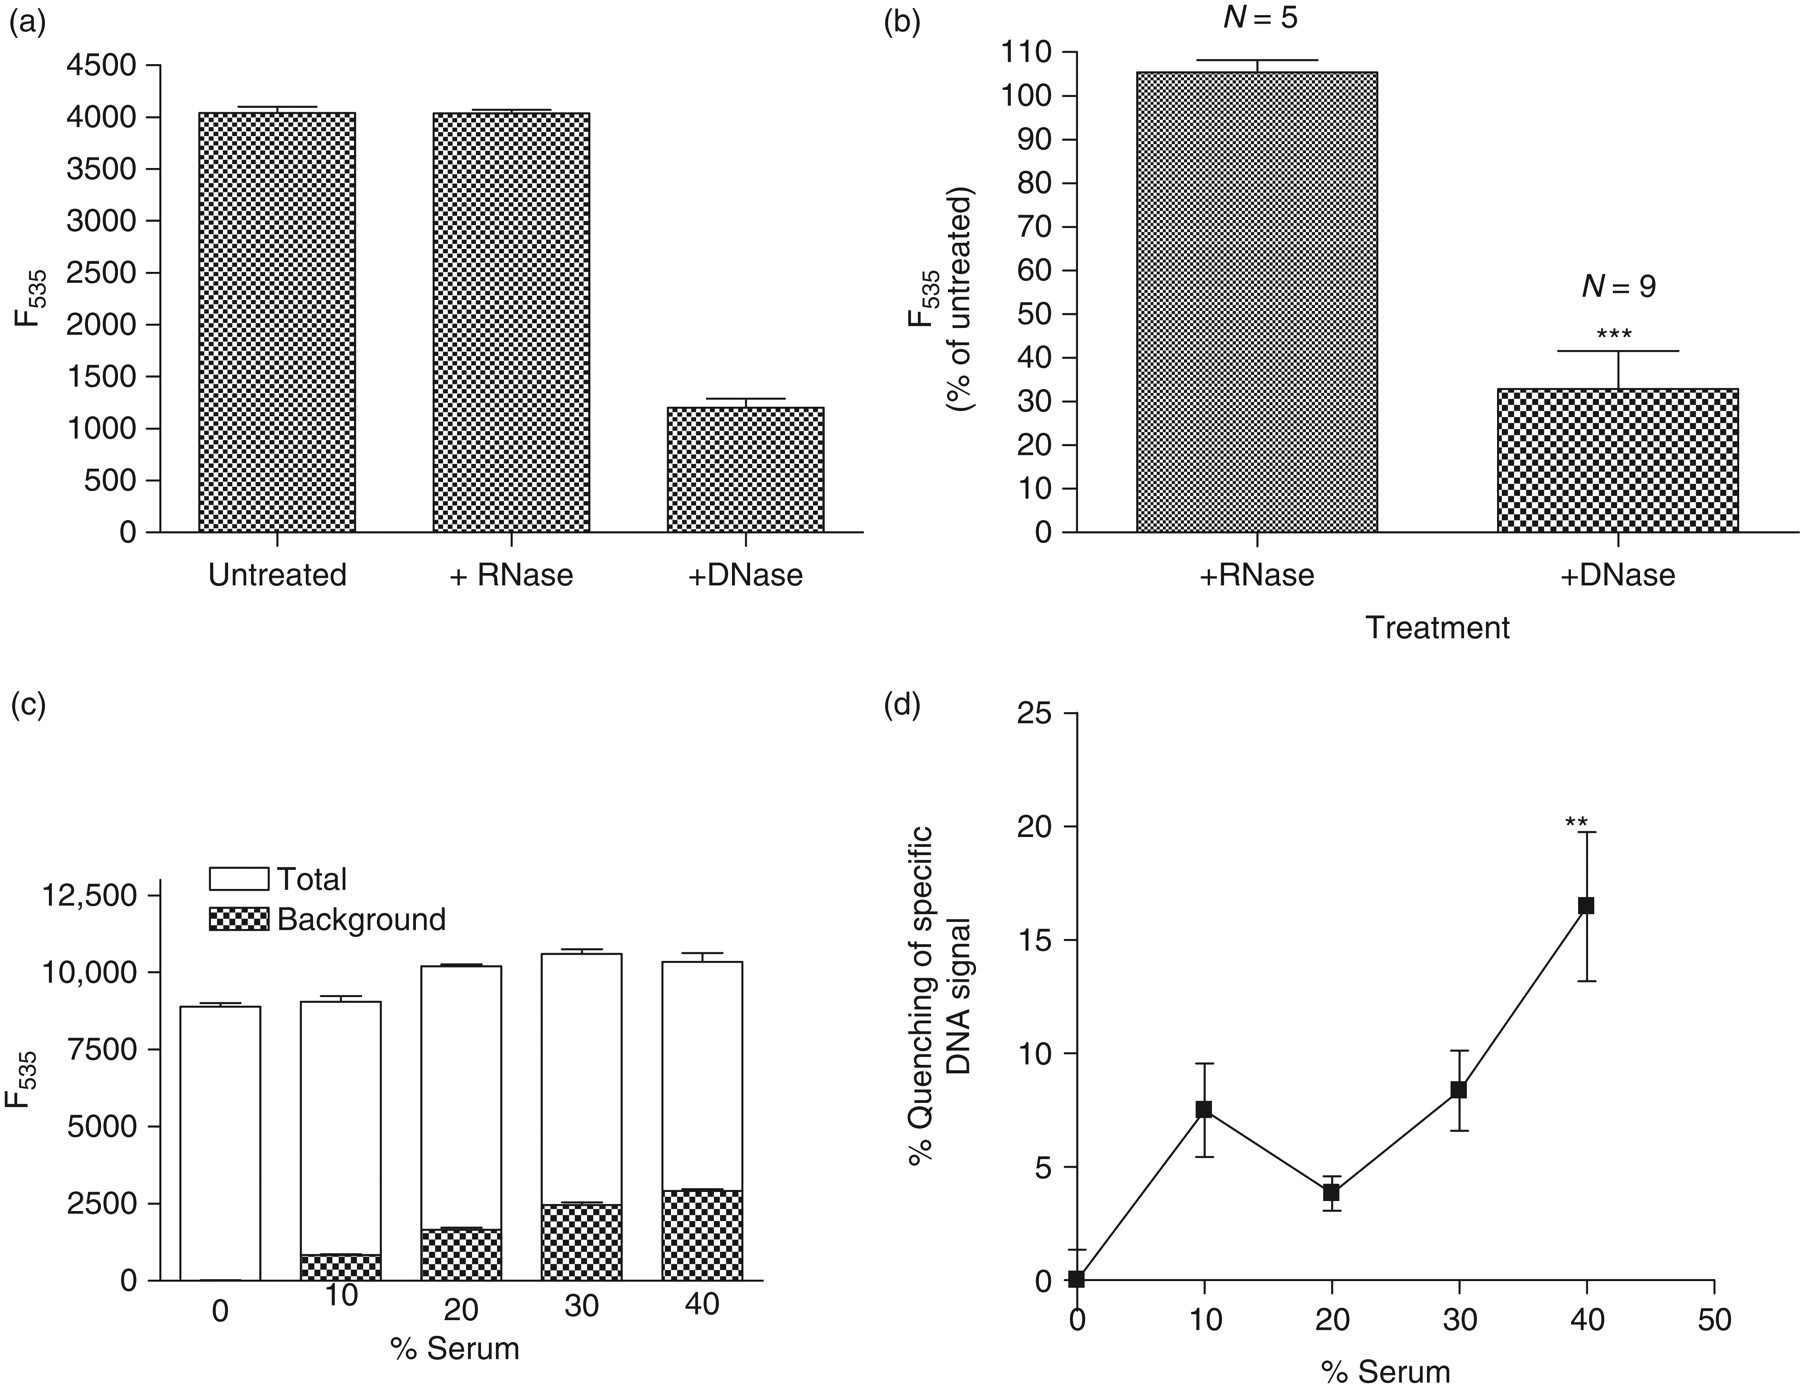
SYBR® Gold Assay specificity. (a) One representative serum was divided and treated with DNase (500 U) or RNase (100 U). (b) Percent mean fluorescence of sera after incubation with RNase (n = 5) or DNase (n = 9) in relation to the corresponding untreated sera. For determination of serum quenching, pooled human serum was preincubated with DNase and diluted with PBS to various concentrations; same amount of salmon sperm DNA was added to all solutions resulting in a final concentration of 1140 ng/mL. Serum solutions at same concentrations not containing DNA were used to determine background fluorescence. (c) Total and background fluorescence of serum solutions (d) Calculated quenching percentage of the specific DNA signal (100–100 × [Total F535 − Background F535]/total F535). Assay was performed in triplicates, **indicates P < 0.01 comparing serum solution to PBS without serum. ***indicates P < 0.001
Our data suggest that whole blood samples may be stored at RT for up to 6 h before further processing by centrifugation; alternatively whole blood samples may be stored at 4°C for up to 24 h without affecting fluorescence readings (Figure 3a). However, CFD levels significantly increased when respective storage periods were exceeded before centrifugation, presumably because of DNA release from disintegrating blood cells, mainly white blood cells. CFD levels in separated sera were unaffected by RT even when serum samples were stored overnight at RT. Also, repeated freezing and thawing did not affect fluorescence readings (Figures 3b and c).
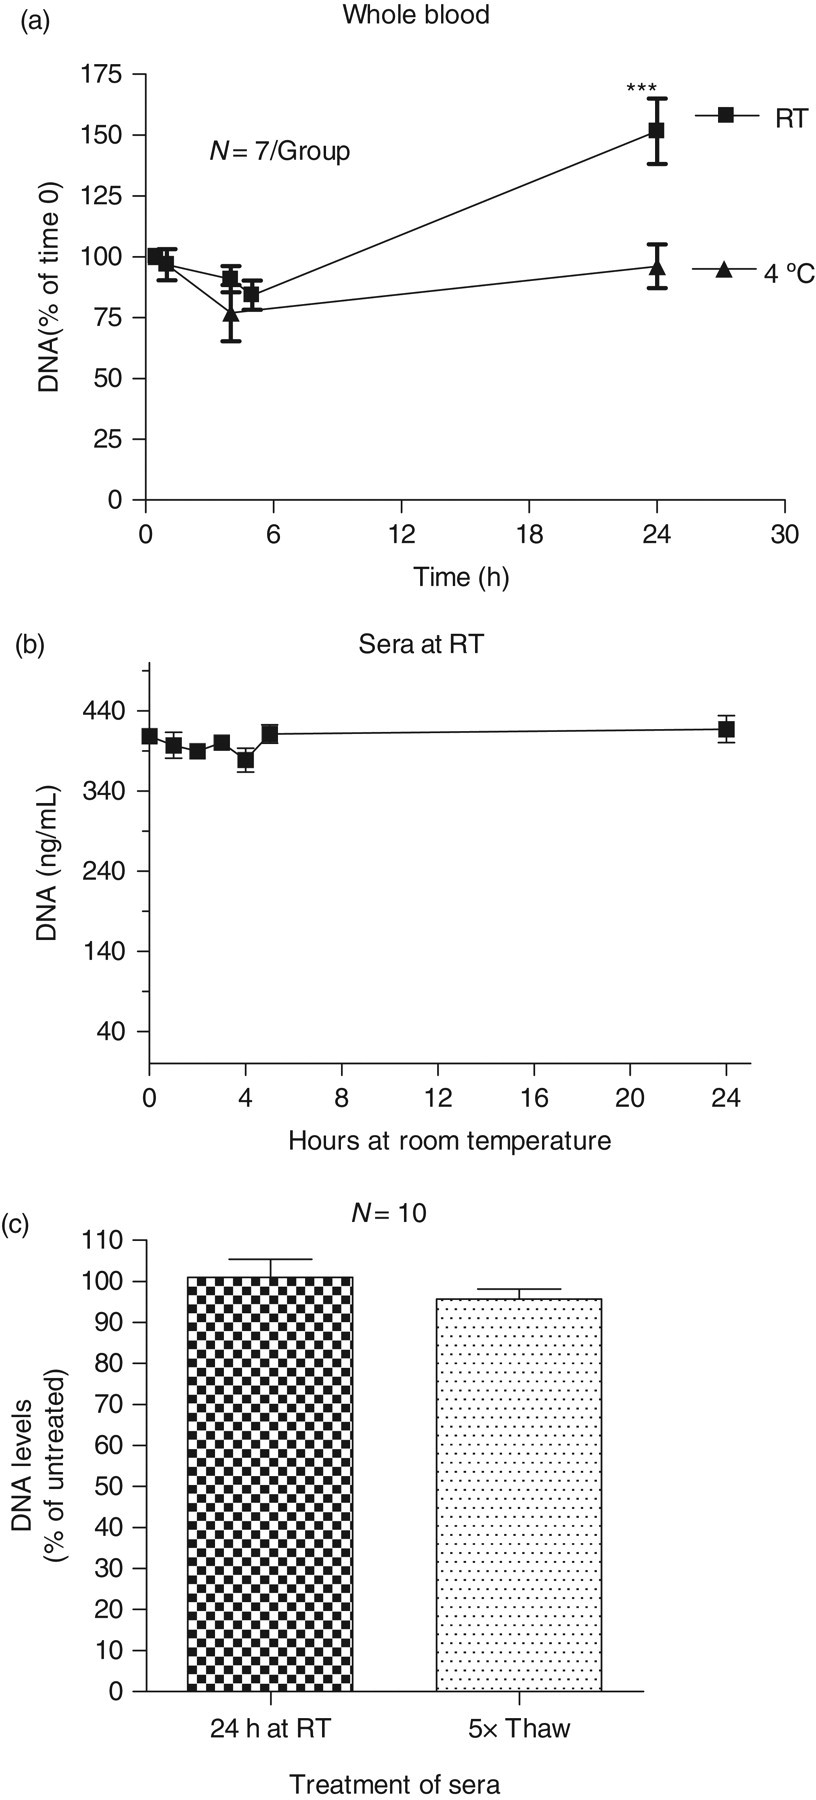
Effect of storage conditions: (a) Blood from seven healthy volunteers was collected into commercial gel tubes (8 tubes per donor). From each donor, five tubes were stored at room temperature (RT) and three tubes at 4°C. Tubes were centrifuged and sera were collected for the DNA assay at indicated time points. (b) Aliquots of one human serum were incubated at RT for the indicated time. (c) Aliquots of 10 different sera (3 low, 4 elevated and 3 high DNA concentrations) were and incubated for 24 h at RT or frozen and thawed five times and then assayed for DNA. Assays were performed in triplicates. Readings of different time points were compared with readings at time zero. ***indicates P < 0.001
Intra-day coefficient of variation was 16%, 7.9% and 4.8% in the low, elevated and high DNA range, respectively (Figure 4a). Day-to-day coefficient of variation was 31%, 6.7% and 8% in the low, elevated and high DNA range, respectively (Figure 4b).
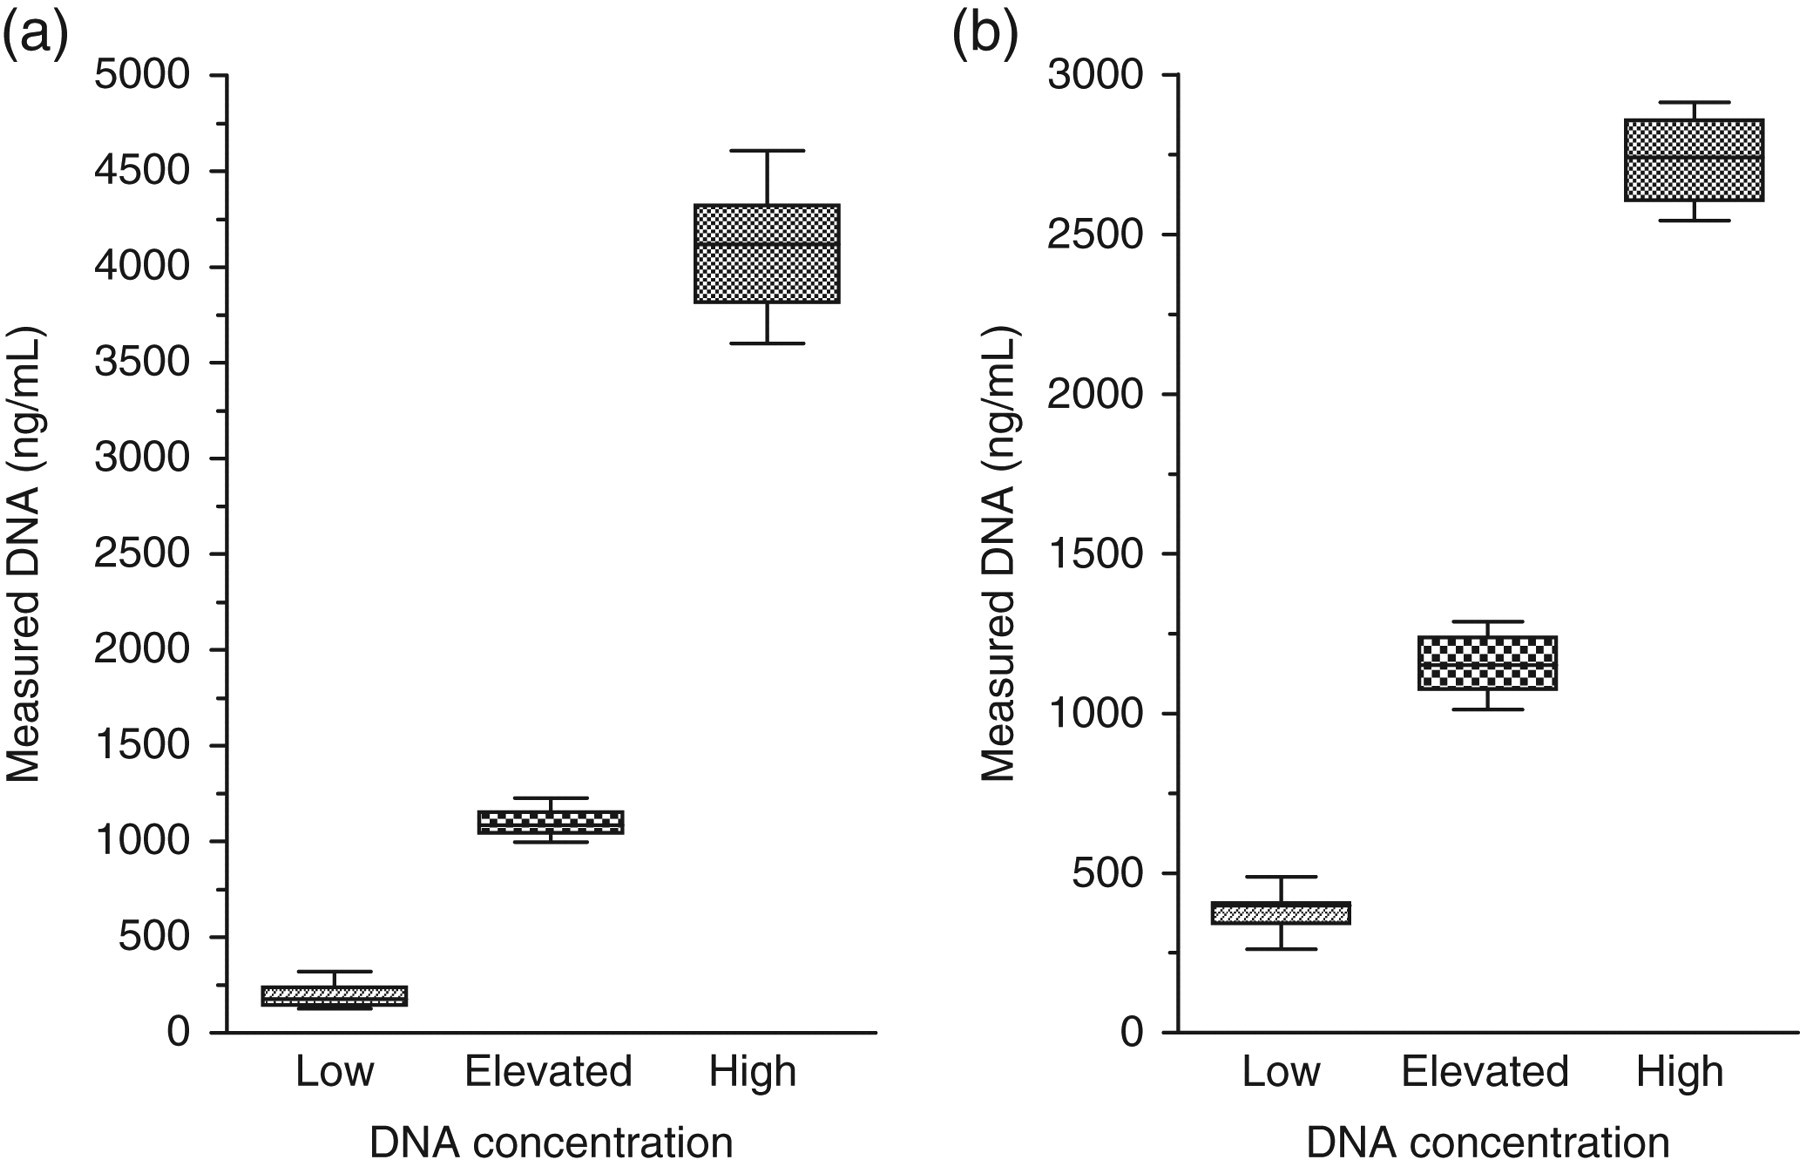
Intra-day and intra-assay variation: To assess the variation of the assay, three sera were used containing normal, elevated and high DNA concentrations (197, 1096 and 4107 ng/mL, respectively) (a) Intra-day variation of the assay was assessed by comparing readings of 12 assays of each sample in duplicates done independently on separate plates at different times over one working day. (b). Day-to-day variation was assessed by comparing readings of 12 aliquots of each sample. Aliquots were frozen and assayed on different days. For this assay, serum of three donors was used with low, elevated and high DNA concentrations (383, 1152 and 2735 ng/mL, respectively). Median value of the assays is indicated by the line inside the box. The box indicates the distribution of 50% of the results and the bar above and below the box indicates 25% of the data
The mean DNA concentration in sera from 47 healthy volunteers was 471 (203) ng/mL (Figure 5); thus, the normal range of CFD (mean ± 2 SD) was 65–877 ng/mL. A Gaussian distribution of the data in controls was certified by the D'Agostino and Pearson omnibus normality test.
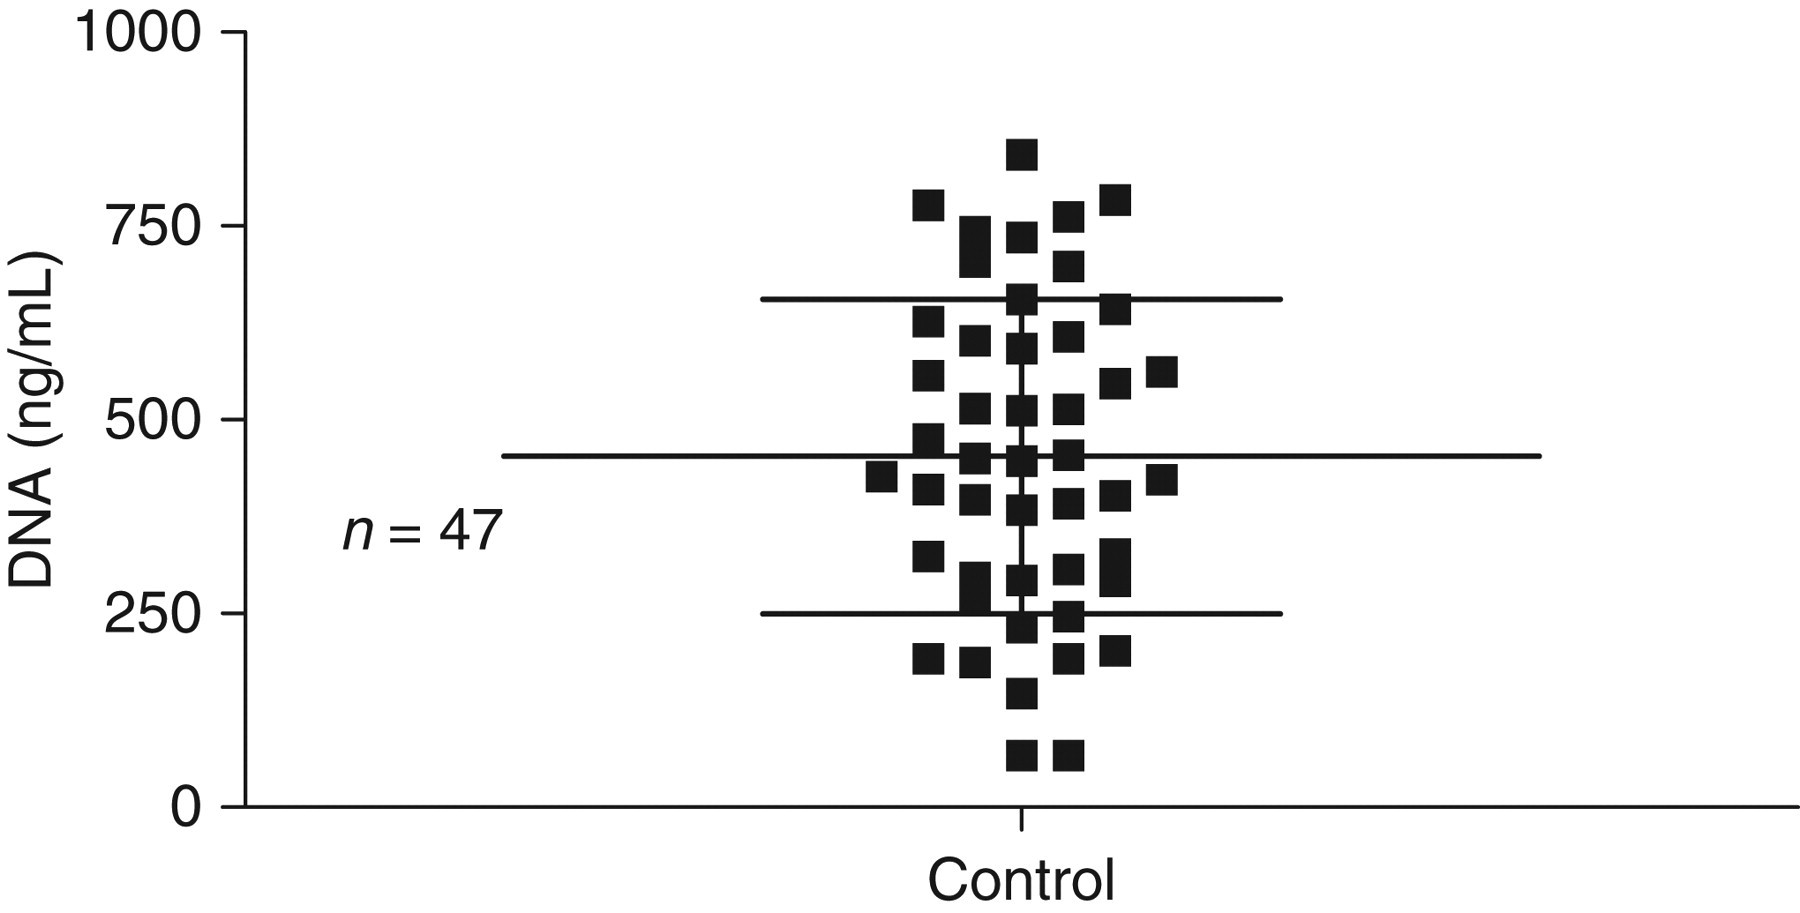
Normal reference values were obtained by analysis of sera from 47 healthy volunteers. The volunteers were mostly students who declared themselves to be healthy and with no chronic disease. The cohort consisted of 22 females and 25 males with an average age of 26.3 (4.7) years
DNA standards in cell-culture medium containing 10% serum showed a linear fluorescence response using the direct SYBR® Gold assay (not shown). CFD in supernatants after cell lysis of cultured fibroblasts correlated linearly with cell number and significantly correlated with LDH activity over a wide range of cell numbers (Figure 6).
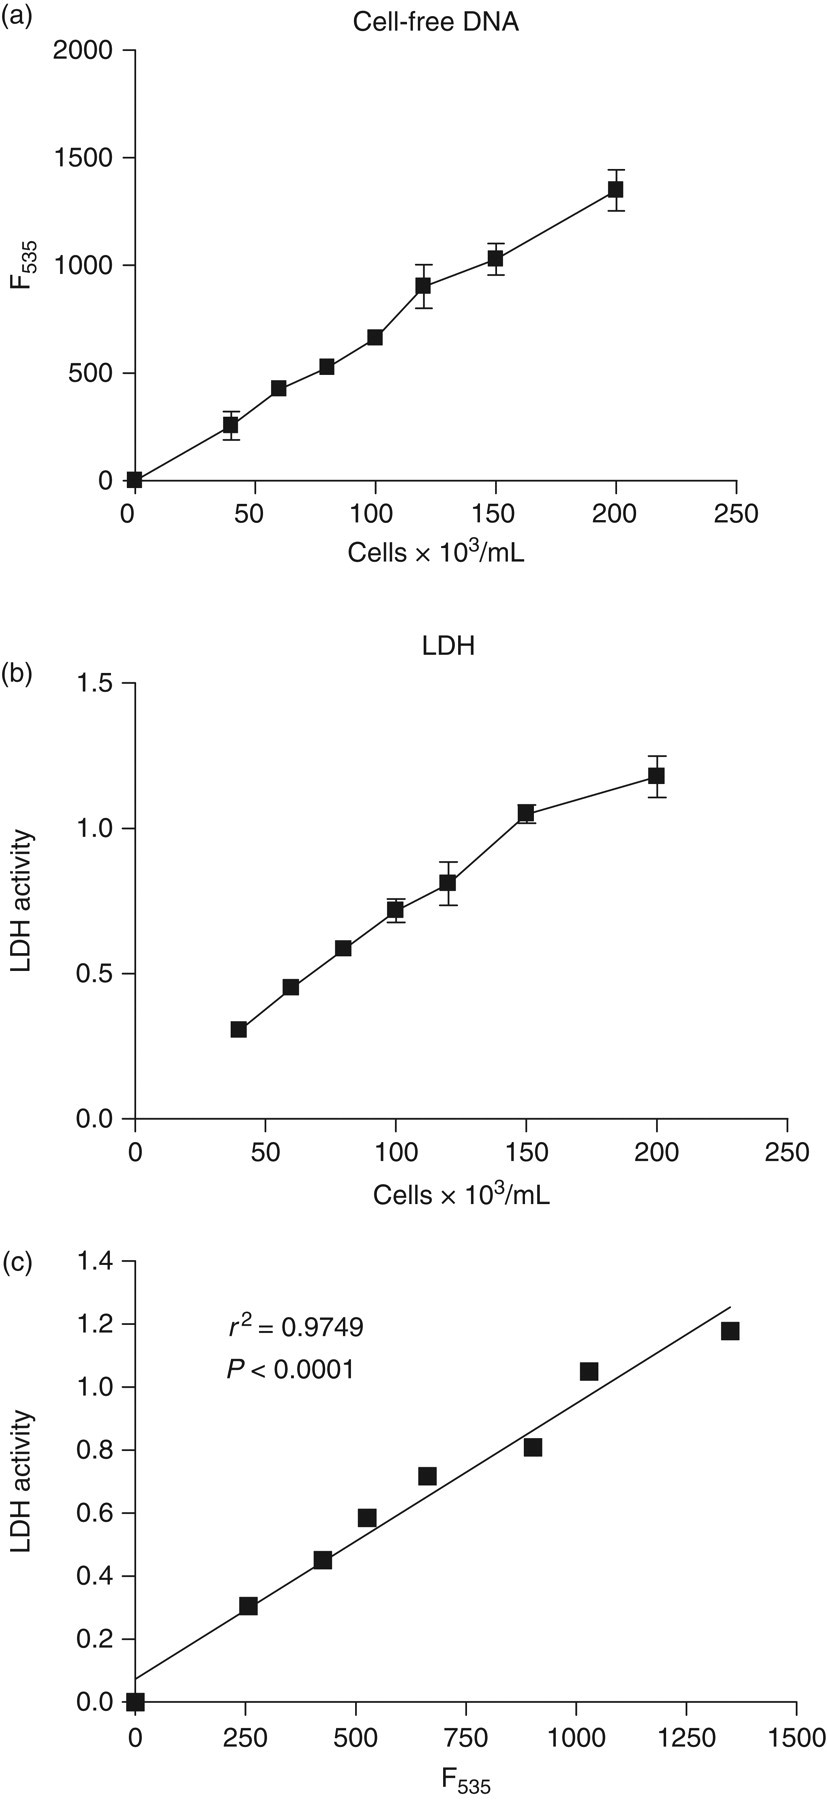
Culture media free DNA and lactate dehydrogenase (LDH) activity after cell lysis of cell culture: Cultured fibroblast cells (L-cells) were seeded at various numbers in triplicates (0, 40, 60, 80, 100, 120, 150 and 200 × 103 cells/well) in 24 well plates with 1 mL of DMEM medium containing 10% fetal calf serum. Cell lysis was induced with a detergent (0.1% NP40) and gentle agitation for 30 min. Supernatants were collected and assayed for free DNA and LDH activity. (a) Supernatant free DNA (F535). (b) Supernatant LDH activity. (c) Correlation between supernatant free DNA and LDH activity
Discussion
Our study presents a convenient and inexpensive method for direct assay of CFD applicable to various biological fluids without the necessity of prior processing. The budgetary load is negligible as the expense for disposables and reagents of 100 tests amounts to less than 7 Euros.
Early reports on the presence of serum free nucleic acids in patients with systemic lupus erythematosus and rheumatoid arthritis have remained unnoticed for many years. 9,10 However, in recent years, detection of nucleic acids using fluorescent dyes has been made possible, although following only extraction from biological solutions. To date, the application of the current standard procedures has been limited to research laboratories.
SYBR® Gold stain is a sensitive fluorophore available for detecting single- or double-stranded RNA or DNA in electrophoretic gels. 7 Biological samples have hitherto been considered unsuitable for direct fluorescent assay of nucleic acids because of presumed interference of unspecified organic molecules present in biologic samples with the DNA–chromophor complex. Our study demonstrates that up to a serum concentration of 30%, background fluorescence does not significantly reduce readings derived from DNA present in the sample.
To run the direct SYBR® Gold assay, standard DNA solutions do not have to be prepared in serum solutions. Comparable readings are obtained if standard solutions are prepared in BSA solutions (2% in final reaction mixture). This will obviate the need for preincubation of pooled serum with DNase for dilution of standards.
The specificity of the direct SYBR® Gold assay for DNA has been demonstrated in our study by a consistent decrease of readings after preincubation of the sample with DNase. Specificity of the direct SYBR® Gold assay may, in theory, be affected by the presence of RNA in the sample since the SYBR® Gold stain detects RNA as well as DNA. The direct SYBR® Gold assay applied to biological fluids used in this study did not detect significant amounts of RNA since added RNase did not change measurements even in serum samples from healthy volunteers. Presumably, this is due to the known liability of RNA to be easily degraded in circulation by ubiquitous RNase. The contribution of RNA on evaluation of CFD in pathological samples is not excluded by the current study and should be tested in the future.
Sensitivity of the direct SYBR® Gold assay may be affected by DNase reported to be present in serum. 11 Although it is a stable enzyme in circulation, it does not affect readings even if serum samples are left at RT for prolonged periods prior to assay.
Intraday and day-to-day coefficients of variations are similar in our study to published data using the PicoGreen® DNA quantification kit (Invitrogen). 6
To prevent factitious elevation of free DNA levels from contaminating blood cells, serum needs to be separated within a few hours from cells in whole blood samples. A lag of more than 6 h from blood sampling till centrifugation will result in a significant elevation of free DNA levels. Once serum is separated, free DNA is stable, i.e. the assay is not affected by the prolonged exposure of serum to RT or repeated freezing and thawing.
The quantitation limit of the direct SYBR® Gold assay in our study was 170 ng/mL. Other studies using the PicoGreen® DNA quantification kit (Invitrogen) in buffered solutions not containing proteins, determined a detection limit of 160 pg/mL. 6 The DipStick TM kit (Invitrogen) claims to have a detection limit of 100 ng/mL. The average serum-free DNA level in a reference cohort of healthy volunteers found in our study was much higher than previously published data. Thus, we found an average level of 471 ± 203 ng/mL whereas others measured by the DNA DipStick kit (Invitrogen, Carlsbad, CA, USA) found an average level of 18 ng/mL and a range of 0–66 ng/mL as measured with Hoechst 33258. 11,12 This discrepancy is to be expected because all published methods include an obligatory DNA extraction step, which presumably lowers the yield. Yield is further compromised in conventional methods quantifying DNA by QPCR because small DNA fragments are not amplified whereas the direct SYBR® Gold assay detects fragments of nucleic acids as small as 12–18 base pairs. 7
Thus, while the direct SYBR® Gold assay compares well with conventional CFD assays in terms of linearity, it will probably not be comparable with other assays in terms of absolute CFD levels. This is to be expected since the different assays are based on different techniques.
Finally, the direct SYBR® Gold assay may also be conceived as a convenient assay of cell number in cell culture studies. As demonstrated in Figure 6, free DNA level in culture media after cell lysis correlates well with both cell number and LDH activity.
To conclude, previous studies have shown that CFD reflects disease activity in patients with trauma, stroke, sepsis, pre-eclampsia and cancer. The direct SYBR® Gold assay is convenient, inexpensive and accurate for direct analysis of CFD in biological samples. The assay therefore fulfils the requirements for routine use in laboratories of clinical chemistry and future studies should be conducted to demonstrate its clinical relevance.
DECLARATIONS