
Abstract
Background
Random urine protein-to-creatinine (PCR) and albumin-to-creatinine (ACR) ratios have been proposed as alternatives to 24 h urine measurements to simplify sample collection and overcome errors. The aim of this study was to examine the ability of PCR and ACR to predict urinary 24 h protein and albumin loss, respectively, in patients with kidney disease, and determine the most appropriate time of collection.
Methods
Eighty-three patients were recruited from a renal outpatient clinic. In a 24 h period, each collected an early-morning urine (EMU), second and third voids, and the remaining urine passed that day. PCR and ACR were determined in random urines and compared with the 24 h loss of protein and albumin, respectively.
Results
For all patients, median (range) 24 h urine protein and albumin losses were 220 (30–15600) and 60 (<8–10,557) mg, respectively. Ratios derived from each of three random urines correlated well with 24 h protein or albumin loss (Spearman's r s > 0.87, P < 0.0001). Receiver operator characteristic (ROC) curve analysis showed PCR accurately predicted both an abnormal 24 h urine protein ≥150 mg/24 h (areas under curves [AUC] 0.90–0.92) and significant proteinuria above 300 mg/24 h (AUC between 0.97 and 1.00). ACR accurately predicted both an abnormal 24 h urine albumin ≥30 mg/24 h (AUC 0.98 to 0.99) and frank albuminuria at ≥300 mg/24 h or ≥700 mg/24 h (AUC between 0.99 and 1.00). EMU and random urines performed equally well in predicting proteinuria and albuminuria from PCR and ACR, respectively.
Conclusions
By careful choice of cut-offs, both PCR and ACR can be used in patients with kidney disease to rule in or rule out abnormal 24 h losses of protein and albumin. EMU and, importantly, random samples can be used as surrogates for 24 h urine collections.
Introduction
The identification and quantitation of proteinuria is of importance in the initial diagnosis and subsequent follow-up and monitoring of renal disease. 1,2 Proteinuria is also recognized as an independent risk factor for cardiovascular disease and as a predictor of end organ damage. 3–5 More specifically, urine albumin measurement now has an established role in the early identification and monitoring of diabetic nephropathy 6 and, relatively recently, has been identified as an indicator of cardiovascular risk in renal, hypertensive and other patients. 7,8 Thus, urine protein or albumin measurements now form a central part of the classification and guidelines for chronic kidney disease (CKD). 9–12
There is no ‘gold standard’ for identifying proteinuria and, although it has been generally accepted that the best measure of protein or albumin loss is that based on a 24 h urine collection, the variability of results obtained by this method make this view questionable. Quoted reference ranges for 24 h protein loss vary, but most would regard a protein loss of more than 150 mg/24 h as abnormal with significant proteinuria being greater than 300 mg/24 h. 13
Urine albumin measurements have been used as a more sensitive measure and early marker for nephropathy 6 and there is now much support advocating the use of urine albumin measurement rather than total protein 14,15 because detection of ‘low-level’ albuminuria, important in the therapeutic approach to a patient, may be masked by tests that measure total protein. Urine albumin losses in the normal individual are usually <30 mg/24 h (and often below 10 mg/24 h), with 30–300 mg/24 h being within the ‘microalbuminuric’ range. 16,17 Urinary losses above 300 mg/24 h would be regarded as frank albuminuria (clinically overt proteinuria).
Twenty-four hour urine collections, however, can be cumbersome to perform and prone to errors in collection. 18 For this reason, the use of protein or albumin-to-creatinine ratios (PCR or ACR) in random urine samples has been proposed. 19 ACRs have been evaluated extensively in patients with diabetes 20–22 and several studies have examined the utility of PCRs in predicting proteinuria, primarily in hypertensive pregnancy 23,24 and paediatric settings. 25,26 There have been relatively few studies in renal disease 27–30 and there is little data at present which shows the ability of ACR to predict proteinuria in non-diabetic patients. Most studies have demonstrated a good relationship between calculated ratios and 24 h protein loss and some have quoted predictive values for identifying significant proteinuria. Few, however, have indicated the confidence with which creatinine ratios can rule in or rule out proteinuria. One systematic review of studies using random urine PCR concluded that they provided evidence to rule out significant proteinuria as defined by a 24 h measurement. 13
The aim of this study was to assess the ability of PCR and ACR from random urine samples to rule in or rule out proteinuria or albuminuria in patients with kidney disease attending a nephrology clinic. In addition, by collecting urine at different points during the day, the most appropriate random urine sample, if any, could be determined.
Patients
A total of 117 outpatients with various stages of CKD and requiring 24 h urine total protein measurement as part of their clinical investigation or management were enrolled in the study between September and December 2005. Patients were consecutive and recruited from one consultant's (PAK) nephrology clinic. Other parts of the study have been reported elsewhere. 31,32 The study was approved by Greater Manchester Local Ethics Committees with signed written consent being obtained from each patient.
Methods
Each patient was asked to collect urine in the 24 h period immediately prior to their nephrology clinic appointment as follows. After discarding the first sample of the day, urine was collected in four separate containers: (i) second void; (ii) third void; (iii) remaining urine passed that day; and (iv) early-morning urine (EMU) passed the following day. Urine was collected into containers without preservative and stored at 4°C prior to analysis, which was usually within 24–48 h of receipt.
Urine protein, albumin and creatinine were measured on each of samples (i), (ii) and (iv) and PCR and ACRs (both mg/mmol) calculated. All four aliquots were then pooled, the volume measured, and protein and albumin measurements repeated to give the 24 h outputs of each.
All assays were performed on the Roche Integra 800 (Roche Diagnostics Ltd, Burgess Hill, UK) using reagent kits and calibrators supplied by the manufacturer. Urine protein was measured using pyrogallol red, 33 urine creatinine by a kinetic Jaffe method 34 and urine albumin by immunoturbidimetry. 35 The lower limits of detection for urine protein and albumin assays were 20 and 8 mg/L, respectively. Between-day coefficients of variation for the urine protein assay were 2.2% and 4.3% at concentrations of 161 and 550 mg/L, respectively. For the urine albumin assay, they were 2.0% and 2.6% at concentrations of 26.7 and 97.5 mg/L, respectively and for urine creatinine they were 1.7% and 1.8% at concentrations of 12.7 and 5.7 mmol/L, respectively. For the purposes of this study, random urines with undetectable protein or albumin concentrations were, respectively, designated as having a PCR of 5 mg/mmol and ACR of 0.5 mg/mmol. The 24 h urines with undetectable albumin were designated an albumin loss of 5 mg/24 h.
Statistical analyses on the data were performed using Analyse-it for Excel (Analyse-it Software Ltd, Leeds, UK). Spearman's rank correlation was used to compare urine PCR and ACR with 24 h protein and albumin loss, respectively. The ability of urine PCR and ACR at various cut-offs to predict abnormal 24 h protein or albumin loss was determined from receiver operator characteristic (ROC) curve analysis and by calculation of sensitivities, specificities, predictive values and likelihood ratios (LRs). A negative likelihood ratio (LR[−], false-positive rate/true negative rate) of <0.1 and positive likelihood ratio (LR[+], true positive rate/false-negative rate) greater than 10 were taken to indicate good test performance. 36 Areas under ROC curves were compared using the method of DeLong et al. 37
Results
Patient characteristics
Of the 117 patients who consented to be involved in the study, 86 (73.5%) returned urine samples. Two urine collections of <500 mL in volume and one having a 24 h urine creatinine output <3.0 mmol were rejected on the assumption that they might not have been complete 24 h collections. The main contributory causes of CKD in the remaining 83 patients were diabetic nephropathy (n = 17), hypertensive damage (n = 13), renovascular (n = 18), glomerulonephritis/glomerulosclerosis (n = 16) (including IgA nephropathy [n = 6]), tubulointerstitial damage (n = 5) and amyloidosis (n = 1). Causes in 10 patients were not certain or under investigation.
There were 25 patients with diabetes mellitus and 53 had documented hypertension (10 of these patients were suboptimally controlled). One patient had stage 1 CKD, with 11 (13%), 35 (42%), 27 (33%) and 9 (11%) patients having stages 2, 3, 4 and 5, respectively. Seventy-two percent were men and the median age for all patients was 67 years. For all patients, median (range) 24 h urinary protein loss was 220 (30–15,600) mg/24 h and median (range) 24 h albumin loss was 60 (<8–10557) mg/24 h (Table 1).
Patient characteristics and median (range) age, 24 h urine volumes and outputs of protein, albumin and creatinine. Prevalence data refers to patients with 24 h urinary loss of protein ≥150 mg/24 h or albumin ≥30 mg/24 h
CKD, chronic kidney disease
Protein:creatinine ratio versus 24 h urine protein
There was a very good correlation between 24 h urine protein loss and PCR in second and third voids and EMUs (Figures 1a–c), and these correlations were very similar for each of the three urine aliquots. ROC curve analysis showed PCR to be a good predictor of both abnormal urine protein loss ≥150 mg/24 h and clinically significant urine protein loss above 300 mg/24 h (Table 2). There were no significant differences between areas under curves (AUC) generated from each of the three urine aliquots (P > 0.05 for all cases), suggesting they were equally good at predicting proteinuria. The ability of PCR to predict or exclude significant 24 h protein loss of ≥500 mg was assessed for each aliquot at various PCR cut-offs (Table 3). For each PCR cut-off, calculated LRs and predictive values were similar between each of the three urine aliquots. At cut-offs of 70 mg/mmol and below, PCR showed good ability in ruling out significant proteinuria denoted by negative likelihood ratios (LR−) of approximately 0.1 or below. The ability to rule in significant proteinuria, denoted by positive likelihood ratios (LR+) of approximately 10 or above, was seen at PCR cut-offs above 50 mg/mmol. All three urine aliquots also showed similar ability in predicting proteinuria for other 24 h outputs of 150, 300 and 1000 mg. PCR cut-offs that gave optimum sensitivities and specificities for predicting proteinuria at these levels are shown in Table 4.
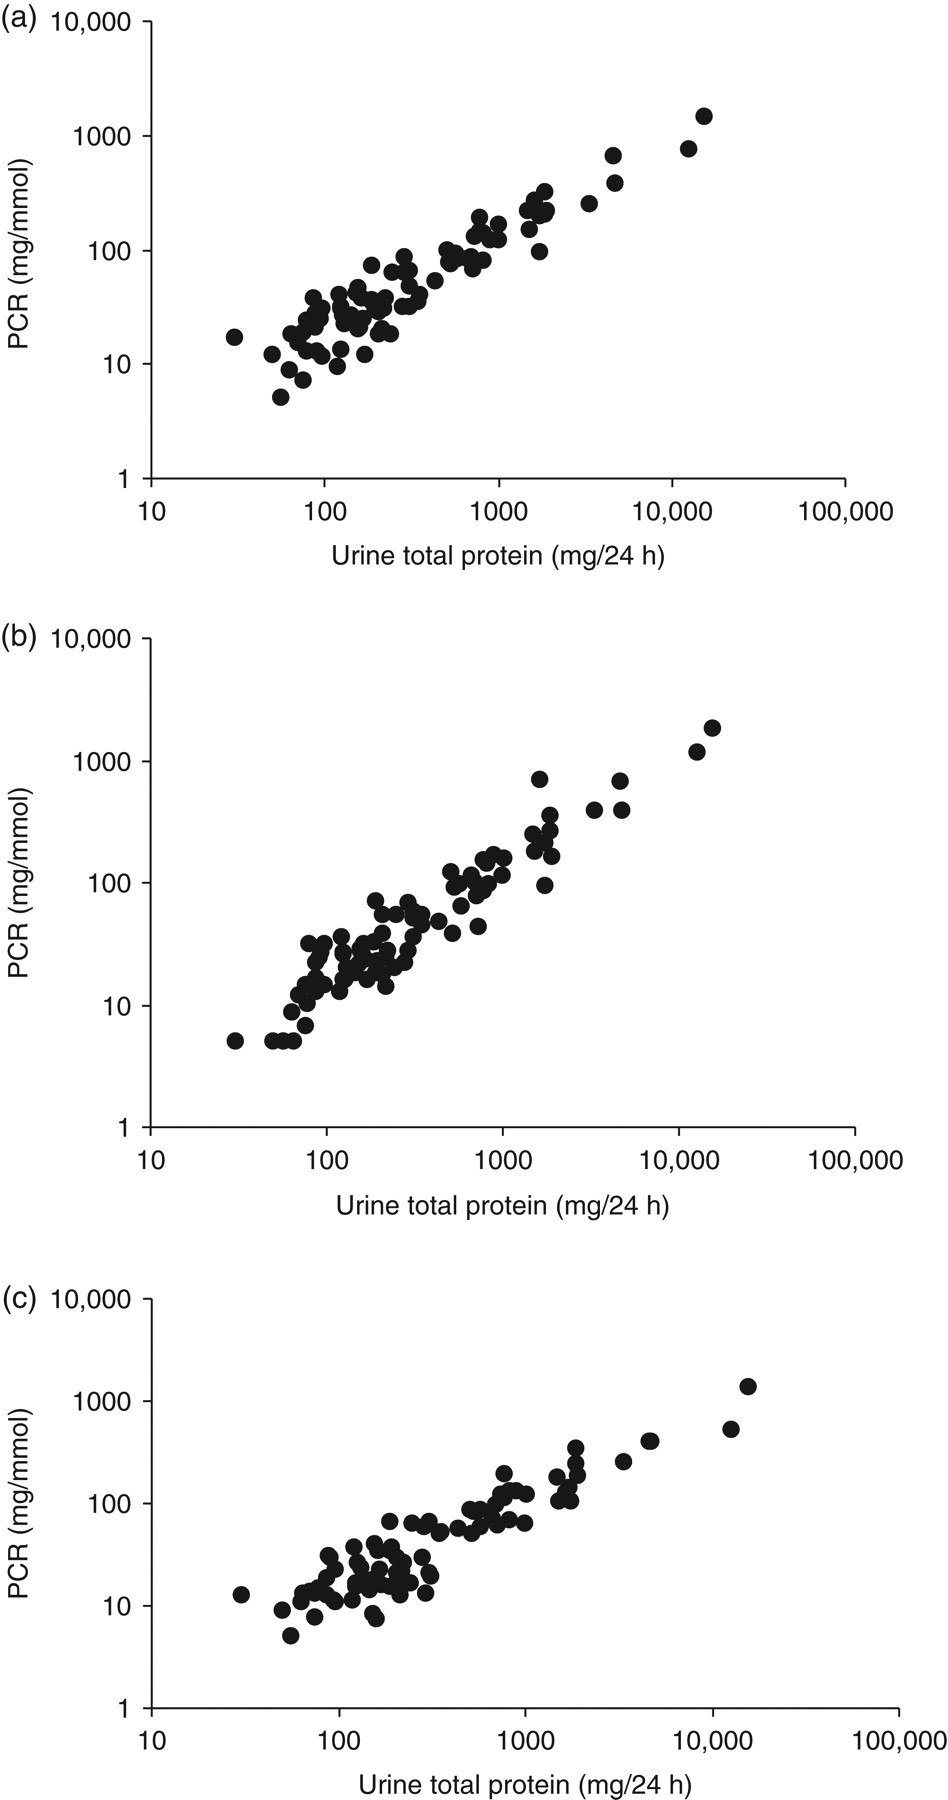
Protein-to-creatinine ratio measured in random urines compared with 24 h urine protein loss. (a) = Second void, (b) = third void, (c) = early-morning urine. Spearman rank correlation coefficients were (a) 0.90, (b) 0.91, (c) 0.87; P < 0.0001 for all
Areas under curves (AUC) generated from receiver operator characteristic analysis showing the ability of protein-to-creatinine ratios (PCRs) from random urines to predict 24 h urine protein loss ≥150, ≥300, ≥500 or 1000 mg/24 h
AUC, areas under curves; CI, confidence interval
(EMU, early-morning urine)
Likelihood ratios (LRs) and predictive values for each urine aliquot in predicting a 24 h urine protein loss of ≥500 mg/24 h
PCR, protein-to-creatinine ratio
(a) = second void, (b) = third void, (c) = early-morning urine. PV+, PV− = positive, negative predictive values. LR+, LR− = positive, negative LRs
Optimum PCR cut-offs for predicting 24 h urine protein losses of 150, 300, 500 and 1000 mg
PCR, protein-to-creatinine ratio; LR+, positive likelihood ratio; LR−, negative likelihood ratio
(a) = second void, (b) = third void, (c) = early-morning urine. LR+, LR− = positive, negative likelihood ratios
Albumin:creatinine ratio versus 24 h urine albumin
For each patient, ACR from second and third voids and EMUs correlated extremely well with 24 h albumin loss (Figures 2a–c) and again correlations were very similar for each of the three urine aliquots. ROC curve analysis showed that ACR in each random urine adequately predicted a 24 h albumin loss of ≥30, ≥300 and ≥700 mg (Table 5). EMU, and second and third voids were equally good at predicting albuminuria, as there was no significant difference between AUCs generated from each of the three urine aliquots (P > 0.05 for all cases). Using an ACR cut-off of 30 mg/mmol, all three urine aliquots showed a similar good performance in being able to rule in or rule out significant albuminuria (≥300 mg/day), denoted by LR+ >10 and LR− <0.1, respectively (Table 6). All three urine aliquots showed similar ability in predicting albuminuria for 24 h outputs of 300 and 700 mg. ACR cut-offs that gave optimum sensitivities and specificities for predicting albuminuria at these levels are shown in Table 7.
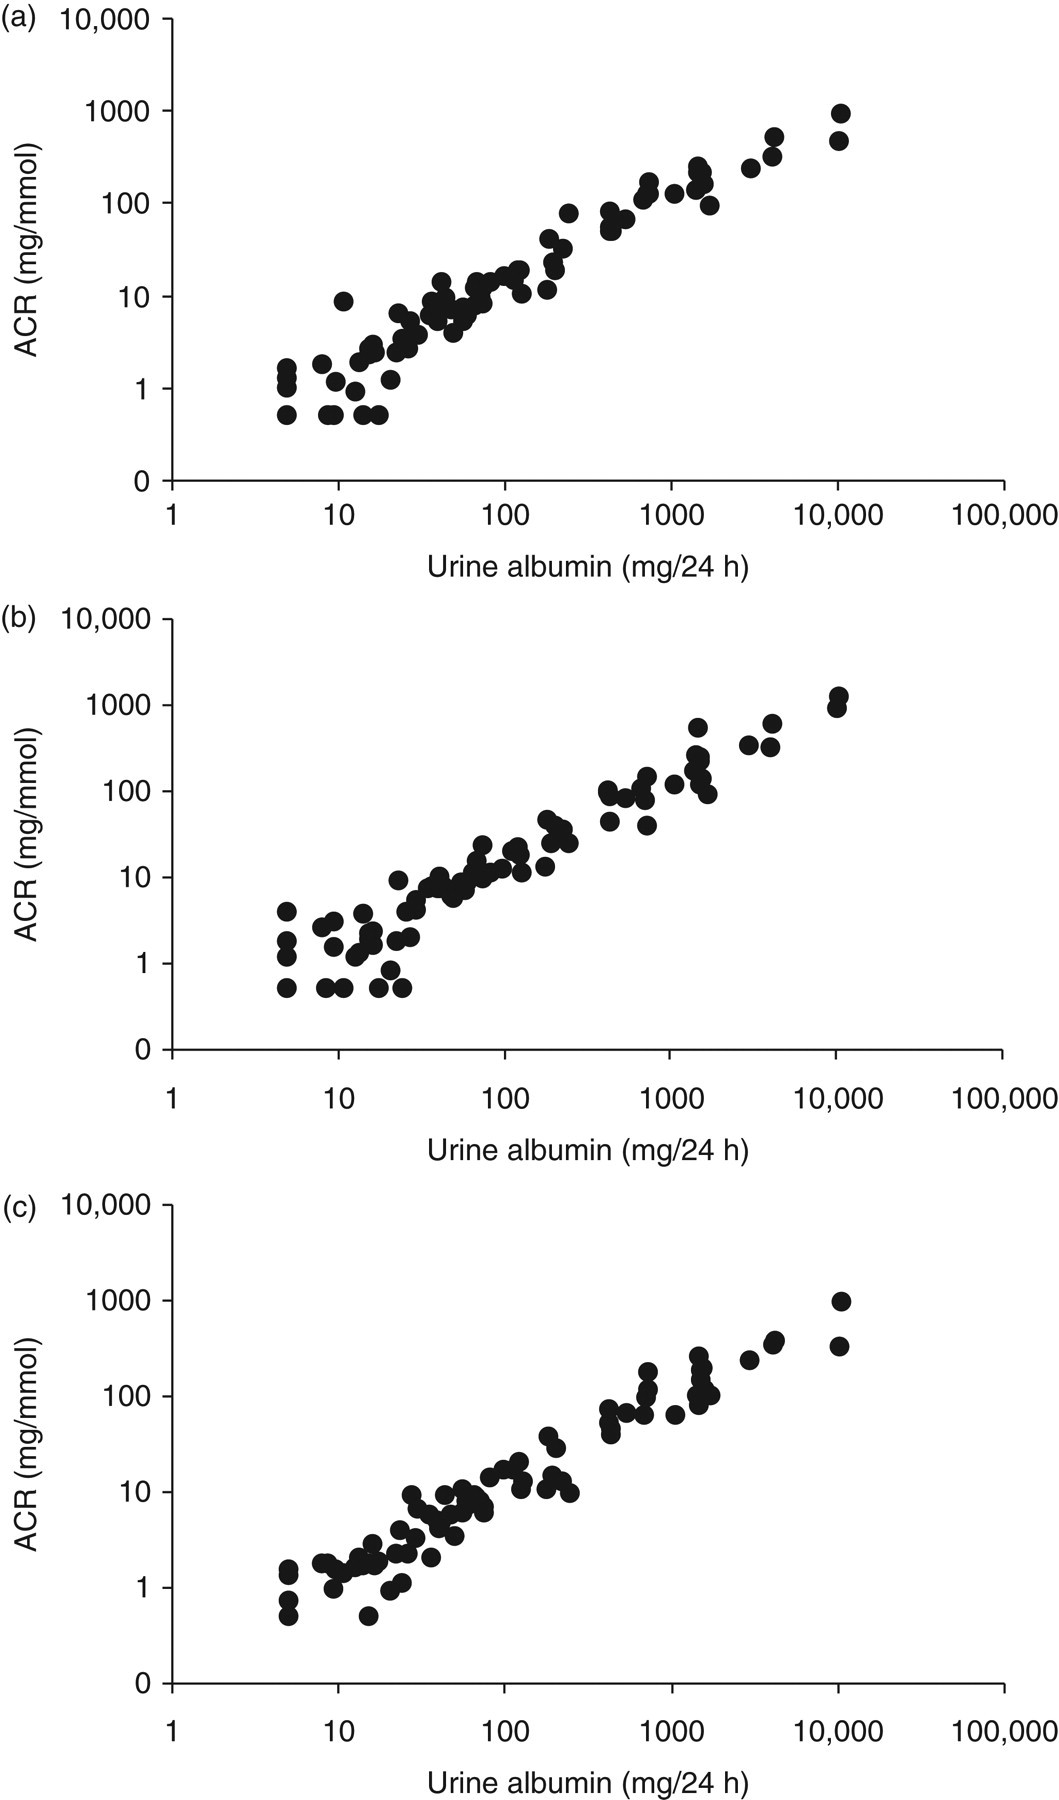
Albumin-to-creatinine ratio measured in random urines compared with 24 h urine albumin loss. (a) = Second void, (b) = third void, (c) = early-morning urine. Spearman rank correlation coefficients were (a) 0.97, (b) 0.96, (c) 0.97; P < 0.0001 for all
AUCs generated from ROC analysis showing the ability of ACRs from random urines to predict 24 h urine albumin losses ≥30, ≥300 and ≥700 mg/24 h
AUC, areas under curves; CI, confidence interval; ACR, albumin-to-creatinine ratio
(EMU, early-morning urine)
LRs and predictive values for each urine aliquot in predicting a 24 h urine albumin loss of ≥300 mg/day
ACR, albumin-to-creatinine ratio; LR, likelihood ratio;
(a) = second void, (b) = third void, (c) = early-morning urine. PV+, PV−= positive, negative predictive values. LR+, LR− = positive, negative LRs
Optimum ACR cut-offs for predicting 24 h urine albumin outputs of 30, 300, and 700 mg
ACR, albumin-to-creatinine ratio
(a) = second void, (b) = third void, (c) = early-morning urine. LR+, LR− = positive, negative likelihood ratios
Total protein versus albumin
Figure 3 shows the relationship between albumin and total protein in 24 h urines (n = 83). At significant urinary total protein losses (>1000 mg/24 h), there was a good correlation (Spearman's r = 0.87, P < 0.0001) between the two with albumin contributing to the majority of the total protein present (median 89%, 95% range 67–104%). With urinary losses >1000 mg/24 h, the Cusum linearity test showed a linear relationship between the two (P > 0.1). At lower urinary protein losses (<1000 mg/24 h), albumin as a percentage of total protein was much more variable (Spearman's r = 0.71, P < 0.0001, median 27%, 95% range 2–92%) and the linear relationship between the two was lost (Cusum linearity test, P < 0.01).
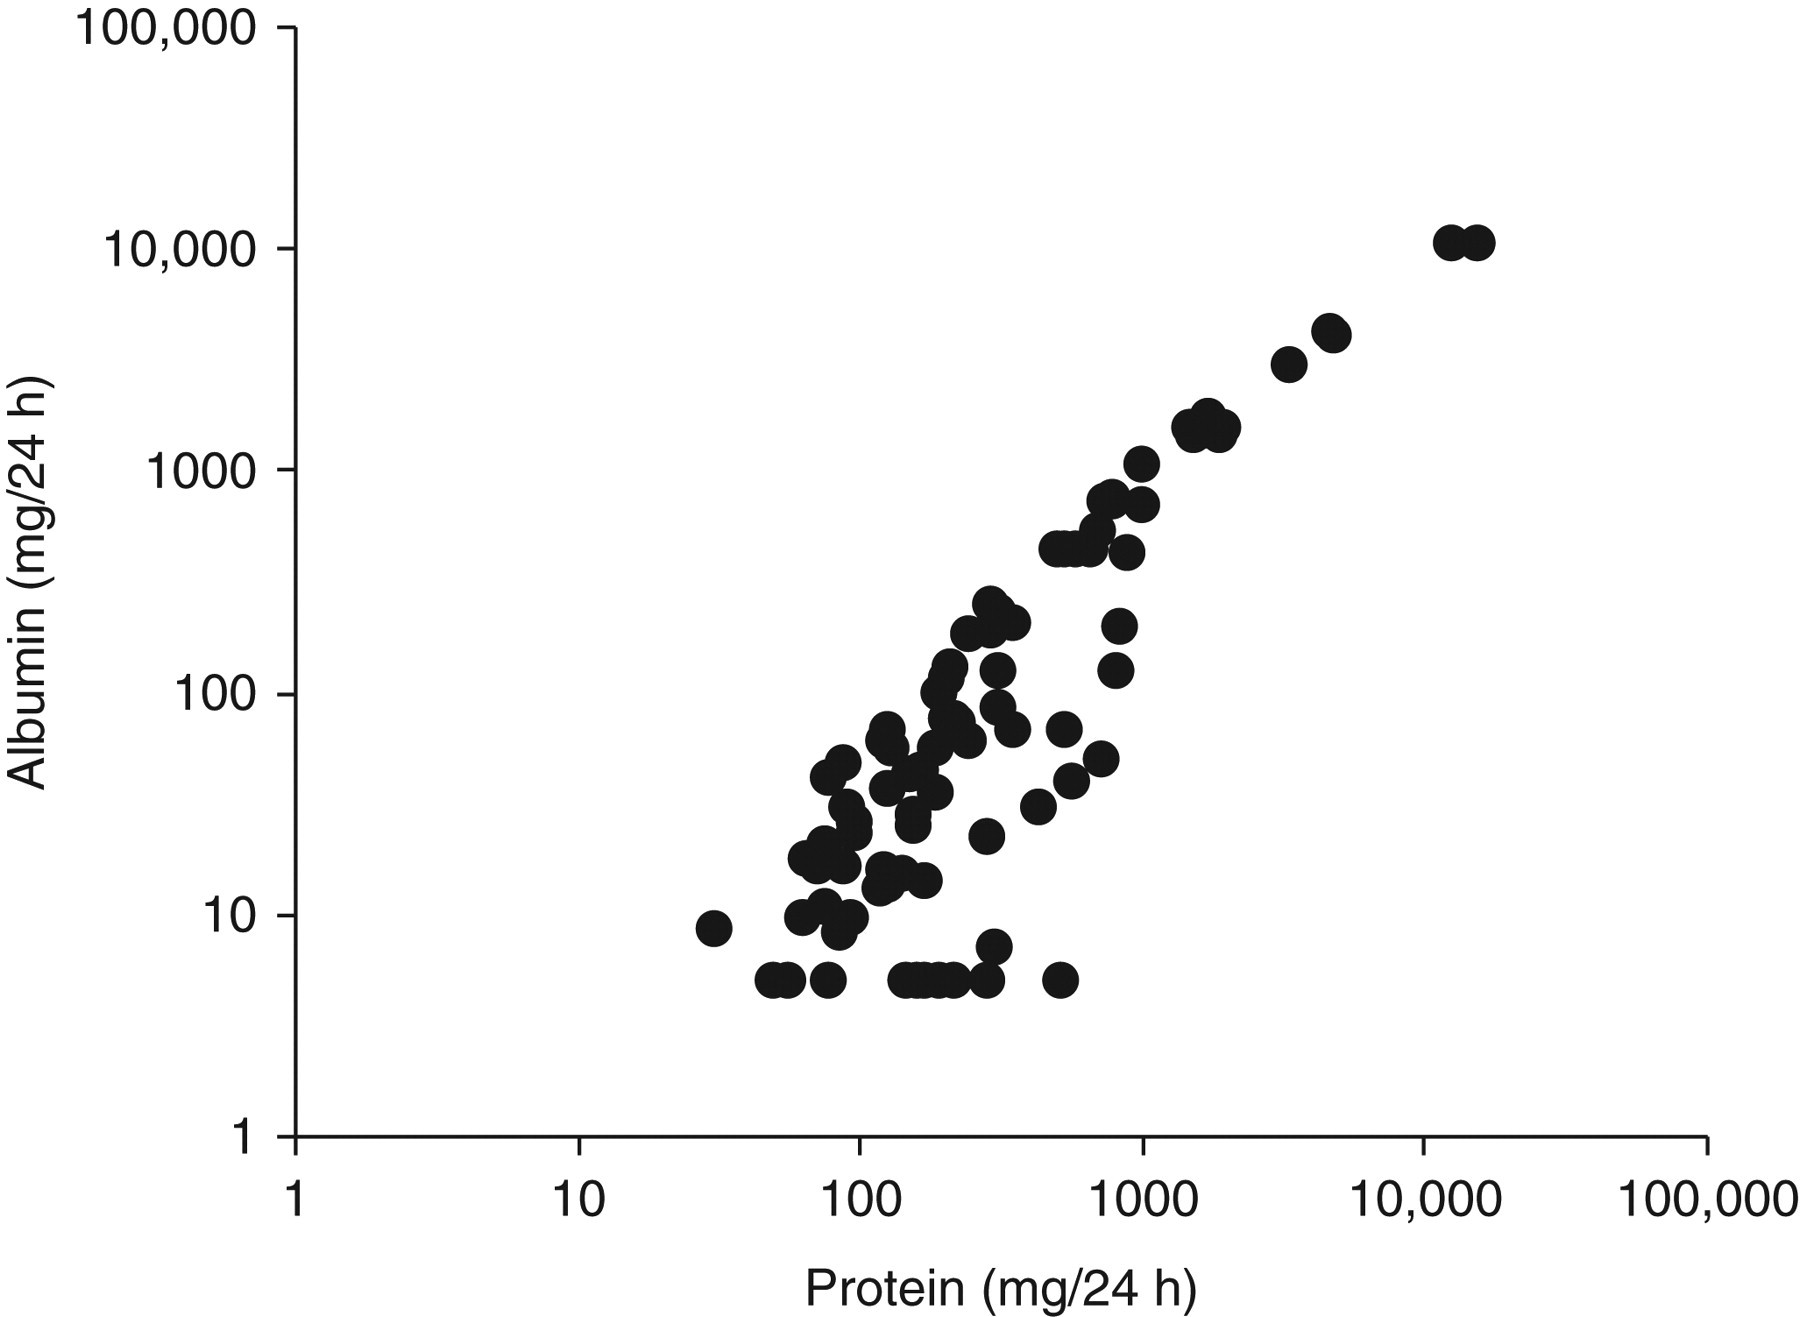
Relationship between albumin and total protein in 24 h urines (n = 83). Samples with undetectable albumin levels have been assigned a 24 h value of 5 mg
Twenty-nine out of 83 patients had evidence of clinically significant proteinuria with urine protein ≥500 mg/24 h. Six of these samples had 24 h urinary albumin losses <300 mg (range <8–196 mg). There were no patients with urine albumin ≥300 mg/24 h and urine protein < 500 mg/24 h. Similarly 15 patients had evidence of heavy proteinuria with urine protein ≥1000 mg/24 h with only one having urine albumin levels lower than 700 mg/24 h (684 mg/24 h). Three patients had urine albumin >700 mg/24 h and urine protein lower than 1000 mg/24 h (values between 740 and 780 mg/24 h). Table 8 shows optimum sensitivities and specificities for random urine ACR in predicting 24 h protein outputs of 150, 300, 500 and 1000 mg.
Optimum albumin-to-creatinine ratio cut-offs for predicting 24 h urine protein outputs of 150, 300, 500, 1000 mg
ACR, albumin-to-creatinine ratio
(a) = second void, (b) = third void, (c) = early - morning urine. LR+, LR− = positive, negative likelihood ratios
Discussion
Collection of 24 h urine samples is cumbersome and prone to errors, hence analyte measurement in random urine is often proposed with correction for variation in urine flow rate by expressing results as a ratio to creatinine concentration. It was not possible to formally assess completeness of collection of 24 h samples, particularly as there is little published data for patients with CKD. Although samples were from a well-motivated group of patients who regularly made 24 h urine collections, a pragmatic approach was adopted to reject samples that had either unusually low urine volume or creatinine outputs, on the premise that they may not have been a complete 24 h collection. As a result, only 71% of patients enrolled in this study returned or provided viable samples highlighting the inconvenience and errors associated with 24 h urine collection.
Several studies have assessed the benefits of using random urine PCR as a surrogate for 24 h protein measurement, but relatively few of these have involved patients with kidney disease, or have examined the ability of PCRs or ACRs to rule in or rule out abnormal protein loss. Most studies have shown good correlations between PCR and 24 h protein loss and have demonstrated adequate sensitivities and specificities when PCR was used to predict 24 h proteinuria. However, cut-offs used to define abnormal PCR or abnormal protein loss have varied widely. Thus, Gai et al. 27 in predicting a 24 h urine protein loss >150 mg from a PCR ≥ 11.3 mg/mmol, obtained sensitivities and specificities of 91% and 75%, respectively. Similarly Lane et al., 30 using thresholds of between 300 mg/L and 3.0 g/L to define abnormal 24 h proteinuria, obtained sensitivities between 85% and 93% and specificities between 80% and 91% at varying PCR cut-offs.
Many studies have used a 24 h protein output of greater than 300 mg to indicate clinically significant proteinuria. 13 Recent guidelines have used higher levels of 500 mg/24 h and 1 g/24 h (roughly equivalent to PCR of 50 and 100 mg/mmol, respectively) to denote significant proteinuria and to define levels at which treatment should be instituted. 9,12,38 In this study, we have demonstrated good correlation between 24 h urine protein loss and PCR in second and third voids and EMUs (Figures 1a–c). Furthermore, ROC curve analysis at multiple 24 h protein cut-offs showed PCR to be a good predictor of 24 h urine protein loss (Table 2). Importantly, there was no statistical difference between areas under the curves generated from EMU, second or third voids suggesting any would be equally effective as a substitute for the 24 h urine. In addition, the data show that, by using an appropriate cut-off, PCR can be a reliable tool for ruling in or ruling out abnormal 24 h protein loss. For example, at PCR greater than 50 mg/mmol, there is strong evidence to be able to rule in significant proteinuria of 500 mg/24 h or more, demonstrated by LR+ greater than 10. Likewise at PCR below 50 mg/mmol, there is strong evidence to be able to rule out significant 24 h protein loss, as demonstrated by LR− <0.1 (Table 3). Similarly random urine PCR may be used effectively to rule in or rule out other levels of proteinuria (Table 4).
ACR now has an established role in the diagnosis and monitoring of diabetic nephropathy. 20 There are an increasing number of studies using ACR in patients with hypertension 8,39–41 but there are few studies in other, non-diabetic groups. Most studies, however, have shown that random urine ACR correlates well with 24 h albuminuria and demonstrate adequate sensitivity and specificity in predicting 24 h albuminuria. 42–45 This study in renal outpatients has also shown good agreement between ACR and 24 h albumin loss (Figure 2) and ACR from each of the first, second and third voids predict 24 h albumin output equally well (Table 5). An ACR cut-off of 30 mg/mmol accurately rules in or out significant albuminuria ≥300 mg/24 h, as denoted by LR+ >10 or LR− <0.1, respectively (Table 6). Lower cut-offs of between 4 and 6 mg/mmol could be used to rule in or rule out albumin loss in the ‘microalbuminuric’ range, which is perhaps of greater importance in screening for renal disease (Table 7).
Most guidelines state that EMU is the preferred sample for ACR and PCR measurements, but this study has not found any advantage in using EMU over random samples. Reports in the literature are conflicting with some advocating EMU 20,46 and others random urine samples. 18,47 There are benefits to both patients and clinicians if random ‘spot’ urines can be relied upon to accurately rule in or rule out proteinuria and provide an accurate quantitative measurement of proteinuria.
Albumin as a percentage of total protein is highly variable at lower levels of proteinuria (Figure 3) due to factors including a variable contribution from the tubular Tamm Horsfall glycoprotein, glomerular-filtered low molecular weight proteins and, in some patients, paraproteins. As urinary total protein levels approach and exceed 1 g/24 h, the relative contribution from albumin increases and the ratio between albumin and total protein becomes relatively constant. These findings are in agreement with other published reports. 14,48,49
Recent guidelines have recommended the use of urine albumin measurement in preference to total protein. 9,10,12 Some also quote approximate equivalence points for urine protein and albumin. For example, the National Institute for Health and Clinical Excellence 12 quote ACRs of 30 and 70 mg/mmol to be roughly approximate to 24 h protein outputs of 500 mg and 1 g, respectively. The Scottish Intercollegiate Guidelines Network 38 quote an ACR of 30 mg/mmol being equivalent to protein loss of 450 mg/24 h. Thresholds for diagnosis and treatment of clinically significant proteinuria have therefore been suggested at ACR levels of 30 and 70 mg/mmol (approximately equivalent to 24 h albumin outputs of 300 and 700 mg). 9,10,12 Our data suggest that either urine albumin or urine total protein measurements would be equally good in assessing or monitoring significant proteinuria, particularly for protein outputs greater than 1 g/24 h. Below 1 g/24 h, the situation is less clear as the correlation between albumin and total protein is more variable. This is highlighted by the data in Table 8. Optimum ACR cut-offs for predicting 24 h protein outputs at levels <1 g/24 h are much lower than might be expected. Furthermore, six out of 29 patients with significant proteinuria >500 mg/24 h had albumin outputs lower than the 300 mg/24 h threshold. If these data can be extrapolated to other patient populations, individuals would have been potentially misclassified using guidelines based solely on ACR. This is in contrast to Collier et al., 49 who found few discordant ACR and PCR results in a study of 117 patients.
ACR measurements, however, have distinct advantages due to the superior analytical sensitivity of assays. This is especially true for detecting early nephropathy in diabetics and possibly other high-risk groups, for example, patients with hypertension or cardiovascular disease.
This study has been limited by its relatively small size and being restricted to one centre using hospital patients with kidney disease. Owing to the small sample size, there were insufficient results to delineate the data by gender or renal pathology. In diabetic patients, it has been demonstrated that gender-specific cut-off values improve the diagnostic performance of ACR. 21,50 Use of such cut-offs may enhance the performance of ACR in patients with kidney disease. Further work needs to be undertaken to provide such data and to establish whether our data can be extrapolated to other patient groups.
In summary this study has shown that, in patients with kidney disease, both random urine PCR and ACR accurately predict proteinuria and albuminuria, respectively. By careful choice of cut-offs these ratios can be used to rule in or rule out abnormal 24 protein or albumin loss. If either ACR or PCR is to be used as a first-line screening test for evidence of renal disease, then the ratios could clearly be valuable as a rule-out test but early detection of proteinuria in selected groups of patients may be best achieved using ACR. If the tests are to be used for monitoring the level of proteinuria or albuminuria in established renal disease, they can then be used as surrogates for 24 h measurements. The finding that random urine aliquots are equally as accurate as EMU simplifies sample collection for both patients and health-care workers.
DECLARATIONS