
Abstract
Background
Analysis of copper and zinc in serum is commonly performed using atomic absorption spectrometry (AAS); however, these methods are often not readily available in smaller laboratories. Randox colorimetric assays for copper and zinc in serum were evaluated on the Thermo Electron Data Pro analyser against flame AAS methods.
Methods
Copper and zinc were measured in 48 serum samples using the Randox colorimetric copper (CU2340) and zinc (ZN2341) assays on the Data Pro analyser and the results compared with those from a Varian Spectra 880 atomic absorption spectrometer. A smaller set of samples (n = 15) were also analysed colorimetrically for zinc on the Roche Cobas Mira.
Results
Linear regression analyses of Bland and Altman plots from the Data Pro – AAS comparison gave the following results for copper: correlation r = 0.6669 (P < 0.01), slope = −0.2499 (P < 0.01), intercept = 3.219 (P < 0.01). For zinc, results were as follows: correlation r = 0.1976, slope = 0.1807, intercept = −1.922. For the smaller set of samples, the Cobas Mira – AAS comparison for zinc gave correlation r = 0.4379, slope = 0.5294, intercept = −4.074. The results indicated significant systematic and fixed bias between the colorimetric copper and the AAS method.
Conclusion
Performances in comparison to AAS methods indicated the colorimetric methods, as used, are unsuitable for the accurate determination of copper and zinc in human serum.
Introduction
Serum concentrations of copper and zinc are the most frequently used biomarkers of the status of these essential trace elements and are useful in assessing both deficiency and toxicity.
Severe copper deficiency is rare, but may be seen in low birth weight infants and in patients receiving total parenteral nutrition (TPN) with inadequate copper 1 ; marginal copper deficiency, however, is thought to be more common and is of increasing interest due to the association of low copper status with haematological abnormalities, 2 altered immunity, 3 hypercholesterolaemia and cardiovascular disease. 4 As well as resulting from low dietary intakes, deficiency may also arise from reduced absorption (e.g. coeliac disease), the rare X-linked Menkes syndrome and high zinc intakes. 1 Although uncommon, copper toxicity generally occurs as a result of accidental ingestion of copper salts, the consumption of drinking water with high copper content or industrial exposure. Wilsons disease, a hereditary condition of altered copper metabolism, is also a rare cause of excessive copper accumulation in major organs. 1
Zinc, as a component of >300 proteins, 5 has a wide range of roles in the body. Mild zinc deficiency is emerging as a significant public health concern throughout much of the world, especially in developing countries. 6 Arising from inadequate diets and poor bioavailability, it is associated with increased morbidity with stunted growth and development, 7,8 delayed wound healing 9 and altered immune function. 10 Severe zinc deficiency, classically seen in the rare genetic disorder of zinc absorption, acrodermatitis enteropathica, but also resulting from inadequate zinc in TPN formulations and chelation therapy, causes major dermal, gastrointestinal and neurological disorders. 11 Zinc toxicity may occur due to excessive consumption of zinc supplement preparations, from contaminated food and drink sources and from industrial exposures. Symptoms of zinc toxicity include major gastrointestinal effects such as nausea, vomiting, gastric pain and gastroenteritis. 11
Analysis of serum copper and zinc concentrations is most commonly performed using atomic absorption spectroscopy (AAS) techniques. However, such methods may be beyond the capacity of small or isolated laboratories, so a reliable and rapid alternative method for use on small analysers could prove valuable. Colorimetric methods, such as those using the chromogen 4-(3,5-dibromo-2-pyridylazo)-N-Ethyl-N-(3-sulphopropyl) aniline (3,5-di-Br-PAESA) for copper, and the chromogen 2-(5-bromo-2-pyridylazo)-5-(N-propyl-N-sulphopropylamino)-phenol (5-Br-PAPS) for zinc and available in kit form from Randox (catalogue numbers CU2340 and ZN2341, respectively) are potentially suitable for such an application. A search of the literature revealed a lack of comparative studies versus AAS for these reagent kits on small analysers.
Material and methods
Randox CU2340 and ZN2341 assay buffers, chromogens, standards and pretreatment reagents were used (Randox Laboratories Ltd, Crumlin, UK). Forty-eight blood samples were collected into Vacutainer Trace Element Free serum tubes (Becton Dickinson, Rutherford, NJ, USA); and after centrifugation at 1335 g for 15 min, serum aliquots from these tubes were stored at 4°C. All laboratory glassware and consumables were acid washed in 1% nitric acid; collection and storage methods were assessed to eliminate all possible sources of contamination prior to evaluation. Comparison data were subject to Bland and Altman analysis, 12 using Microsoft Excel 2003, with statistical significance set at P < 0.05. Ethics approval was provided by the Human Research Ethics Committee (Tasmania) Network.
Atomic absorption spectrophotometry
The flame atomic absorption (FAAS) methods were based on those of Meret and Henkin 13 and performed well in an external quality assurance program (QAP). Results, when compared with those from the QAP program (Quality Control Technologies, Charlestown, Australia), placed the copper FAAS method within 0.56 standard normal deviates (SND) and zinc within 0.37 SND of the distribution means. Analysis was performed using a Spectra 880 atomic absorption spectrometer (Varian Inc, Palo Alto, CA, USA) maintained in a National Association of Testing Authorities (NATA) accredited hospital laboratory. For copper, a wavelength of 324.8 nm, a slit width of 0.5 nm and a lamp current of 5.0 mA was employed. Three hundred microlitres of sample were diluted in 600 μL of deionized water prior to analysis.
Calibration for the analysis used the standard addition method; 0, 25, 50 and 75 μL of a 628 μmol/L copper nitrate working standard was added to 1 mL pooled human serum to produce concentrations of 0, 14.3, 28.5 and 42.8 μmol/L, respectively.
Zinc was also measured using the Varian Spectra 880; at a wavelength of 213.9 nm, using a slit width of 1.0 nm and lamp current of 5.0 mA. Again, sample volumes of 300 μL were diluted in 600 μL of deionized water prior to analysis. For calibration, a 612 μmol/L zinc nitrate standard was added in volumes of 0, 25, 50 and 75 μL to 1 mL pooled human serum to produce concentrations of 0, 13.9, 27.8 and 41.7 μmol/L.
Colorimetric assay on the data pro
Colorimetric analysis was performed using the Thermo Electron Data Pro analyser (Melbourne, Victoria, Australia) with parameters based on those outlined in the Randox package inserts (Table 1). Copper was determined using a direct serum measurement at 37°C against a reagent blank and single point calibration. Using this method, copper is released from caeruloplasmin by a reducing agent (ascorbic acid), which reacts to form a chelate with the chromogen 3,5-di-Br-PAESA with a resulting rise in absorbance measured at 590 nm.
Colorimetric assay parameters as stated in Randox package notes and as used on the Data Pro and Cobas Mira analysers
*Sample for copper analyses was serum; sample for zinc analyses was deproteinated serum
Prior to zinc analysis, samples and standards underwent protein precipitation; 500 μL of 370 mmol/L trichloroacetic acid was mixed with 500 μL of serum and centrifuged at 8000 g for 12 min. The supernatant was assayed at ambient temperature against a reagent blank with single point calibration. Zinc in the sample forms a chelate with the chromogen 5-Br-PAPS and the resulting rise in absorbance is measured at 550 nm.
In an attempt to improve the calibration procedure of both assays, a simple multipoint aqueous calibration curve was utilized. Stock standard solutions of 35 mmol/L copper nitrate and 35 mmol/L zinc nitrate were used; dilution of 5, 10 and 20 μL of each stock standard to 10 mL resulted in working standards of 17.5, 35 and 70 μmol/L, respectively.
Colorimetric assay on the Cobas Mira
The Cobas Mira (Roche Diagnostics Ltd, Rotkreuz, Switzerland) was also used to measure zinc in a smaller set of samples, using the same method, with parameters supplied by Randox (Table 1). These samples also underwent the serum deproteinization step described earlier.
Results
Pipette precision testing of the Data Pro analyser using assay sample volumes of potassium dichromate and combined reagent and chromogen volumes of deionized water gave coefficient of variations of 0.80% for the copper protocol and 0.50% for the zinc protocol (n = 12).
Intra- and inter-assay precision data for both methods is presented in Table 2. Two-level Lyphochek (Bio-Rad, Hercules, CA, USA) and Seronorm (Sero, Billingstad, Norway) quality control materials were utilized during analysis of copper and zinc by colorimetric methods and FAAS, respectively (Table 2).
Intra- and inter-assay precision data for flame atomic absorption and colorimetric analysis using quality control material and pooled serum samples
FAAS, flame atomic absorption; CV, coefficient of variation
*Different batches of pooled sera were used for each methods inter-assay precision run
FAAS QC Level 1, 2 = Seronorm Lot # 0508348 and 0610542
Colorimetric QC Level 1, 2 = Lyphochek Lot # 14121 and 14122
Least-squares regression analysis for the comparison of the colorimetric copper method with FAAS (Figure 1a) yielded the following equation:

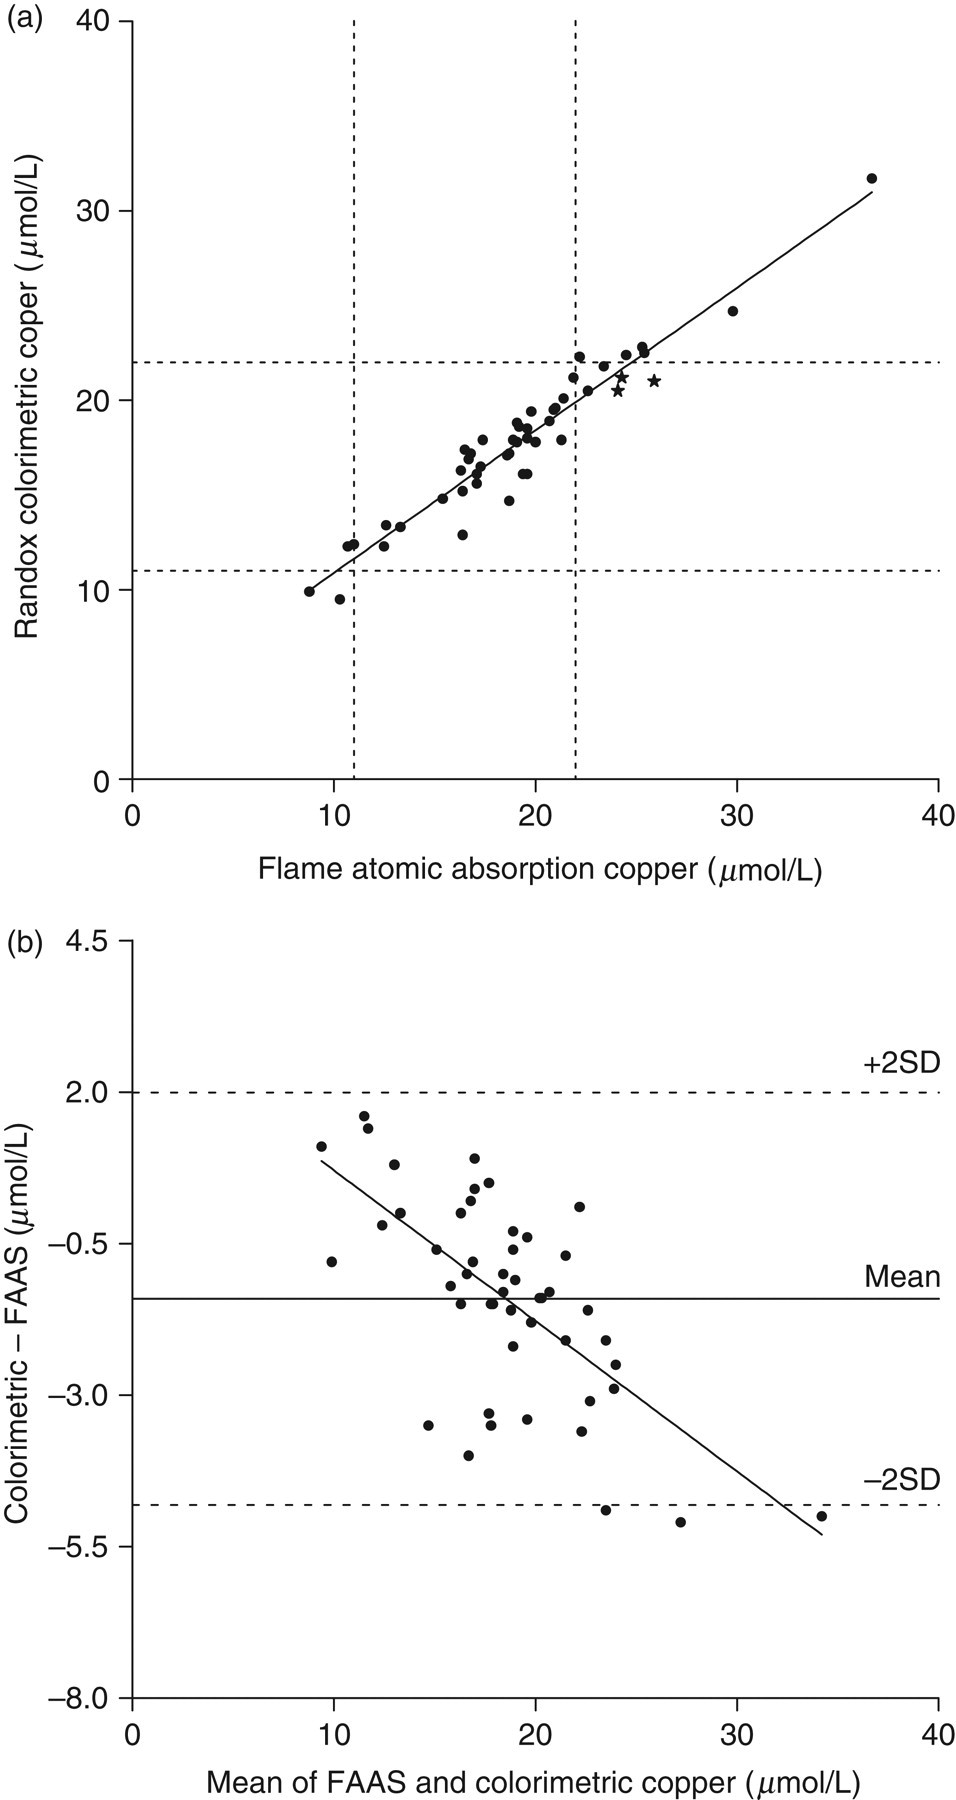
(a) Least squares linear regression analysis of copper measured colorimetrically on the Data Pro analyser compared to the flame atomic absorption method. The analysis yielded a regression line equation of: y = 0.75x + 3.4 μmol/L (r = 0.9227, n = 48, P < 0.01). Dashed lines represent the upper and lower reference range limits of 22 μmol/L and 11 μmol/L respectively. (b) Bland and Altman analysis of copper comparison data: correlation r = 0.6669 (P < 0.01), slope = −0.2499 (P < 0.01), intercept = 3.219 (P < 0.01). Statistically significant systematic and fixed bias was found, with a mean difference of −1.4 ± 3.4 μmol/L
Colorimetric zinc using the Data Pro compared with the FAAS method (Figure 2a) produced the following regression line

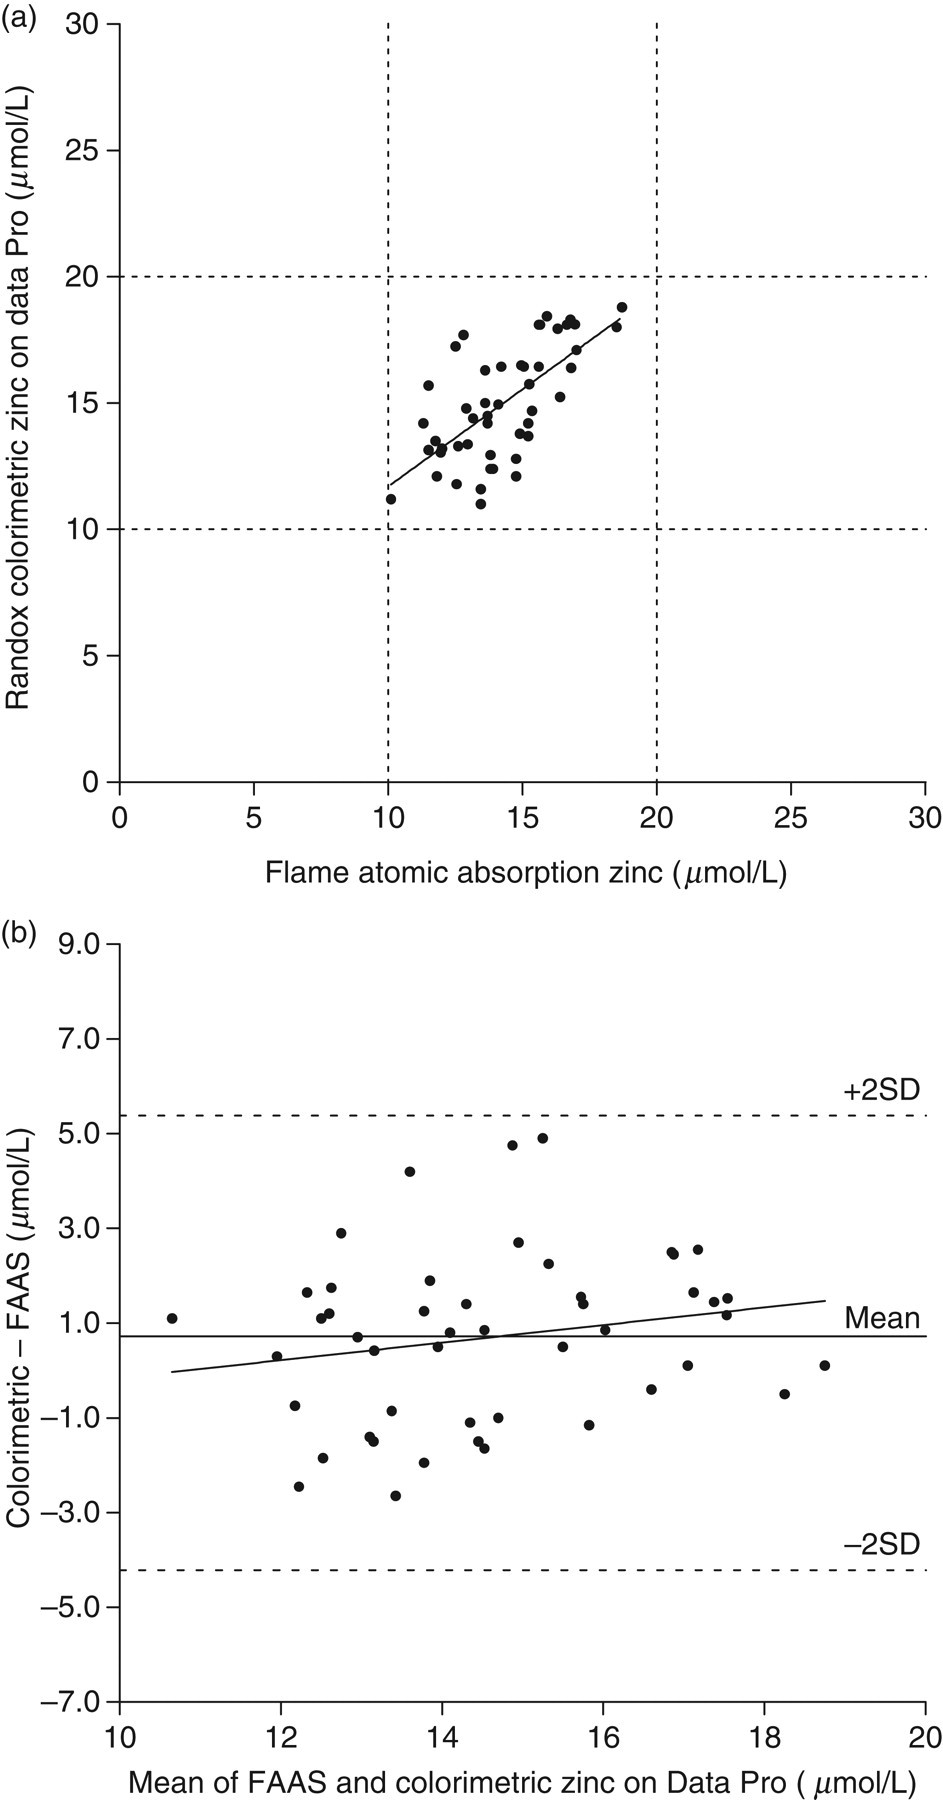
(a) Least squares linear regression analysis of zinc measured colorimetrically on the Data Pro analyser compared to the flame atomic absorption method. The regression line for the analysis was: y = 0.77x + 4.0 μmol/L (r = 0.4376, n = 48, P < 0.01). Dashed lines represent the upper and lower reference range limits of 20 μmol/L and 10 μmol/L respectively. (b) Bland and Altman analysis of zinc comparison data: correlation r = 0.1976 (P = 0.18), slope = 0.1807 (P = 0.18), intercept = −1.922 (P = 0.33)
On the Cobas Mira, the comparison for the colorimetric zinc method demonstrated a poorer correlation with FAAS (Figure 3a), producing the regression line:

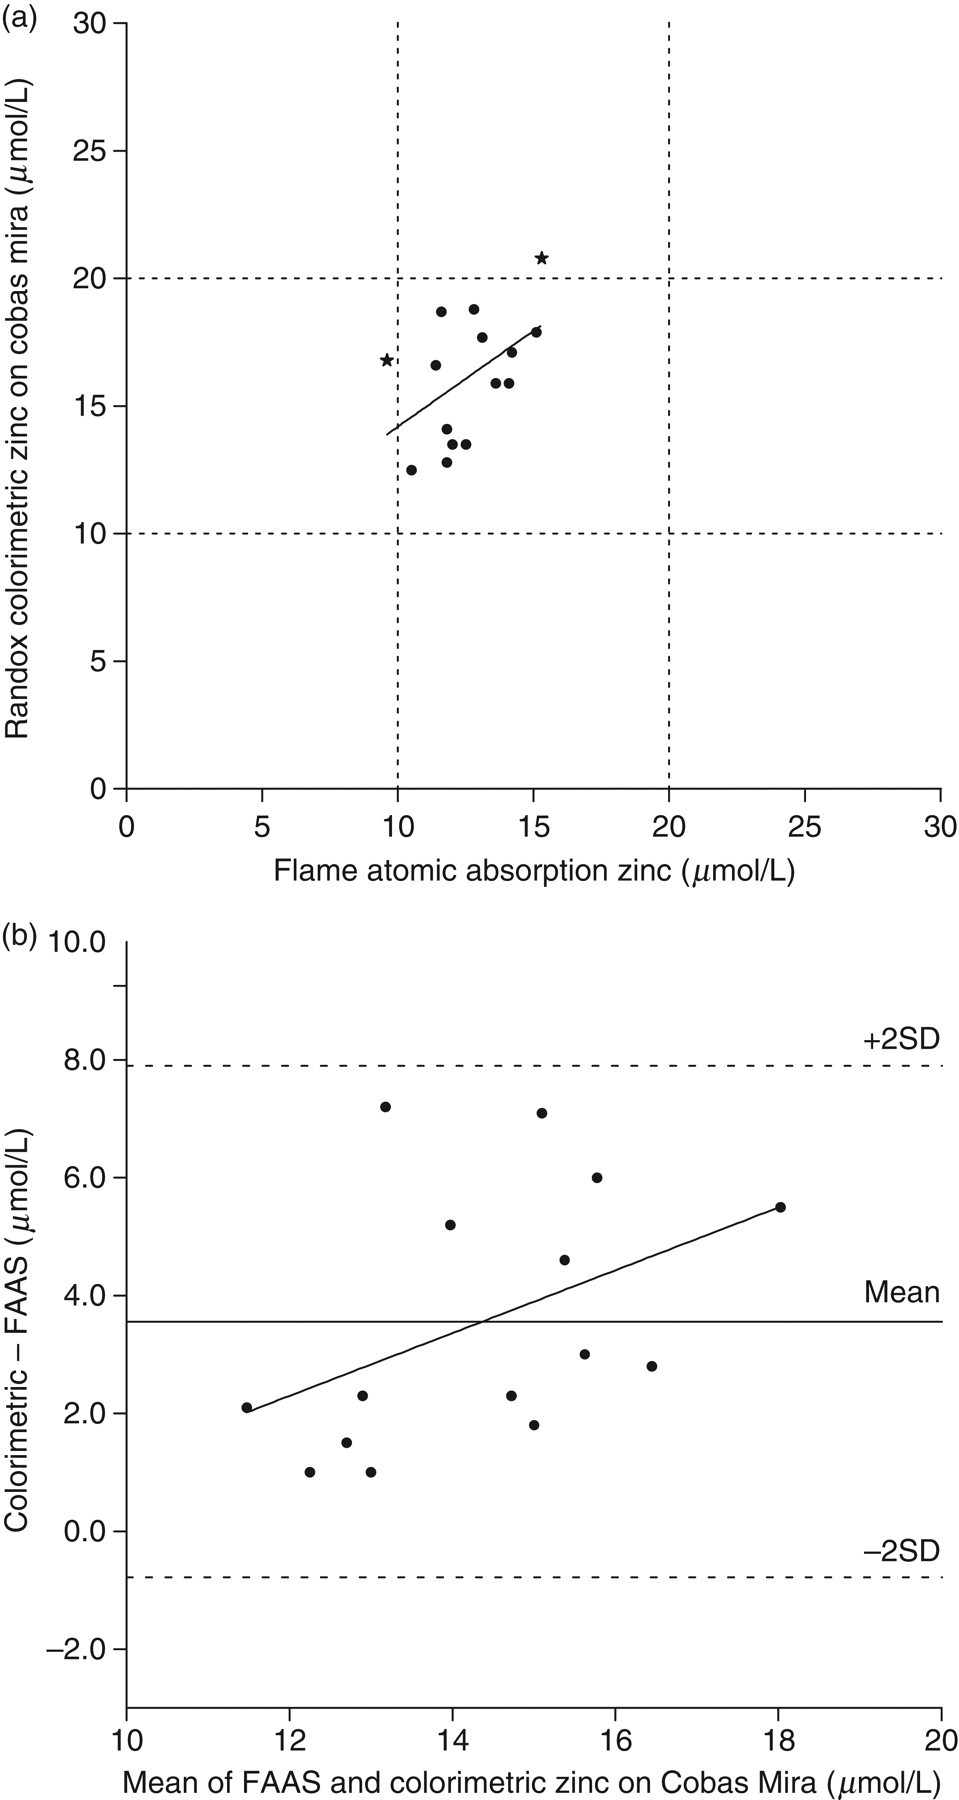
(a) Least squares linear regression analysis of zinc measured colorimetrically on the Cobas Mira analyser compared to the flame atomic absorption method. The regression line for the analysis was: y = 0.76x + 6.6 μmol/L (r = 0.2541, n = 15, P = 0.06). Dashed lines represent the upper and lower reference range limits of 20 μmol/L and 10 μmol/L respectively. (b) Bland and Altman analysis of zinc comparison data: correlation r = 0.4379 (P = 0.10), slope = 0.5294 (P = 0.10), intercept = −4.074 (P = 0.37)
Three samples determined by FAAS to be above the normal adult upper reference value for copper of 22 μmol/L were misclassified as normal by the colorimetric method (denoted by stars in Figure 1a). The colorimetric zinc method on the Cobas Mira misclassified two samples; of these two, FAAS determined one sample to be below and one sample to be within the reference range, but these were determined to be within and above the reference range, respectively, by the colorimetric method (denoted by stars in Figure 3a).
Results from linear regression analysis of Bland and Altman plots (Figures 1b, 2b and 3b) for the copper method using the Data Pro and the zinc method on both the Data Pro and the Cobas Mira are presented in Table 3. These results indicate significant systematic and fixed bias between the colorimetric and FAAS methods for copper. The evaluation of the zinc colorimetric method, however, showed that systematic and fixed biases did not reach statistical significance. The smaller comparison using the zinc method on the Cobas Mira indicated the error observed in the evaluation on the Data Pro was not unique to the one analyser.
Results from Bland and Altman analysis
Discussion
Copper
The Bland and Altman analysis of the copper data (Figure 1b) determined that a statistically significant negative systematic bias and a positive fixed bias affected the colorimetric copper method, as suggested by the initial linear regression of the comparison data (Figure 1a). The spread of data points across a reasonably wide range of copper concentrations enabled the analysis to reveal these biases between the colorimetric and FAAS methods leading to the conclusion that the colorimetric method was unsuitable for our purposes.
Zinc
A major issue with our zinc data was that it only covered about half the concentration range of the corresponding copper data; the zinc data ranged from approximately 10 to 19 μmol/L, whereas the copper data ranged from about 9 to 37 μmol/L. The smaller range for zinc meant that the systematic bias equivalent to 77% of the FAAS result and a fixed positive bias of 4.0 μmol/L, as suggested by the linear regression equation associated with the data plotted in Figure 2a, was lost when the Bland and Altman study was conducted. We confirmed that this kind of effect could be replicated in the corresponding copper data when only copper data points between 10 and 19 μmol/L were subjected to Bland and Altman analysis; the P value of the regression in that modified analysis then rose to insignificance at P = 0.15. We therefore made the decision that on the basis of the linear regression equation for the data in Figure 2a there was enough statistical evidence of systematic and fixed biases between the two zinc methods as to make the colorimetric method unsuitable for our purposes for research measuring zinc levels in a population suspected of having lower than normal levels.
Calibrators
When multipoint calibration procedures were trialled for both methods rather than the supplied single aqueous standard, the comparison with the atomic absorption methods appeared to improve slightly but did not eliminate the sizeable differences evident between the methods. This suggested that the supplied aqueous standards probably did not compensate for the matrix effect of serum in the colorimetric analysis.
Serum calibrators, which have since been recommended by Randox, but are not listed in the standard package inserts, would most likely improve assay performance; in particular for the copper method which in our data exhibited statistically significant systematic bias when compared with FAAS, though it seems likely the zinc method would also improve similarly. The two methods evaluated however, also appear to suffer from substantial random error when performed on the Data Pro analyser; the magnitude of which did not seem entirely attributable to the pipetting imprecision of the Data Pro, but rather may have resulted from individual patient-specific random interference.
The overall performance of the two colorimetric methods as used was such that, even with improvements to the standardization protocol, they do not appear to allow reliable determination of copper or zinc in a complex matrix such as human serum using the Data Pro analyser.
DECLARATIONS