
Abstract
Background
Total immunoglobulin A in saliva (s-IgA) is normally assayed using an enzyme-linked immunosorbent assay. We have investigated methodological issues relating to the use of particle-enhanced nephelometric immunoassay (PENIA) to measure s-IgA in whole unstimulated saliva and determine its reference range.
Methods
Whole unstimulated resting saliva was collected to determine sample stability (temperature, time, effect of a protease inhibitor), limit of quantitation (LOQ), assay precision and analytical variation. The reference range for 134 healthy adults was determined.
Results
Linearity was excellent (4–10.3 mg L−1, P < 0.001; R 2 = 0.997) and without significant bias (mean of −0.7%). The lowest intra- and inter-analytical coefficients of variation were 1.8% and 7.5% and LOQ was 1.4 mg L−1. The concentration of s-IgA is stable at room temperature for up to 6 h, at 4°C for 48 h, at −4°C for two weeks and at −80°C for up to 1.3 yr. There is no evidence that a protease inhibitor increases the stability or that repeated freeze–thawing cycles degrade sample quality. The reference ranges for s-IgA concentration, s-IgA secretion, s-IgA:albumin and s-IgA:osmolality were 15.9–414.5 mg L−1, 7.2–234.9 μg min−1, 0.4–19 and 0.6–8.9, respectively.
Conclusion
Automated PENIA assay of s-IgA is precise and accurate. High stability of collected saliva samples and the ease and speed of the assay make this an ideal method for use in athletic and military training situations. The convenience of measuring albumin and IgA on the same analytical platform adds to the practicability of the test.
Introduction
Total immunoglobulin A in saliva (s-IgA) consists of both the predominant secretory IgA (SIgA) and monomeric IgA, which is mainly derived through passive leakage from serum. SIgA is a dimer, containing part of a polypeptide called secretory component and is found in saliva, sweat, lung fluids, bronchial fluid, gastrointestinal secretions, tears, breast milk and vaginal secretions. 1 Due to the ease of whole saliva collection in military and sporting field situations and s-IgA association with various stressors, our laboratory was interested in assessing s-IgA as a useful indicator of stress and susceptibility to infection, including upper respiratory tract infections (URTIs). 2 It is possible that there is a critical concentration of SIgA in saliva required to provide adequate protection from URTIs 3 and that a lack of SIgA or the inability to produce specific SIgA antibodies can lead to an increased susceptibility to URTIs. Although the precise association between the incidence of URTIs and immunosuppression remains unclear, 4 it has been suggested that transient changes in SIgA levels or low resting SIgA levels in saliva could contribute to the increased susceptibility to infection. 4–6 More recently it has been suggested that the relative decline in an individual's s-IgA, regardless of absolute concentration, increases the risk of URTIs. 7
Investigations of s-IgA levels are numerous and show large variability, which may be due to both methodological and biological factors. The actual concentration of s-IgA depends on the production of dimeric IgA by local plasma cells; the epithelial transport capacity (expression of polymeric Ig receptor, pIgR) to provide luminal SIgA; binding of SIgA to mucus, to mucosal surfaces and to commensal bacteria; and methodological issues with the measurement of s-IgA. Whole saliva composition is further complicated by the fact that various sources of secretion containing differing concentrations of SIgA (major and minor salivary glands) exist. Furthermore, passive leakage of monomeric IgA is variable and typically constitutes about 10% of s-IgA composition. Oral diseases such as gingivitis/periodontitis or tonsillitis can increase the concentration of s-IgA in whole unstimulated saliva. 8
Previously published reports in this field have used a variety of methods for sample collection and storage as well as for measurement. The method of whole unstimulated saliva collection can influence s-IgA concentration as s-IgA concentration varies with saliva flow rate. 9,10 The saliva flow rate is influenced by factors such as stress or mastication. 11–15 In order to represent s-IgA concentration independent of saliva flow rate, laboratories have used saliva secretion rate and ratio of s-IgA to albumin, total protein and osmolality in saliva. 3,5,10 Differences in assay method, calibration material and specificity of the antisera have resulted in widely varying results reported in the literature. 8 In 1994 a certified reference material (CRM 470) was prepared by the International Federation of Clinical Chemists. 16 Failure of many laboratories to use this calibration standard has also added to the variation in reporting.
Reported methods for the analysis of s-IgA in saliva include radial immunodiffusion (RID) 17,18 and most commonly enzyme-linked immunosorbent assay. 19,20 Aufricht et al., 10 Tiollier et al. 21 and Neville et al. 7 used nephelometry immunosassay (NIA) to measure the concentration of IgA in saliva samples but reported only preliminary information about methodology and assay performance.
The primary aim of this study was to standardize a method of saliva collection, storage and analysis of s-IgA by a commercial automated particle-enhanced nephelometric immunoassay (PENIA) method and albumin in saliva by commercial automated NIA method and to determine reference ranges for healthy adults, using s-IgA concentration and secretion rate and the ratio of salivary IgA to albumin and osmolality. The accuracy, precision, linearity and limit of detection (LOD) and quantitation (LOQ) of the assays were established and the analytical coefficients of variation (CVs) for the methods were verified. The stability of IgA and albumin in saliva under various storage conditions, including the presence of a protease inhibitor, and the effects of freeze–thawing were also tested.
Methods
Ethics approval
Approval for this study was obtained from the Northern Tasmania Health & Medical Human Research Ethics Committee and the Australian Defence Human Research Ethics Committee (ADHREC). The procedures conformed to the guidelines for human research ethics described in the Declaration of Helsinki (1989). Subjects gave written informed consent after explanation of the nature, purpose and possible effects of the procedures.
Subject samples
Saliva samples were collected from 143 subjects (51 women) who were recruited from the staff of the School of Human Life Sciences at the University of Tasmania and the Defence Science and Technology Organisation (DSTO) in Scottsdale. Subjects had no self-reported signs or symptoms of an infection or infectious disease, were not on immunosuppressive drugs, were not pregnant, were non-smokers and were not undertaking extreme levels of exercise. To minimize the possible effects of diurnal variation and eating, all saliva samples were obtained at least two hours post-prandial and no early morning or late evening samples were used. 22,23
Unstimulated resting whole saliva was collected in Salivette tubes with a polyester swab (Sarstedt, Numbrecht, Germany). Sample collection was supervised by investigators in all cases. After rinsing the mouth completely with water, and then waiting for one minute, unstimulated resting whole saliva was collected. The polyester swab from the Salivette was tipped into the mouth without the fingers touching it and kept still in the cheek or under the tongue to avoid stimulating saliva flow. Talking, chewing or swallowing was not allowed. After two minutes, the saturated swab and any saliva that had accumulated in the mouth were expectorated into the Salivette tube, with care taken not to swallow or spill any saliva. In order to measure saliva flow rate, saliva volume was determined by weight (±0.01 g) and the saliva collection timed accurately (±1 s). Saliva density was assumed to be 1.00 g mL−1.
Saliva was recovered from the Salivettes by centrifugation for 4 min at 4000 rpm (IEC Centra MP4R centrifuge; International Equipment Company, Needham Heights, MA, USA). A pooled saliva sample was prepared from the saliva of nine subjects (four women) and was gently mixed before being diluted with the manufacturer-supplied reaction diluent (Siemens, Marburg, Germany). Samples (1 mL aliquots) were immediately frozen at −80°C for later analysis. Thawed samples were clarified by centrifugation for 1 min at 13,000 rpm (Beckman Microfuge Lite, Beckman, Krefeld, Germany) immediately before analysis.
Assay procedure
Total IgA in saliva was measured by PENIA and albumin in saliva was measured by NIA (Siemens, Marburg, Germany) on a ProSpec nephelometer (Siemens) according to the instructions of the manufacturer, by accepting the default dilution for the IgA assay (protocol 62,1/5) and a special dilution of 1/5 for the albumin assay (protocol 27). The IgA assay uses a rabbit anti-human IgA (α-chain) antiserum coated on polystyrene particles and an IgA standard (a mixture of human sera) referenced to the International Federation of Clinical Chemists Certified Reference Material-470. It is important that the antisera be able to detect SIgA and both IgA subclasses IgA1 and IgA2, which are present in almost equal proportion in saliva. This contrasts with human serum in which the IgA1 predominates and IgA2 is rare. The Siemens antisera detect SIgA and all IgA subclasses (IgA1, IgA2, IgA3) (personal communication: Ralf Evelbauer, Siemens Healthcare Global Product Support Plasma Proteins). The albumin assay uses a rabbit antiserum for human albumin and human serum protein standard and controls. Reagents, controls and standards (Siemens) were reconstituted with ultrapure water from a Modulab Analytical – Research Grade UF/Polishing System (Continental Water Systems, San Antonio, TX, USA).
Osmolality was measured on undiluted whole unstimulated resting saliva by use of the freezing point depression method on an Advanced Micro Osmometer, using the manufacturer-supplied reference solution and calibration standards (Model 3300, Advanced Instruments Inc, Norwood, MA, USA).
Assay range and sensitivity
To establish the dynamic linear range for the assay of s-IgA and albumin in saliva, a series of dilutions of serum protein control materials were made using reaction diluent (Siemens, Marburg, Germany) to obtain known IgA concentrations in the range 4–103 mg L−1 and known concentrations of albumin in the range 6.9–157 mg L−1. The measured values were compared with expected values. The LOD and LOQ for measurement of IgA and albumin in saliva were calculated using the SD of the response and the slope of the measured curves derived from serial dilution of a pooled saliva sample. 24
Accuracy and precision
The accuracies of the s-IgA and salivary albumin and osmolality assays were determined by analysing multiple samples of low, medium and high commercial IgA (n = 58, 3.8–20.8 mg L−1), albumin (n = 57, 6.9–157 mg L−1) and osmometer protein (n = 34, medium range) controls of known concentration over 26 consecutive days. The intra-assay imprecision for measurement of IgA and albumin in a pooled saliva sample was assessed by using five replicate analyses of a series of five dilutions (n = 25) and the inter-assay imprecision was assessed by analysing these samples on each of six consecutive days. To investigate the requirement for a protease inhibitor, sodium azide (final concentration 0.2 mg L−1) was added to half the diluted saliva samples. The intra- and inter-assay imprecision of the measurement of osmolality in saliva were evaluated by repeatedly analysing an undiluted pooled sample on four separate days (n = 26).
Analyte stability
To determine the stability of s-IgA and albumin in saliva, samples were stored at varying temperatures (28°C, 21°C, 4°C and −4°C) for periods ranging from 15 min to 15 days, with and without sodium azide. These temperatures were chosen to simulate typical field trial conditions where the use of s-IgA may be relevant. Another set of samples was stored at −80°C for a period up to 90 weeks. To determine the effect of repeated freeze–thawing, multiple samples were frozen at −80°C, thawed, analysed and refrozen for six cycles.
Statistical analysis
All statistical analyses were performed with SPSS (Statistical Package for the Social Sciences, version 17, SPSS Inc, Chicago, IL, USA). Data were tested for normality by visual inspection of histograms, by coefficients of skewness and kurtosis, and by the Kolmogorov–Smirnov test. Data that were not distributed normally were transformed by natural logarithm (ln) before further analysis by parametric tests. Descriptive statistics are presented as mean and standard deviation (SD). To assess the effect of sodium azide as a preservative on the s-IgA and salivary albumin assays, differences in means were compared by Student's t-test. Bland–Altman plots were used to compare the concentration of albumin and IgA in commercial standards as measured by the manufacturer and the modified NIA and PENIA saliva assays. 25
Linear regression was used to determine the linear ranges for the s-IgA and salivary albumin assays. To compare the precision of the assays at various dilution factors, a repeated measures ANOVA was used. Stability of IgA under various saliva storage conditions was assessed by repeated measures ANOVA and independent t-test. Significance was accepted at P values less than 0.05 for all statistical tests.
For determination and removal of outliers in the reference data-sets Reed's criterion was used. 26 Because the distributions were not normal, reference intervals were defined using a non-parametric method recommended by the International Federation of Clinical Chemistry. 27 Differences between the means for the male and female subjects were assessed by independent t-test on ln-transformed data.
Results
Assay range and sensitivity
A linear regression analysis showed that linearity of the NIA salivary albumin assay was excellent in the range 6.9–157 mg L−1 (P < 0.001 and R 2 = 0.997). The optimum range for the determination of s-IgA in saliva was 4–10.3 mg L−1. Based on the series of saliva dilutions, the calculated LOD for s-IgA and salivary albumin was 0.45 and 0.02 mg L−1, respectively. The LOQ for s-IgA and salivary albumin was 1.37 and 0.07 mg L−1, respectively.
Accuracy, precision and LOD
Bias, expressed as the percentage difference between the expected and measured values, for IgA and albumin is shown in Figure 1 with the mean percent biases being 5.4 ± 4.5% for albumin and −0.7 ± 4.8% for IgA. The mean % bias for the osmolality for a single low control (69 mOsmol L−1) was 0.2 ± 6.9% (n = 69, 21 assays). The precision of salivary albumin measurements was unaffected by saliva dilution but dilution had a significant effect on measured s-IgA concentration. The intra- and inter-assay analytical CVs are represented in Table 1. The best results were obtained with sample dilutions of 1/5 and 1/10 for s-IgA and 1/2 and 1/5 for salivary albumin determinations.
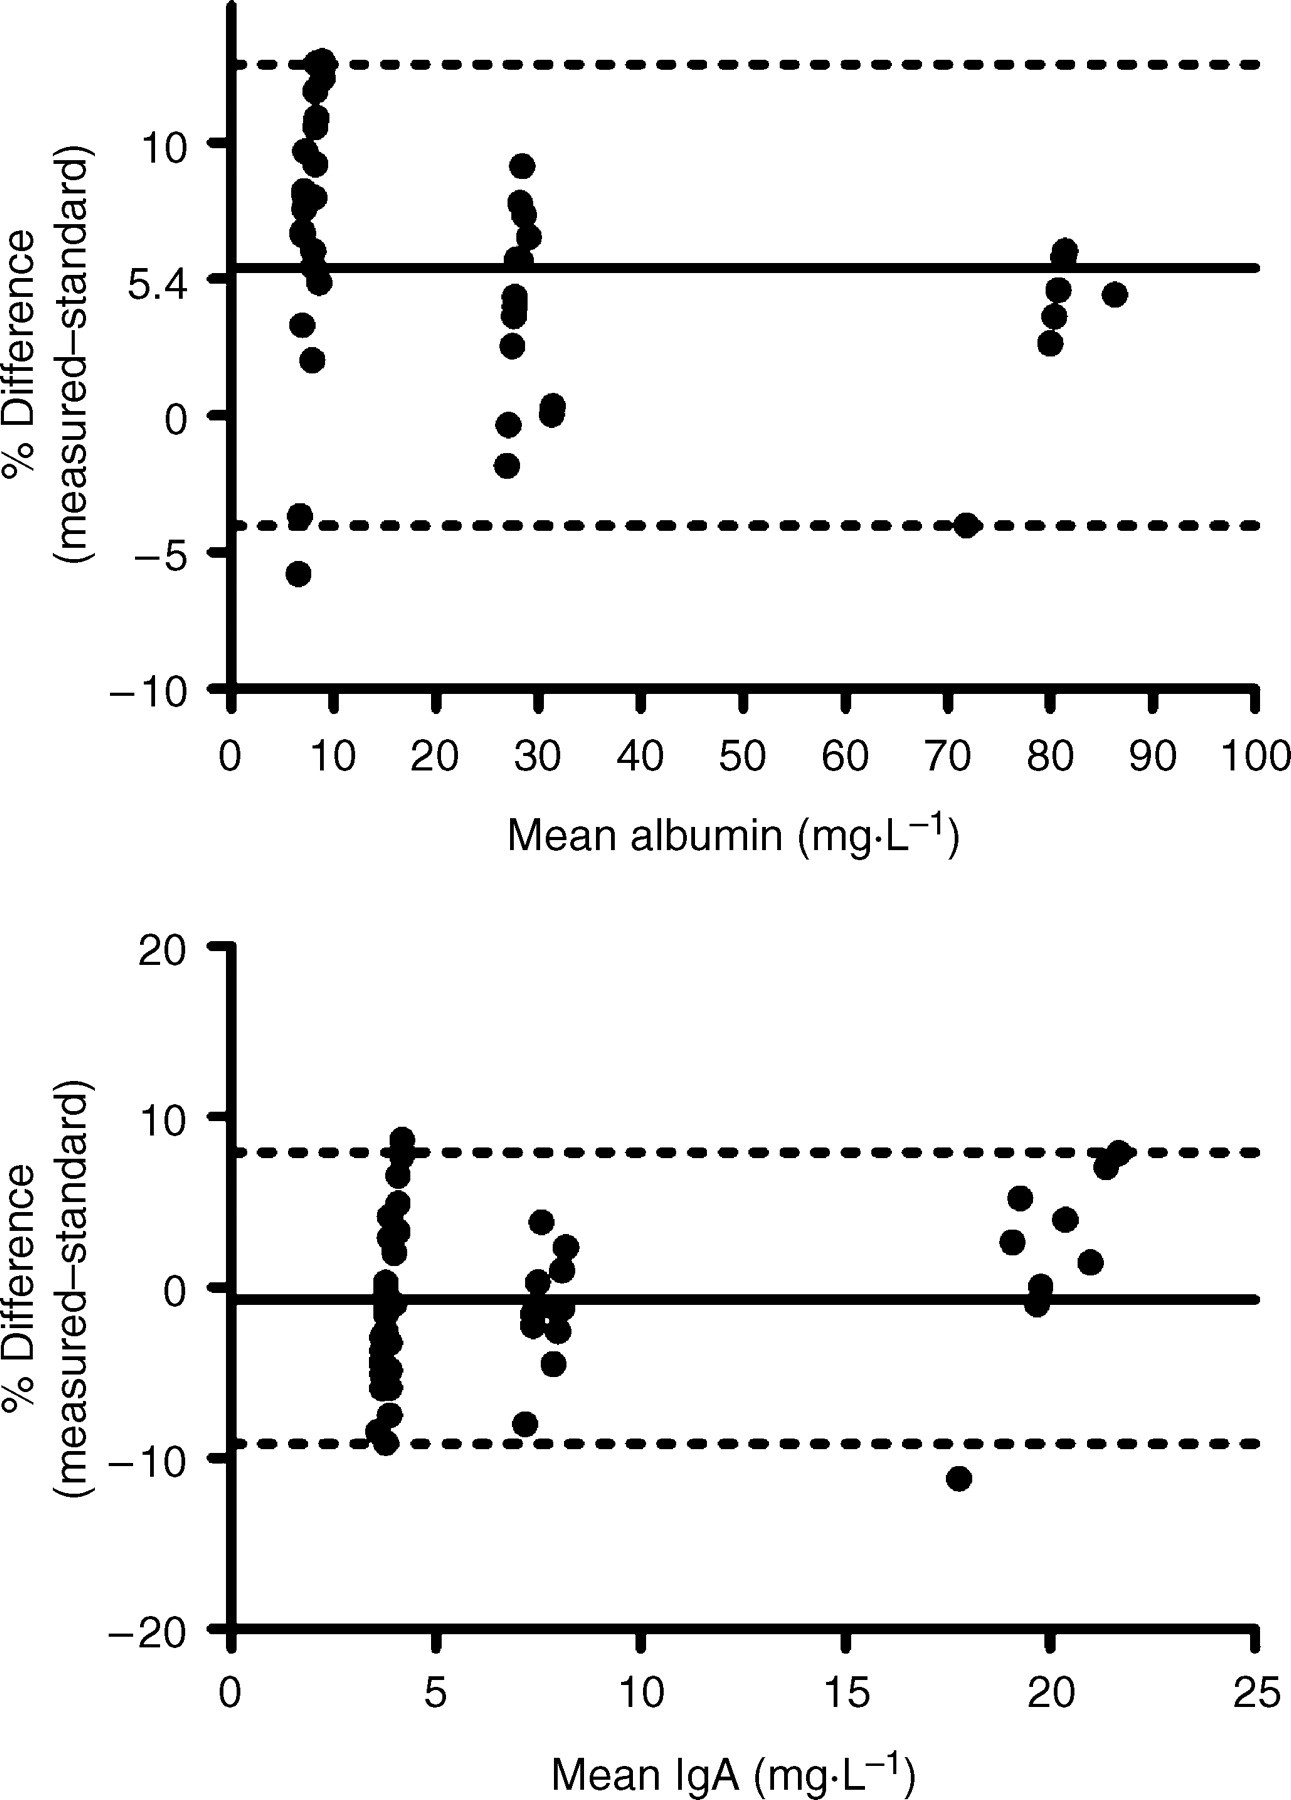
Bland–Altman plots comparing the concentration of albumin (n = 57) and IgA (n = 58) in commercial standards as measured by the manufacturer and the modified NIA and PENIA assays. The dark lines show the mean bias, while the dotted lines show the 2.5th and 97.5th percentiles
Analytical variation of s-IgA and albumin concentration in a pooled saliva sample at various dilutions
Dilutions refer to manual dilution of the saliva sample (i.e. excluding dilutions performed on-board the instrument according to the manufacturer's protocol) and the concentrations are expressed as the analyte in undiluted saliva
SD, standard deviation; CV, coefficient of variation
Analyte stability in saliva
Linear regression analysis of changes in concentration with time showed no evidence that the preservative (sodium azide) had an effect on stability of salivary albumin or s-IgA under the various saliva storage conditions. Albumin and s-IgA in saliva did not alter over 6 h of storage at the higher temperatures (21 or 28°C), but there was some evidence of a decline in both albumin (P = 0.03) and s-IgA (P = 0.01) after 6 h. When saliva was cooled to 4°C, there appeared to be some complex instability observed with the measurement of s-IgA with an increase in observed values over the first 6 h (at 4°C, second-order regression fit, r 2 = 0.92). Between 24 and 48 h of storage at 4°C, the measured values were stable and consistent with the values measured at room temperature. After two days there was some evidence for a decline in measured values (P < 0.05). There was no evidence for a change in s-IgA concentration when saliva was stored at −4°C over 15 days or for changes in salivary albumin concentration when saliva was stored at either 4°C or −4°C for the same period. Under storage at −80°C, there was no evidence for changes in salivary albumin concentration or osmolality over 90 weeks or for s-IgA concentration over 68 weeks, but s-IgA concentration declined after 68 weeks (P < 0.001). Albumin and s-IgA concentrations in a saliva sample and protein controls did not change after six freeze–thaw cycles with CVs within the expected inter-assay CVs as described above (Table 1).
Reference ranges for total IgA in saliva
The descriptive statistics for s-IgA and salivary albumin and osmolality collected from 134 healthy adults (93 men, 41 women; mean age 31 yr, range 18–57) are summarized in Table 2. Calculated reference ranges with 90% confidence intervals are shown in Table 3.
Descriptive statistics for salivary s-IgA in a group of 134 subjects (mean ± SD; median; range)
*Significantly different from men
Reference range for salivary s-IgA measures with 90% confidence interval for a group of 134 subjects
Discussion
The assays of s-IgA and salivary albumin and osmolality are precise with an excellent linear range and small inter- and intra-assay variation. Preanalytical variation was minimized by standardizing sample collection, handling and storage methods. The effect of saliva dilution on the measured value of s-IgA was pronounced. We found that a 1/10 dilution of the saliva was necessary to achieve reliable results. One possible explanation is that by diluting the saliva with the commercial assay buffer, IgA bound to mucous is released. Variation in the s-IgA assay was within the range specified by the manufacturer in their package insert for the determination of IgA in cerebrospinal fluid. The inter-assay variation of 6.5% for measurement of albumin in saliva was higher than that reported in the package insert for the commercial (Siemens) assay of albumin in urine and serum (2.6%). LOQ for both s-IgA and albumin in saliva was similar to that reported by the manufacturer for the commercial assays. The s-IgA PENIA assay performance characteristics compare favourably with a commercial indirect enzyme immunoassay, which reported an inter-assay variation of 8.93% and LOD of 2.5 mg L−1 for IgA in saliva 28 and a NIA method, which reported an intra-assay variation of 1.6% and a LOQ of 14 mg L−1 for IgA in saliva. 7
Albumin and s-IgA in saliva were found to be stable without the need for refrigeration or preservative (sodium azide) under the conditions commonly required by our laboratory (i.e. ambient temperatures for several hours). However, storage of saliva samples at very low temperatures is advised to prevent bacterial growth and for long-term storage, −20°C or −30°C might not be enough. For example in one study, s-IgA concentrations remained stable for up to three months at −30°C, but decreased by more than 10% in a majority of samples after eight months. 29 Similarly, SIgA activity to Streptococcus mutans in samples of saliva stored at −20°C decreased significantly after one week and was completely lost after 18 months, whereas storage at −70°C prevented loss of antibody activity. 30 We demonstrated that s-IgA concentration declined significantly in samples stored at −80°C after approximately 70 weeks. The speed at which samples are frozen has been shown to affect s-IgA concentration. In samples that were not frozen immediately s-IgA concentrations declined by approximately 30% when compared with samples snap-frozen in liquid nitrogen. 31 However, the advantage of snap freezing samples was lost if not applied immediately after collection of the saliva.
The finding that repeated freeze–thawing did not affect s-IgA and albumin concentrations in saliva is consistent with a previous observation. 32 However, we noted that from the third freeze–thaw cycle onwards samples showed a visible physical change, becoming ‘cloudy’ with a precipitate, possibly due to denaturation of proteins. Others have observed that albumin concentration in saliva can decrease by 10% with each additional thaw (M. Gleeson, personal communication, 1 September 2002). It is therefore, recommended to avoid repeated freeze–thaw cycles.
This study showed that separate reference intervals for men and women are not necessary. It has been suggested that a stratified reference interval is required if the difference between the means of potential subgroups is greater than 25% of the 95% reference interval for the entire group. 26 According to this criterion, stratification by gender was not necessary despite the fact that there were significant differences between the means of both groups for s-IgA concentration (P < 0.001), s-IgA secretion rate (P = 0.006) and ratio of s-IgA to osmolality (P < 0.001).
Although participants with self-reported infection were excluded, some participants may have had unreported periodontal disease, which can greatly elevate the concentration of s-IgA. Three extreme (high) outlying results were removed from our data-set. However, the possibility that inadvertent inclusion of participants with periodontal disease may have skewed the data-set to higher values cannot be dismissed. The reference interval for s-IgA concentration (15.9–414.5 mg L−1) is consistent with the 25–600 mg L−1 published by Gleeson et al. 33 for subjects after an overnight fast but greater than the 9–125 mg L−1 for ‘non-fasting’ subjects in the same study. The lower reference value for s-IgA concentration was well above the LOQ of the PENIA assay. The large range reported here is partly due to the statistical method used. Outliers were removed based on Reed's principle. 26 The use of a different criterion for the removal of outlying data in the right tail of the distribution could have yielded a narrower reference interval. Despite the fact that more subjects were used than the 120 recommended by the IFCC, it is possible that a more representative ‘healthy’ reference interval may have been obtained from a larger cross-section of people.
We recommend the use of a standardized saliva collection method, which uses a commercial Salivette containing a polyester swab. Whenever possible, sample taking should be supervised, especially when accurate timing is needed to calculate s-IgA secretion rate. If this is not possible subjects should be provided with detailed instructions. Saliva samples should be taken either before a meal or at least 1.5–2 h postprandial. 22,23 Saliva samples should be analysed as soon as possible after collection. However, samples can be transported for brief periods (few hours) at ambient temperature and remain in the laboratory, at room temperature for a limited time (few hours total). Otherwise they should be frozen immediately, either by snap-freezing in liquid nitrogen, by placement in dry ice or in a −80°C freezer. Long-term storage at −80°C can retard the degradation of s-IgA for up to one year. Storage in a home freezer (at −4°C or even −20°C) or in normal ice is useful only as a temporary measure and should be avoided. Limited freeze–thawing is acceptable but should not be excessive. A preservative was not required to stabilize s-IgA or albumin in saliva under these conditions. In order to use the commercial IgA and albumin methods, saliva samples need to be prediluted 1/10 with the commercial reaction diluent. The measurement of s-IgA by PENIA was found to be a good alternative to other methods as it is automated, rapid, accurate and precise.
Most published reports have used s-IgA concentration. But concentration values can be misleading, because saliva often becomes concentrated during exercise. 34 Hence decreased s-IgA output and transport during physical activity may not be detected. Expressing s-IgA concentration against a salivary marker, which is not actively transported and therefore is insensitive to most physiological changes, should account for changes in saliva water volume. Total salivary protein and salivary albumin have been used for this purpose. The use of total protein has been criticized because certain proteins, which make up a significant proportion of salivary protein content, are sensitive to physiological conditions (e.g. salivary amylase and other immunoglobulins) and may influence total protein secretion rate. 35 Of these two markers, albumin would be preferable because it is passively transported into saliva from plasma, where it is under homeostatic control (35–50 g L−1 or approximately 0.6 mmol L−1). However, even albumin can be affected by plasma volume, postural change, pregnancy, congestive heart failure, severe malnutrition and liver failure. Another potential marker of saliva water volume change is osmolality. Because inorganic electrolytes rather than proteins contribute most to the osmolality of saliva, the overall secretion rate of solutes (or osmolality) should not be affected by most physiological conditions.
Total IgA concentration in saliva can be reliably reported as either a ratio to albumin or osmolality or as a secretion rate. In terms of convenience our laboratory finds the use of the s-IgA to albumin ratio as the preferred option, because this permits automation of the methods within one analytical platform.
The authors declare no conflict of interest. This work was largely supported by DSTO funding through its usual annual tasking process and in part by the University of Tasmania School of Human Life Sciences postgraduate programme.