
Abstract
Background
Percutaneous coronary intervention (PCI) is accepted as a model of myocardial ischaemia in studies of ischaemia markers, especially of ischaemia-modified albumin (IMA). However, there is concern that IMA levels may reflect changes in albumin concentrations rather than myocardial ischaemia also during PCI.
Methods
Twenty-one consecutive patients (17 men and 4 women) undergoing single-vessel percutaneous coronary angioplasty were enrolled in the study. IMA and albumin levels were measured together with myoglobin, creatine kinase 2 and cardiac troponin I, before (Group 1), immediately after (Group 2) and 6 h after (Group 3) the procedure of PCI.
Results
The IMA levels of Group 2 were significantly higher than those of Group 1 and Group 3 (P < 0.05 for both). However, correction of IMA by multiplying with the (individual albumin concentration of the patient/median albumin concentration of Group 1) ratio gave no statistical differences between the groups (P > 0.05). There were strong negative correlations between IMA levels and albumin concentrations within individual groups (r = −0.757, P < 0.001; r = −0.712, P < 0.001; and r = −0.705, P < 0.001 for Group 1, Group 2 and Group 3, respectively).
Conclusion
The results confirm the close dependency of IMA results on albumin concentrations. Therefore, IMA results reflect albumin concentrations rather than myocardial ischaemia also in PCI. This situation and lack of standard reference materials for the albumin cobalt binding assay can lessen the diagnostic performance of IMA.
Introduction
Ischaemia-modified albumin (IMA) is a relatively new biomarker proposed for recognition of myocardial ischaemia. 1,2 Levels of IMA are increased in patients with acute coronary syndromes attending the hospital with recent onset chest pain. 3 IMA concentrations are measured by the albumin cobalt binding (ACB) test based on the reduced capacity of human albumin to bind cobalt as a result of structural changes in the N-terminal of the albumin molecule in conditions of ischaemia. Modified albumin leaves more free cobalt to react with dithiothreitol (DTT) in the reaction mixture and consequently a darker colour is formed. Although the exact biochemical mechanism modifying the N-terminal region of albumin during ischaemia is unclear, the working hypothesis is mainly based on the free radical damage. 1 Other mechanisms involved in these changes may be hypoxia, acidosis, sodium and calcium pump disruptions, free iron and copper ion exposure. 1 All these events are seen in myocardial ischaemia–re-perfusion conditions. Therefore, transient coronary artery occlusion during percutaneous coronary intervention (PCI) has been considered to represent a model of ischaemia–re-perfusion. 4–6 These studies have shown that plasma IMA levels increase soon after transient balloon inflation during PCI, even in the absence of considerable elevations of cardiac troponins. However, because of the existence of a negative correlation between IMA and albumin concentrations by the ACB test, 7,8 falsely elevated or decreased IMA results may be obtained especially in patients with very low or high albumin levels, respectively. IMA was extensively studied previously in percutaneous transluminal coronary angioplasty or PCI; 9,10 however, most of these well-designed studies have been carried out expressing ‘albumin levels within normal range’ and not performed simultaneously albumin measurements together with IMA. Here we present a study on pre- and post-PCI measurements of IMA and albumin concentrations to observe reciprocal changes of these analytes during the PCI. We also measured conventional cardiac markers having well-known clinical performances such as creatine kinase 2 isoenzyme, myoglobin (Mb) and cardiac troponin I (cTnI) levels in the same specimens.
Materials and methods
Subjects
Twenty-one consecutive patients (17 men, mean age 55 ± 7 years and 4 women, mean age 58 ± 5 years) undergoing single-vessel PCI were enrolled in the study (Table 1). Patients with other acute or chronic ischaemic conditions such as stroke, transient ischaemic attack, claudication, peripheral vascular disease, shock or renal failure were not included. There was no stent implantation. (Since the primary aim of the study was to show the relationship between IMA results and albumin concentrations, we did not record the number and duration of balloon of inflation and pressure.) All patients included had undergone successful procedures without any gross complication such as periprocedural myocardial infarction. However, there were some elevations of cardiac markers in a few patients due to procedure. All patients received conventional medication, including mainly acetylsalicylic acid and heparin, before and during the procedure. Heparin was given as a bolus at the beginning of the procedure and additional injections were given if necessary to maintain an activated coagulation time ≥250 s. All patients received intravenous saline 0.9% during the procedure. The study protocol was approved by the Local Ethics Committee, and informed consent was given by all the subjects.
Baseline and procedural characteristics (n = 21 patients)*
*Values for age are the mean (SD); all others are percentages
†PCI, percutaneous coronary intervention
‡CABG, coronary artery by-pass grafting surgery
SD, standard deviation
Blood collection
Fasting venous blood samples were taken from the antecubital vein through a different indwelling catheter from that used for fluid and heparin administration into Vacutainer® tubes with serum separator gel (SST, Becton Dickinson) before PCI (Group 1) and following completion of the procedure (within 5 min, Group 2) and 6 h (Group 3) afterwards. After coagulation samples were centrifuged at 1300 g for 10 min, sera were separated within half an hour and aliquots were immediately stored −20ºC until analyses.
Analyses
IMA, cTnI, Mb, creatine kinase 2 isoenzyme and albumin levels were measured in all the samples. IMA was measured by a colorimetric assay according to the method of Bar-Or et al. 1 using a Shimadzu UV-120-01 spectrophotometer (Shimadzu Corporation). Briefly, 200 μL of patient serum was added to 50 μL of a solution of 1 g/L cobalt chloride, mixed and incubated at room temperature for 10 min. DTT, 50 μL of a 1.5 g/L solution, was added and mixed. After incubation at room temperature for 2 min, 1.0 mL of a 9.0 g/L solution of NaCl was added. The sample blank was prepared similarly without the addition of DTT. The absorbances of assay mixtures were read at 470 nm. The results were reported in absorbance units (ABSUs). cTnI and Mb were measured with an Innotrac Aio! immunoanalyzer (Innotrac Diagnostics Oy). Creatine kinase 2 activity (immunoinhibition) and albumin (bromocresol green) were determined by commercially available reagents (Roche Diagnostics) in a Modular P analyzer (Roche). All analyses were performed on the same working day. Albumin, cTnI, creatine kinase 2 and Mb were studied in the same run. IMA was analysed in different runs (five samples per batch) but in random order to minimize any systematic bias. Between-day (n = 21) imprecisions of IMA at low (mean ABSU: 0.440) and high (mean ABSU: 0.637) IMA containing serum pools were 7.27% and 8.63%, respectively, and within-run imprecisions of the same pools were 5.92% and 8.17%, respectively. The method was linear up to an albumin concentration of 45 g/L (cobalt binding of human albumin was checked at albumin concentrations of 25, 35, 45 and 55 g/L). Within-run imprecisions (n = 21) of the albumin method were 1.27% and 1.26% at control materials with low and normal albumin concentrations. Within-run imprecisions at control materials of low and high were 7.1% and 6.6% for cTnI, 8.0% and 6.9% for Mb, and 4.3% and 1.6% for creatine kinase 2 (n = 21). Cut-off values for the analytes used in the study were as follows: IMA >0.550 ABSU; cTnI >0.3 μg/L; Mb >150 μg/L; creatine kinase 2 >0.5 μkat/L. We used a first-generation cTnI assay with an upper 95th percentile of 0.1 μg/L. Clinical sensitivity and specificity of the cTnI assay were 37.0% and 98.6% at the 0.3 μg/L limit, respectively.
Statistics
Data were calculated on a ‘MINITAB STATISTICAL SOFTWARE Release 13.20’ program (Minitab Inc). Results were expressed as median and interquartile range (IQR). Equality of variances was controlled by Levene's test. Differences between pre- and post-treatment levels of analytes were estimated by Mann–Whitney U test. A P value ≤0.05 was considered significant. Correlation between IMA and albumin was tested using Pearson's correlation coefficient. The relationship between IMA and albumin was tested by linear regression analysis.
Although we tried to recruit patients with stable clinical condition, not all the baseline analyte values were within reference ranges. The Mb values of four patients were apparently above the cut-off limits of evident myocardial injury. However, because of the low specificity of Mb and as the group variances were not different according to Levene's test, we did not omit these extreme values.
Results
Results are presented in Table 2. Twenty of 21 patients had increased IMA values >10% immediately after the PCI procedure with respect to baseline values and remained elevated >10% in eight patients at sixth hour of procedure. Five of the remaining 13 patients had elevated IMA values at the sixth hour <10% but IMA values were decreased below baseline in eight patients. Levene's test showed no significantly different variances between the groups for the parameters studied (P > 0.05). As seen in Figure 1, the IMA levels of Group 2 were significantly higher than those of Group 1 and Group 3 (P = 0.001 and P = 0.0236).
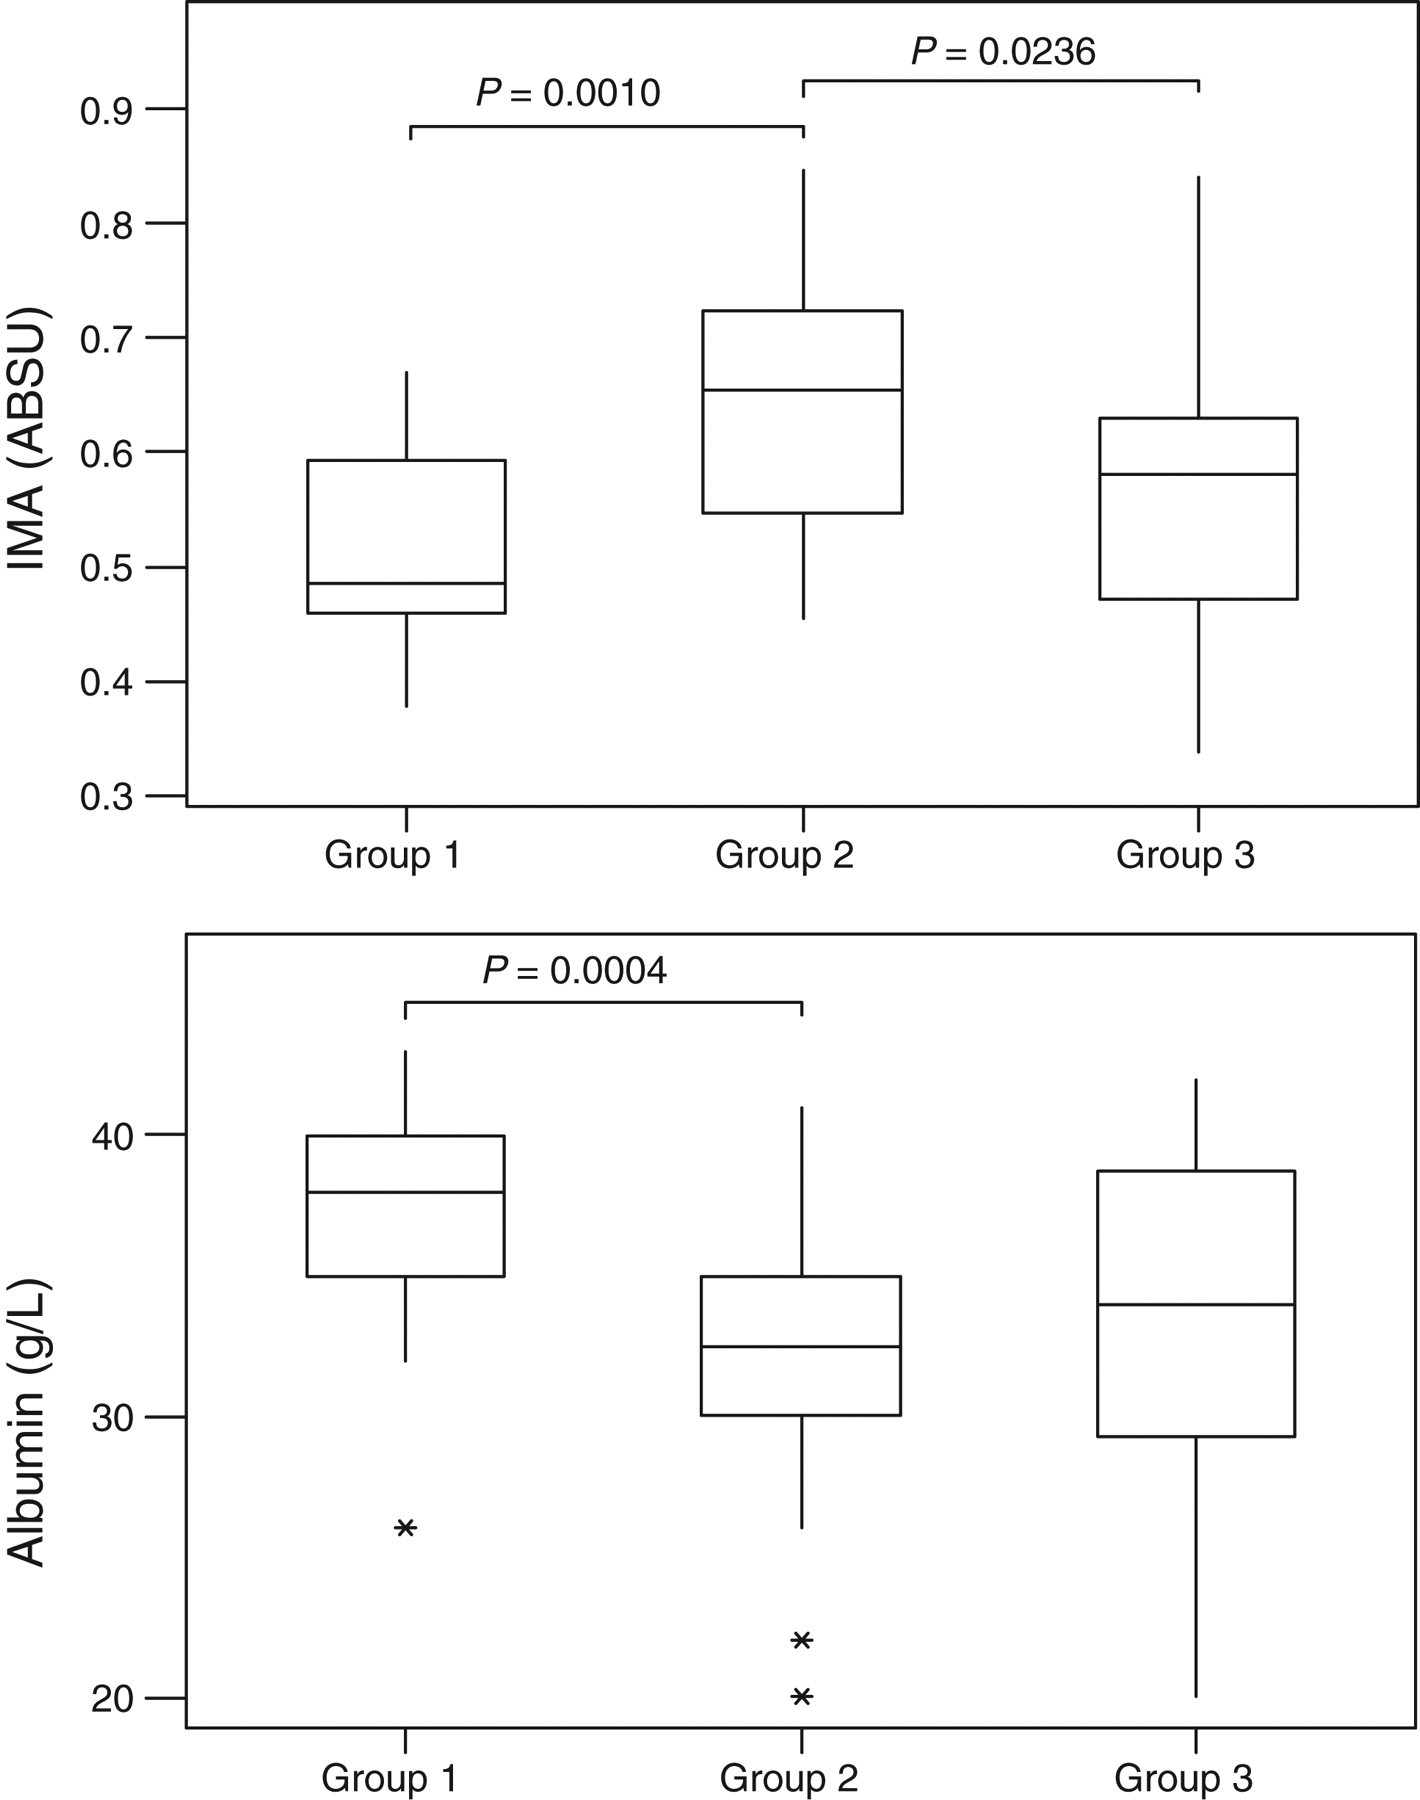
Box and whisker plots for ischaemia-modified albumin (top) and albumin (bottom). The image of each time group shows the box plot with median (horizontal line within the box); the interquartile range (IQR), corresponding to the 25th–75th percentiles (lower and upper limits of the box); nearest observations within 1.5 IQRs (the whiskers); and outliers (asterisks)
Pre- and post-PCI median (IQR) IMA, albumin, cTnI, creatine kinase 2 and Mb levels
*P < 0.05 versus Group 1
† P < 0.05 versus Group 3
‡IMA adjusted according to the formula suggested by Lippi et al. 13 : ([individual serum albumin concentration/median albumin concentration of Group 1] × IMA value)]
§Baseline Mb values of four patients were apparently higher than the 99 percentile cut-off limits; however, these patients were not omitted. In our experience, cut-off limits of evident myocardial injury were >0.550 for IMA, >0.3 μg/L for cTnI, >0.5 μkat/L for creatine kinase 2 and >150 μg/L for Mb
Group 1: pre-PCI; Group 2: immediately after PCI; Group 3: 6 h later from procedure
PCI, percutaneous coronary intervention; IQR, interquartile range; cTnI, cardiac troponin I; Mb, myoglobin; IMA, ischaemia-modified albumin
There was no significant difference between Group 1 and Group 3 IMA levels (P > 0.05). Similarly, albumin concentrations were also significantly different between the groups. Albumin concentrations of Group 2 were significantly lower than those of Group 1 (P = 0.0004). However, albumin concentrations were not statistically different between Group 1 versus Group 3 and Group 2 versus Group 3 (P > 0.05 for both). Although median cTnI and creatine kinase 2 levels of Group 2 and Group 3 were higher than the others, the differences were not statistically significant (P > 0.05 for all).
There was a close negative relationship between IMA levels and albumin concentrations within each group. Group 1: IMA (ABSU) = 1.141–0.0161 (albumin, g/L), (95% confidence interval [CI] for intercept: 0.892–1.390; 95% CI for slope: −0.023 to −0.010), r 2 = 0.572; Group 2: IMA (ABSU) = 1.123–0.0153 (albumin, g/L), (95 CI % for intercept: 0.898–1.347; 95 CI % for slope: −0.0222 to −0.0083), r 2 = 0.507; Group 3: IMA (ABSU) = 1.084–0.0156(albumin, g/L), (95% CI for intercept: 0.832–1.335; 95% CI for slope: −0.0227 to −0.0083), r 2 = 0.497 (Figure 2). IMA and albumin did not show significant correlations with other cardiac markers.
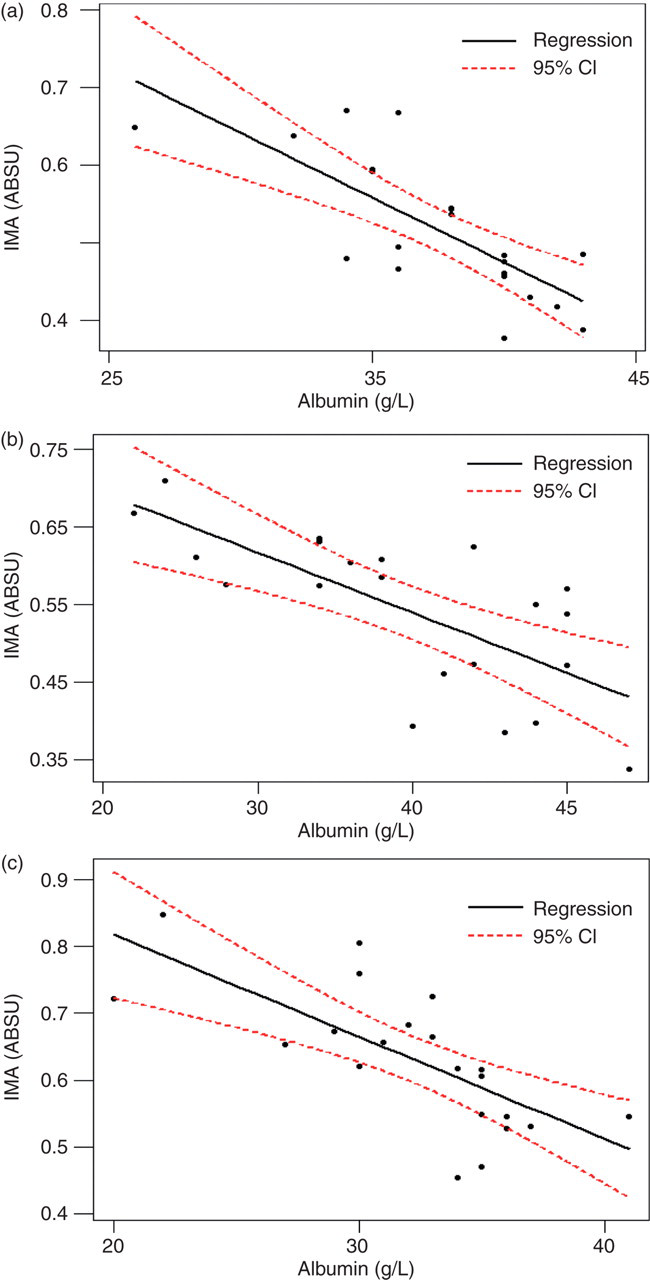
Relationship between ischaemia-modified albumin (ABSU) and albumin concentration in Group 1 (a), Group 2 (b) and Group 3 (c)
The albumin concentrations of one patient were apparently lower before, immediately after and 6 h after the procedure (26, 20 and 26 g/L, respectively), but the other patients' albumin levels ranged from 32 to 43 g/L.
Discussion
In the present study, significantly higher levels of IMA immediately after PCI were found as compared with pre-PCI IMA levels. IMA levels were decreased to relatively higher but statistically insignificant levels compared with pre-PCI levels at the sixth hour after PCI. However, albumin concentrations were also changed significantly but in the opposite direction with respect to IMA. This kinetics of IMA was independent of those of other cardiac markers. IMA and albumin values were strongly correlated at any time of the PCI procedure.
PCI can be used as an in vivo model of mild transient myocardial ischaemia–re-perfusion. Because the inflation of a balloon during angioplasty gives rise to transient myocardial ischaemia and then the deflation gives rise to unavoidable reperfusion. Therefore, free radicals generated by ischaemia–re-perfusion may be of major importance in patients undergoing PCI. In a number of studies it has been reported that serum IMA levels increase soon after transient balloon inflation during PCI. 4–6 The results of our study confirm post-PCI IMA elevations.
In the ACB test, increased brown colour formation between free cobalt and DTT reveals increased modified albumin due to the ischaemic event. However, IMA results should be interpreted considering albumin concentrations of the samples used. 7,8,11,12 van der Zee et al. 8 performed IMA measurements in symptom-limited exercise myocardial perfusion scintigraphy and showed that albumin concentration was the only independent predictor of IMA concentration; there was a negative correlation between IMA and albumin concentration, and haemoconcentration due to physical exercise resulted in an absolute decrease of IMA. Similarly, albumin concentrations in our study changed significantly but in the opposite direction with respect to IMA between pre- and post-PCI samples. (Decrease of albumin concentrations in such a relatively short space of time may result from haemodilution resulting from fluid and contrast substance administration and haemodynamic alterations due to the procedure itself). While mean IMA elevation with respect to baseline was 22% immediately after PCI and 5.1% at the sixth hour, mean difference between baseline and post-PCI albumin concentrations was 16.6% and 7.8%, respectively. Strong negative correlation between IMA levels and albumin concentrations in each group indicates the importance of albumin concentrations. These findings are highly comparable to those found by previous studies. 7,8,11,12 Bhagavan et al. 2 examined the linearity of ACB assay with the use of commercial human serum albumin over a concentration range of 20–60 g/L and analysed by linear regression. The regression equation obtained, ABSU = 0.9257–0.0100 (albumin, g/L), is similar to what we present here. These results confirm the absolute dependence of IMA results on albumin concentrations. Theoretically, when albumin concentration is lower in the specimen, less cobalt binds to the albumin molecule, and consequently results in a more intensive reaction between cobalt ions and DTT. Even though there is a warning stating that the results of ACB assay should be interpreted with caution when serum albumin concentrations are <20 g/L or >50 g/L, the results should also be interpreted with caution when albumin concentrations are within the reference ranges. Although a normalization procedure of IMA:albumin may be used, 7 this procedure accentuates rather than diminishes the effect of albumin concentrations.
Lee et al. 12 proposed an ‘albumin-adjusted IMA index’ and improved the diagnostic performance of the ACB test, but, in our opinion, such an index may not be effective since the very strong dependence of the assay results in albumin concentrations over a wide range (0–49 g/L). However, we think the index may be efficient only for the monitoring of patients with known baseline IMA and albumin concentrations. Lippi et al. 13 suggested another adjustment formula to correct IMA values: ([individual serum albumin concentration/median albumin concentration of the population] × IMA value). We could not test the suggestion of Lee et al., because of the use of different IMA units in commercially available kit forms and manual method. The kit form (Inverness Medical Innovations, Waltham, MA, USA) gives IMA values with arbitrary units (kU/L) instead of mass concentration of IMA or ABSU. Therefore the results of the manual method (ABSU) and the kit form (kU/L) are not comparable. However, we could adapt the formula of Lippi et al. to manual method by a slight modification: we used median preprocedural albumin concentration (median of Group 1), 38 g/L, instead of median albumin concentration of the population (Table 2). We believe, this modification allowed adjustment of IMA values to the patients' baseline albumin concentration and more realistic normalization limited to this study. However, since IMA is a part of total circulating albumin, and consequently the results of the ACB test will always be tightly related to albumin concentration, accurate IMA results cannot be obtained by mathematical formulations. Group comparisons showed no difference between the groups with adjusted IMA values (P > 0.05). This result confirms the dependence of IMA values on albumin concentrations. Since low albumin concentrations are frequently associated with cardiovascular events, IMA elevations in acute coronary syndromes are also, at least partly, attributable to the dependency of IMA on lower albumin concentrations.
As a result, the lower albumin concentrations cause the higher IMA levels in the same patients. Although proponents of the ACB test argued that IMA values are reliable within a range of albumin concentration of 20–55 g/L, 11,14 IMA values may be affected by albumin concentrations also within reference limits. In the present study, IMA elevation after PCI reflects, at least in part, decreased albumin concentrations in patients with mild ischaemia during PCI. In fact, adjustment of IMA values to albumin concentrations results in transformation of significant statistical differences to insignificant changes in IMA values due to the PCI procedure.
Study limitations
Many of the studies on IMA are different from the present study as they use the kit form of the ACB assay in automated analysers. We used ‘in-house’ reagents and measured IMA manually. However, the principle of the assay was the same and we found a similar relationship between IMA and albumin concentration.
In conclusion, this study confirms previous knowledge stating the strong relationship between albumin concentrations and IMA levels, and that albumin concentration is the primary predictor of IMA level. Since albumin concentrations appear to be a strong contributor to the results of the ACB assay, standardization of the method by a human albumin-based universal calibrator may improve the assay performance. Currently, transferability and traceability of the ACB test are limited because of the absence of calibrators based on the mass concentration of IMA. However, in the lack of albumin-based calibrators, IMA values can be given according to the formula suggested by Lippi et al. 13 albeit the results of the ACB test will be always tightly related to albumin concentration and accurate IMA results cannot be obtained by mathematical approaches. Yet IMA results should be interpreted with caution not only in extremely low or high serum albumin concentrations (<20 or >55 g/L) but also in ‘normal’ albumin concentrations.
DECLARATIONS