
Abstract
Background
In patients with chronic liver disease (CLD), glycated haemoglobin (HbA1C) levels have been shown to be apparently lower than real values, whereas serum glycated albumin (GA) levels are apparently higher. The present study was aimed to examine whether both glycaemic indices are influenced by hepatic function.
Methods
Subjects consisted of 82 patients with CLD. Various indicators for hepatic function as well as HbA1C and GA were also measured. Estimated HbA1C values were calculated from the mean plasma glucose levels. Two hundred and two type 2 diabetic patients without CLD were studied as controls.
Results
Although GA was strongly correlated with HbA1C in patients with CLD as well as diabetic patients, GA levels in patients with CLD were relatively higher than those in diabetic patients. In patients with estimated HbA1C ≤5.8%, GA levels significantly increased but HbA1C levels decreased as a function of decreasing hepaplastin test (HPT). The ratio of GA/HbA1C (G/H ratio) increased as a function of decreasing HPT. In patients with estimated HbA1C >5.8%, in contrast, GA levels were independent of HPT levels. In the patients with CLD, GA and HbA1C were associated with mean plasma glucose levels and some indicators for hepatic function. The multivariate analysis revealed a significant association of G/H ratio with HPT, cholinesterase and direct bilirubin. The G/H ratio was not associated with the mean plasma glucose but with HPT and cholinesterase levels.
Conclusions
The G/H ratio correlates with hepatic function but not with plasma glucose levels. Therefore, CLD should be suspected for diabetic patients with an elevated G/H ratio.
Introduction
Compared with non-diabetic diseases, glycation of various proteins is accelerated in diabetes mellitus, which is suggested to be involved in the onset and progression of chronic diabetic complications. 1 Of various glycated proteins, glycated haemoglobin (HbA1C) is widely used as an indicator of glycaemic control in clinical settings. 2,3 Based on the results of the Diabetes Control and Complication Trial, HbA1C levels should be maintained at <7% to prevent diabetic microvascular complications. 4 As the life span of erythrocytes is about 120 days, HbA1C has been shown to reflect plasma glucose over the past few months. However, HbA1C measurements are affected by variant haemoglobin and some diseases that shorten the life span of erythrocytes, such as hemolytic anaemia and renal anaemia. Thus, HbA1C does not properly represent the status of glycaemic control in such conditions. 5,6
Glycated albumin (GA) measures the ratio of serum GA to total serum albumin. GA is also used as an indicator of glycaemic control. 7 As the half-life of albumin is about 17 days, shorter than that of erythrocytes, GA is thought to reflect short-term plasma glucose levels (about 2 weeks). While GA measurements are unaffected by abnormal haemoglobin metabolism, 7 they are shown to be influenced by several diseases accompanied by abnormal albumin metabolism, such as nephrotic syndrome, thyroid dysfunction and glucocorticoid administration. As a result, GA levels in patients with such diseases do not properly indicate the status of glycaemic control. 8
In chronic liver disease (CLD), hypersplenism reduces the life span of erythrocytes 9 and thus HbA1C levels are set relatively low in relation to plasma glucose levels. 10–12 Conversely, albumin synthesis is decreased in CLD, and thus GA levels are suggested to be set relatively high because the half-life of serum albumin is prolonged. 13,14 Thus, it was postulated that HbA1C decreases and GA increases as a function of decreased hepatic function. Watanabe et al. 15 have shown that in cirrhotic patients GA levels increase with progression of liver disease. The present study was planned to examine whether HbA1C, GA and the ratio of GA to HbA1C (G/H ratio) are associated with hepatic function tests and can be clinical markers for hepatic function.
Methods
Patients and controls
Subjects consisted of 82 inpatients with CLD hospitalized at Fukui-ken Saiseikai Hospital (46 men and 36 women, mean age: 60.4 ± 9.2 years). 16 Plasma glucose levels had been evaluated as stable in all patients for at least recent two weeks. Patients were excluded from this study based on: inability to intake foods; presence of renal diseases; excessive stress (fever, pain or diarrhoea); or administration of interferon. Among 82 patients, 24 subjects (29%) displayed complications of overt diabetes mellitus. Thirty-eight patients (46%) had estimated HbA1C values (see below) >5.8%, while 44 patients (54%) had estimated HbA1C ≤5.8%. Twenty-one patients had chronic active hepatitis, while 61 patients had liver cirrhosis. Liver cirrhosis was categorized using the Child-Pugh classification 17 as follows: Group A, n = 24; Group B, n = 23; and Group C, n = 14. Diagnosis of the liver disorders was assessed by examination of liver histology performed via laparoscopy and liver biopsy and/or abdominal computed tomography findings, in addition to biochemical tests.
Furthermore, as controls, 202 type 2 diabetic patients without CLD 18 whose plasma glucose levels were stable for at least recent two months were enrolled. Among them, we excluded patients with malignant diseases, thyroid disorders and/or haematological diseases.
Diurnal fluctuations in plasma glucose levels were examined for all patients with CLD (measured seven times a day: before and after every meal and at bedtime), and their mean level was defined as mean plasma glucose. On the same day, hepaplastin test (HPT), cholinesterase, serum albumin, total bilirubin, direct bilirubin, total cholesterol and platelet count were measured, in addition to HbA1C and GA levels. The G/H ratio was calculated as GA divided by HbA1C.
Laboratory measurements
Estimated HbA1C values were calculated according to the conversion formula established by Rohlfing et al.,
19
which was constructed on the basis of the Diabetes Control and Complication Trial database about mean plasma glucose and HbA1C levels, as shown below:
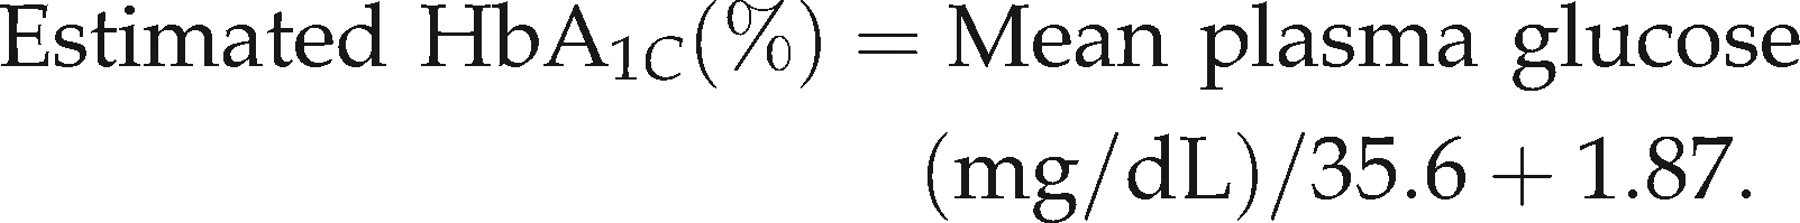
Plasma glucose levels were measured using the glucose-oxidase method. HbA1C and GA 20 levels were determined using high-performance liquid chromatography (Arkray, Kyoto, Japan). The standard values of HbA1C were between 4.3% and 5.8%, while those of GA were between 11.3% and 16.7%.
Statistical analyses
Data are shown as mean ± standard deviation. To evaluate the relationships between HbA1C, GA or the G/H ratio and different variables, single linear univariate regression analyses and stepwise multivariate regression analysis were performed. For the stepwise multivariate regression analyses, explanatory variables were mean plasma glucose, HPT, cholinesterase, serum albumin, platelet count, total protein, total bilirubin, direct bilirubin and total cholesterol. The F value for the inclusion of variables was set at 4.0. One-way analysis of variance was used to analyse GA, HbA1c or the G/H ratio for different levels of HPT. StatView for Windows version 5.0 software (Abacus Concepts, Berkeley, CA, USA) was used for all statistical analyses. Values of P < 0.05 were considered statistically significant.
Results
Although GA was strongly correlated with HbA1C in patients with CLD (R = 0.743, P < 0.0001) as well as in type 2 diabetic patients (R = 0.671, P < 0.0001), the regression line in patients with CLD was shifted to the upper compared with that in type 2 diabetic patients without CLD (y = 2.5x + 1.6 versus y = 2.6x + 8.7; Figure 1), suggesting that GA relative to HbA1C levels in patients with CLD was higher than that in type 2 diabetic patients without CLD.
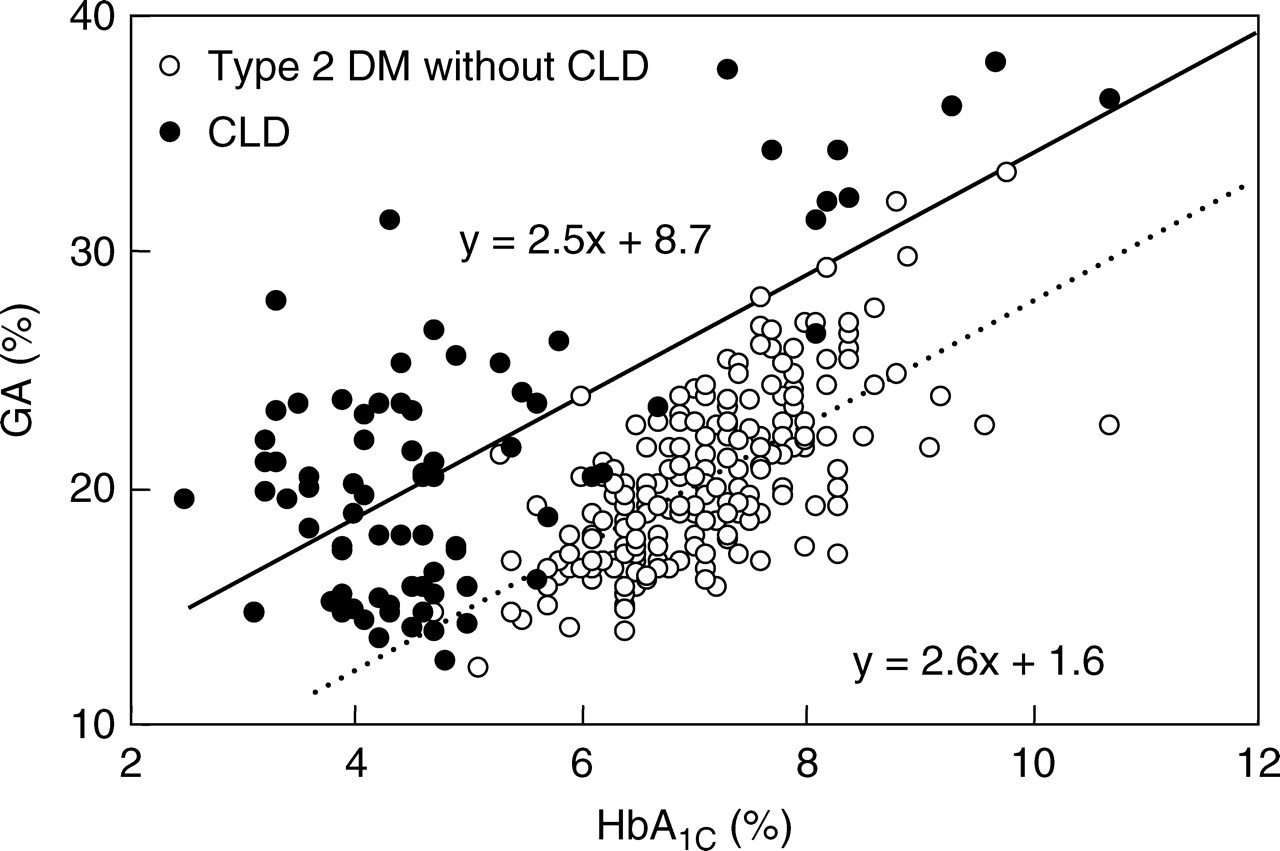
Correlation of glycated haemoglobin (HbA1C) levels with glycated albumin (GA) levels in 202 patients with type 2 diabetes mellitus without chronic liver disease (CLD) (open circles) and 82 patients with CLD (closed circles)
Correlations of GA and HbA1C with HPT are shown in Figure 2. The study patients were divided into five groups with respect to HPT levels (≥80%; 70–79%; 60–69%; 40–59%; and ≤39%). GA significantly increased but HbA1C significantly decreased as a function of decreasing HPT in patients with estimated HbA1C ≤5.8%. In these patients, the G/H ratio increased as a function of decreasing HPT (Figure 2a). In patients with estimated HbA1C >5.8%, HbA1C decreased as a function of decreasing HPT levels but GA showed no correlation with HPT levels. The G/H ratio also increased as a function of decreasing HPT levels in these patients (Figure 2b).
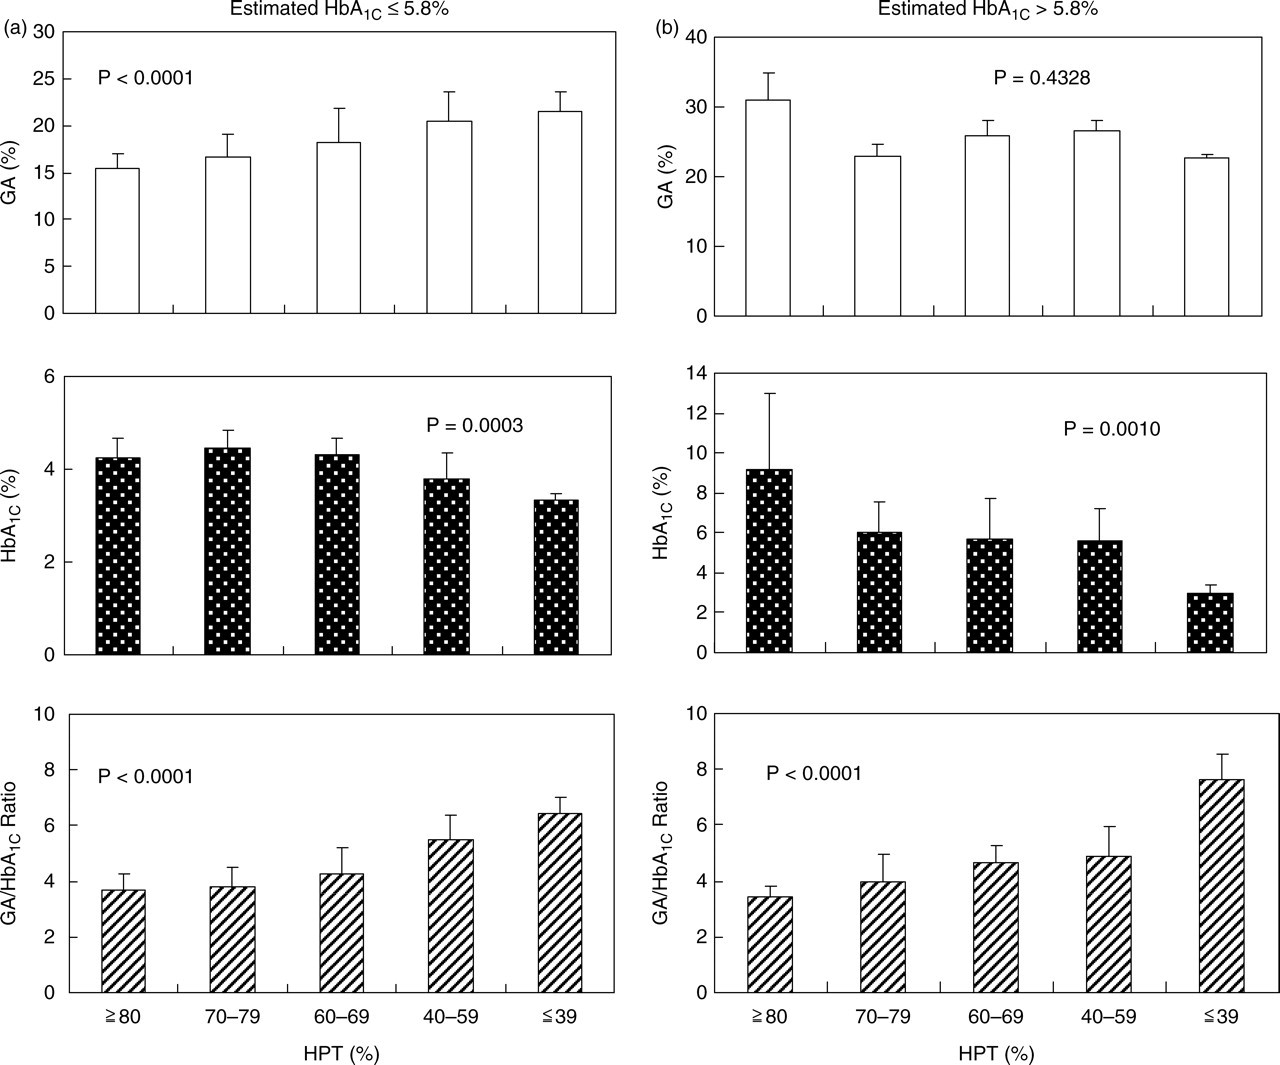
Effects of hepaplastin test (HPT) on glycated albumin (GA), glycated haemoglobin (HbA1C) and GA/HbA1C ratio (G/H ratio). (a) Patients with CLD whose estimated HbA1C levels ≤5.8% were divided into five HPT groups (≥80%, 70–79%, 60–69%, 40–59% and ≤39%), and GA (open column), HbA1C (closed column) and G/H ratio (hatched column) were calculated for each group. (b) Patients with CLD whose estimated HbA1C levels >5.8% were divided into five HPT groups (≥80%, 70–79%, 60–69%, 40–59% and ≤39%), and GA (open column), HbA1C (closed column) and G/H ratio (hatched column) were calculated for each group
Table 1 shows the correlations between GA, HbA1C and the G/H ratio with various markers for hepatic function in 82 patients with CLD. GA showed a significant inverse association with serum albumin and platelet counts, whereas HbA1C showed a significant positive association with HPT and cholinesterase and a significant inverse association with total and direct bilirubin. Both GA and HbA1C were strongly associated with mean plasma glucose. The G/H ratio showed a significant inverse association with serum albumin, HPT (Figure 3a), cholinesterase and total cholesterol, and a significant positive association with total and direct bilirubin. The G/H ratio was not associated with mean plasma glucose, demonstrating no influence of plasma glucose levels. The multivariate analysis revealed significant association of the G/H ratio with HPT (β = −0.373, P = 0.002); cholinesterase (β = −0.322, P = 0.013); and direct bilirubin (β = 0.305, P = 0.026) (Table 2).
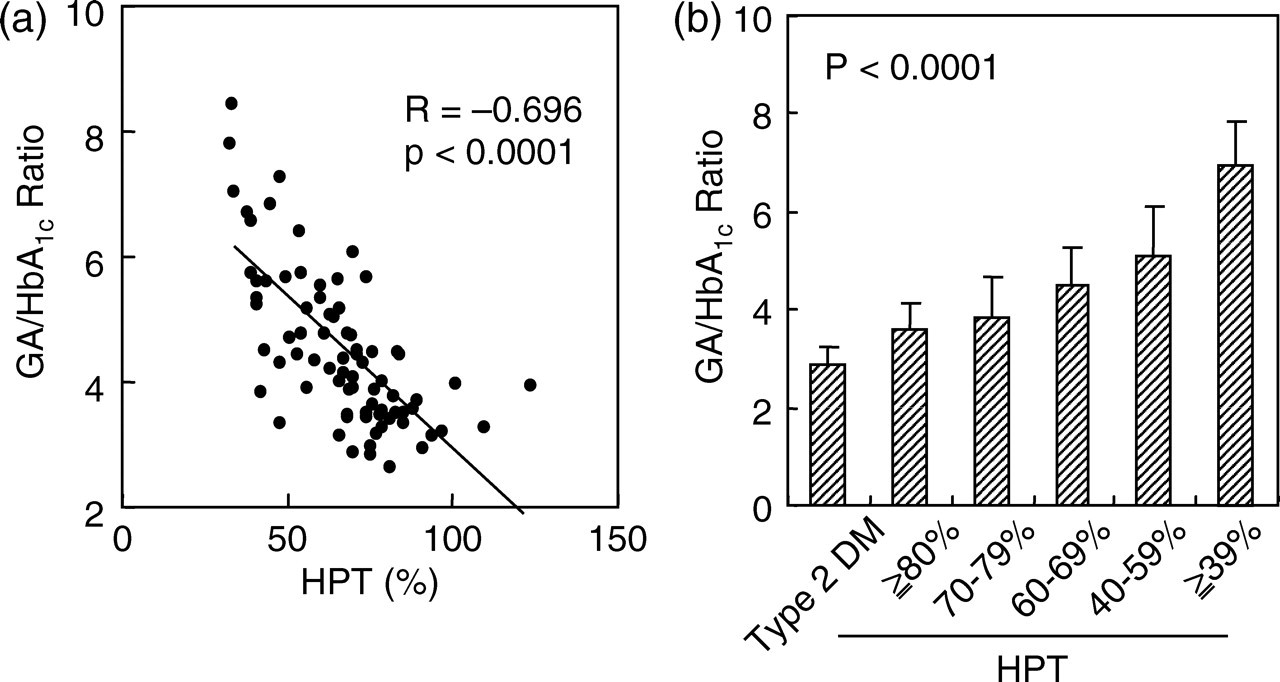
Effects of hepaplastin test (HPT) on glycated albumin (GA)/glycated haemoglobin (HbA1C) ratio (G/H ratio). (a) Correlation of HTP with G/H ratio in 82 patients with chronic liver disease (CLD). (b) Patients with CLD were divided into five HPT groups (≥80%, 70–79%, 60–69%, 40–59% and ≤39%), and G/H ratio was calculated for each group. G/H ratio was also calculated for 202 patients with type 2 diabetes mellitus without CLD
Univariate regression analyses on GA, HbA1C, GA/HbA1C ratio (G/H ratio) in 82 patients with CLD
GA, glycated albumin; HbA1C, glycated haemoglobin; G/H ratio, GA/HbA1C ratio; CLD, chronic liver disease; Alb, serum albumin; HPT, hepaplastin test; ChE, cholinesterase; PLT, platelet count; MPG, mean plasma glucose; Tbil, total bilirubin; Dbil, direct bilirubin; Tchol, total cholesterol
Stepwise multivariate regression analysis on GA/HbA1C ratio in 82 patients with CLD
Explanatory variables in multivariate regression analysis included are mean plasma glucose, HPT, ChE, serum albumin, platelet count, total protein, total bilirubin, Dbil and total cholesterol. R 2 = 0.660, F = 46.5, and P < 0.0001.
CLD, chronic liver disease; HPT, hepaplastin test; ChE, cholinesterase; Dbil, direct bilirubin
While these numbers (4.45 ± 1.23) were higher than the G/H ratio for controls (2.87 ± 0.36), lower HPT tended to be associated with a higher G/H ratio (P < 0.0001) (Figure 3b). On the other hand, no significant correlation was observed between the G/H ratio and mean plasma glucose (R = −0.096, P = 0.3897) (Figure 4), demonstrating no influence of plasma glucose levels.
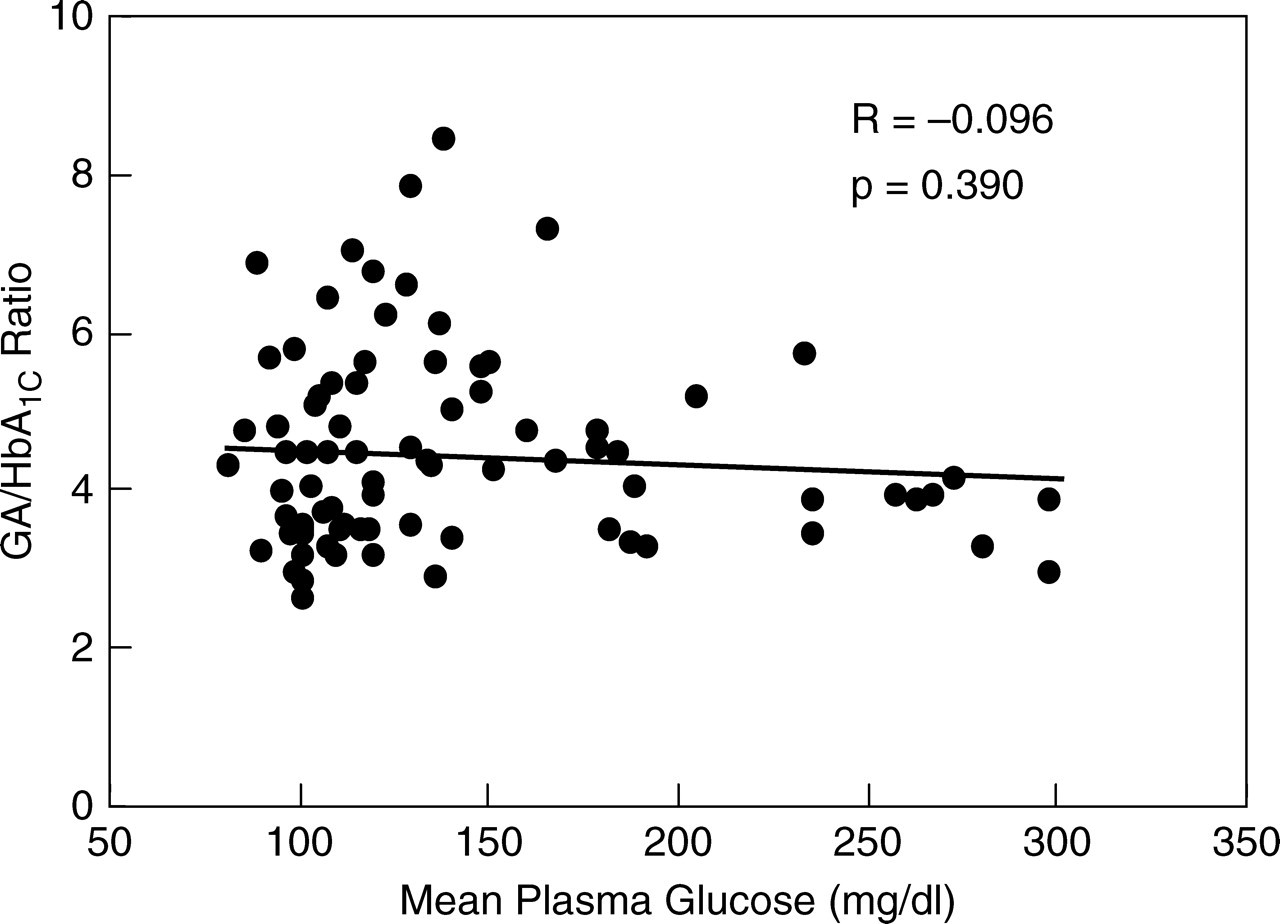
Correlation of mean plasma glucose with glycated albumin (GA)/glycated haemoglobin (HbA1C) ratio (G/H ratio) in 82 patients with CLD
Discussion
The present study showed that GA levels were increasing as a function of decreasing HPT in CLD patients with estimated HbA1C ≤5.8%. No significant association was found in patients with HbA1C >5.8%. As GA is reflected by plasma glucose levels, the effect of progression of liver disease in increasing GA levels is thought to be masked in patients with high plasma glucose levels. In this relation, Watanabe et al. 15 have shown that GA levels are higher in cirrhotic patients with progression of liver disease. Their study subjects comprised only 17% patients with concomitant diabetes mellitus and thus the effect of glycaemia on GA might show little interference with the effect of hepatic function on GA levels.
In our study, HbA1C levels significantly decreased as a function of decreasing HPT in both patients with estimated HbA1C ≤5.8% and those with HbA1C >5.8%. Because HbA1C levels are strongly correlated with mean plasma glucose, HbA1C levels reflect plasma glucose levels as well as hepatic function, indicating that HbA1C alone cannot be a marker for hepatic function.
The G/H ratio is affected by various disorders influencing HbA1C levels, such as haemolytic anaemia, renal anaemia and variant haemoglobin. 5,6 It is also affected by various conditions that influence GA levels, such as nephrotic syndrome, thyroid dysfunction and glucocorticoid administration. 8 In CLD, hypersplenism reduces the life span of erythrocytes, resulting in a lower HbA1C level, and conversely, a decrease of albumin catabolism rather than an increase in the GA level. Actually, the regression line in patients with CLD was shifted upward compared with that in type 2 diabetic patients without CLD (Figure 1). The G/H ratio has thus been considered to be high in CLD in relation to plasma glucose levels. To the best of our knowledge, there is no study to examine the G/H ratio in patients with CLD.
We have previously shown that fasting plasma glucose does not represent a significant explanatory variable for the G/H ratio in type 2 diabetic patients with stable glycaemic control and without any complications. 18 Furthermore, we found that even in subjects without diabetes mellitus, fasting plasma glucose and plasma glucose at 2 h after glucose loading are not associated with the G/H ratio. 21 Some previous studies have already shown that, in both diabetes and non-diabetic disease, body mass index offers a significant negative explanatory variable for the G/H ratio. 18,21
In the present study, the G/H ratio did not exhibit a significant correlation to plasma glucose in patients with CLD. In contrast, the G/H ratio exhibited significant negative correlations to HPT, cholinesterase, serum albumin, platelet count and total cholesterol, and significant positive correlations to total bilirubin and direct bilirubin. Multivariate analysis showed that, of these laboratory tests, including mean plasma glucose, HPT, cholinesterase and direct bilirubin represented independent explanatory variables. As the G/H ratio exhibited a significant correlation to HPT and HPT is considered one of the most useful indicators for hepatic function in CLD, the G/H ratio is found to be a clinical indicator influenced by hepatic function.
As the half-life of albumin is shorter than that for haemoglobin, rapid changes in glycaemic control are known to cause changes in the G/H ratio. 22 The G/H ratio may thus be unsuitable as an indicator of hepatic function in patients with unstable glycaemic control. This point must be kept in mind when interpreting the G/H ratio in clinical settings.
In CLD, neither HbA1C nor GA properly reflects glycaemic control. We therefore recently devised an indicator called ‘CLD-HbA1C’, which was defined as the average of HbA1C and GA/3. 23 CLD-HbA1C has recently been shown to represent a glycaemic control indicator independent of hepatic function. Based on the above findings, simultaneous measurement of HbA1C and GA can be recommended in patients with CLD. Hepatic function and glycaemic control state can be ascertained by calculating the G/H ratio and CLD-HbA1C, respectively. This is particularly useful in patients with advanced CLD complicated by impaired glucose tolerance or diabetes mellitus in clinical settings.
While the G/H ratio is relatively high in CLD, this ratio is independent of the plasma glucose level and exhibits a significant correlation to various clinical laboratory tests used as indicators of hepatic function, suggesting that the G/H ratio may serve as a useful indicator for hepatic function. Therefore, when physicians encounter diabetic patients with an elevated G/H ratio, CLD should be suspected.
DECLARATIONS