
Abstract
Background
To assess the accuracy and precision of the Roche Performa and Medisense Optium Xceed (5 and 10 s reading) blood glucose meters.
Methods
Capillary blood samples were taken from 100 patients attending a diabetes centre and blood glucose measured on Roche Performa (n = 4) and Medisense Optium Xceed 5 s (n = 2) and 10 s reading (n = 2) meters. Venous plasma glucose from samples taken simultaneously was measured by the laboratory hexokinase method as reference standard. Imprecision was determined on the meters by replicate analysis (n = 20) of control solutions provided by the manufacturers and also patient venous whole-blood samples. Accuracy was assessed relative to the reference method by Bland–Altman plots, Passing and Bablok regression analysis, and both Clarke and consensus error grid analysis. Coefficients of variation (CVs) were calculated to determine imprecision.
Results
Bland–Altman and Passing–Bablok analysis confirmed significant systematic bias for all meters, with relative under-reading of higher glucose concentrations. Error grid analysis showed that <5% readings exceeded ±20% (or ±0.83 mmol/L for readings <4 mmol/L) deviation from the reference method (1%, 2% and 4% for the Roche, Optium 5 and 10 s meters, respectively). CVs were all <4% for the control solutions and <6% for patient samples.
Conclusions
Both Roche Performa and Medisense Optium glucose meters (5 and 10 s readings) perform satisfactorily and are acceptable for operational use.
Introduction
Self-monitoring of blood glucose (SMOBG) is the recommended practice for patients with type 1 diabetes, 1 although its role in type 2 diabetes is more contentious, 1 with recent studies suggesting that the practice does not necessarily improve outcomes. 2,3 A recent systematic review, however suggested which type 2 diabetic patients might benefit most from SMOBG. 4 Glucose meter technology has evolved considerably since the inception of SMOBG with more compact meters, testing strips based on electrochemical (as opposed to reflectance) principles, using smaller blood volumes and faster reaction times. The utility of SMOBG is critically dependent on the accuracy and reliability of the meters, and widely varying analytical standards have been proposed. 1 The National Committee on Clinical Laboratory Standards recommended that blood glucose levels should fall within ±20% of laboratory glucose at >5.5 mmol/L and ±0.83 mmol/L if the glucose concentration is ≤5.5 mmol/L, 5 similar to the tolerances required by the ISO 15197 standard. 6 The Clinical and Laboratory Standards Institute ‘88 goal stipulated more stringently that results with meters should be within 10% of target values or ±0.3 mmol/L, whichever is larger. 1 The American Diabetes Association set the most stringent analytical goal of analytical error <5%. 7 A novel approach, developed by Clarke et al. 8 and later refined by Parkes et al., 9 is based on grids designed to identify clinically significant errors.
It is also recognized that the molar concentration of glucose (mmol/L) is higher in plasma than in whole blood, reflecting the higher water content of plasma compared with whole blood. 10 A constant factor of 1.11 is now recommended for meters to convert the concentration of glucose in whole blood to the equivalent plasma concentration. 10 For some meter manufacturers, this has necessitated a calibration adjustment, with potential introduction of bias. Although glucose meter evaluation studies have previously been undertaken in New Zealand, 11,12 none has been reported since the above recommendations were made and following the more recent evolutions in meter technology. We therefore undertook a controlled evaluation of locally available glucose meters in a New Zealand Diabetes Centre.
Patients and methods
The latest models of the Roche AccuChek Performa (Roche Diagnostics GmbH, Mannheim, Germany) and Medisense Optium Xceed (both 5 and 10 s reading models) (Abbott Diabetes Care Inc Alameda, CA, USA) blood glucose meters were evaluated. Four AccuChek Performa and two each of the Optium 5 and 10 s reading meters, giving a total of eight meters, were studied. Consistent reagent strip lot numbers were maintained throughout the study period, with the exception of one Optium (5 s reading) meter where a lot of change was made after 87 samples.
Capillary blood samples were obtained from adult subjects (n = 100, including 32 with type 1 diabetes and 68 with type 2 diabetes) by diabetes research nurses using a sterile lancet fixed in a spring-loaded device and applied directly from the fingertip to the reagent strips. Successive drops of blood from the same site were used for near-simultaneous analysis with each meter in random order. Patients were sampled in groups of 5–10 during attendance at outpatient clinics and were not fasted. High and low reading glucose quality control samples were applied to each meter before each batch of testing, and testing was only undertaken if the results fell within acceptable limits. Separate high control solutions were used for the Roche and Optium meters, with mean glucose concentrations of 17.2 and 15.7 mmol/L, respectively. Separate low control solutions were used for the Roche and Optium meters, both with mean glucose concentrations of 2.5 mmol/L. Acceptable performance limits, as stipulated by the manufacturers, were between 1.7 and 3.4 mmol/L for the Performa low control solution and between 1.6 and 3.3 mmol/L for the low Optium control solution. Acceptable performance limits, as stipulated by the manufacturers, were between 14.4 and 19.5 mmol/L for the Performa high control solution and between 11.8 and 20.1 mmol/L for the high Optium control solution. Prior training was overseen by the institutional Point of Care Testing Coordinator (CB). Venepuncture was undertaken at the same time using a BD vaccutainer device collecting 5 mL blood from the ante-cubital vein into a 5 mL lithium heparin tube, which was then gently inverted. The tube was then centrifuged on site at 4000 rpm for 9 min and the supernatant plasma was delivered to the reference laboratory for analysis within 30 min. Plasma was analysed on the Abbott ci8200 automated analyser (Abbott Laboratories, Chicago, IL, USA) by the routine hexokinase method (inter batch coefficient of variation [CV] 1.8%). Haematocrit was also measured on a capillary aliquot of the venous blood sample by microcentrifugation (9000 rpm for 9 min) and patients were not included for analysis if less than 0.30. Excluding the centrifugation step, the procedures took 5–10 min per patient.
For each sample, mean values were calculated for each of the meter groups, analysing data from the Optium 5 and 10 s meters separately. Thus each data point represented the mean of four meters for the Performa and two each for both of the Optium meters. Error grid analysis was performed 8,9 comparing mean capillary blood glucose levels for each meter group with the reference laboratory venous plasma glucose to determine the potential clinical significances of the differences (EP Evaluator 8.0.0.100, David G Rhoades Associates Inc). Bland–Altman analysis was also undertaken (Sigmastat for Windows, version 10) in which the differences between methods (meter minus reference) were plotted against the average. 13,14 Spearman rank correlation coefficient analysis was undertaken for the differences versus the means on the Bland–Altman plots, to investigate possible systematic bias and also the effect of haematocrit. Passing–Bablok regression analysis was also undertaken. Imprecision data were provided by the replicate analysis (n = 20) of high- and low-quality control solutions for each meter between sampling intervals. Imprecision data were also derived from replicate analysis (n = 20) of patient venous whole-blood samples, with mean blood glucose concentrations of 15.5 and 5.9 mmol/L, respectively.
The study was approved by the Upper South B Regional Ethics Committee (PO Box 3877, Christchurch, New Zealand) and all patients gave informed written consent.
Results
Figure 1 shows Bland–Altman difference plots for each of the meters compared with the laboratory reference method for venous plasma glucose, with limits of agreement shown. Visual inspection of the Bland–Altman plots indicates a systematic bias, with relative under-reading of higher values, confirmed by the significant negative Spearman rank correlations (all P < 0.001) shown in Figure 1. The bias is also shown by Passing–Bablok regression analysis for meter glucose (vertical axis) versus reference glucose (horizontal axis) with slopes of 0.93 (95% confidence intervals [CI] 0.90–0.96), 0.91 (95% CI 0.87–0.94) and 0.91 (95% CI 0.87–0.95) for glucose concentrations on the Performa, Optium 5 and 10 s meters, respectively, relative to venous plasma glucose. The corresponding intercepts on the vertical axis were 0.58 (95% CI 0.35–0.84), 0.63 (95% CI 0.34–0.91) and 0.58 (95% CI 0.25–0.93).
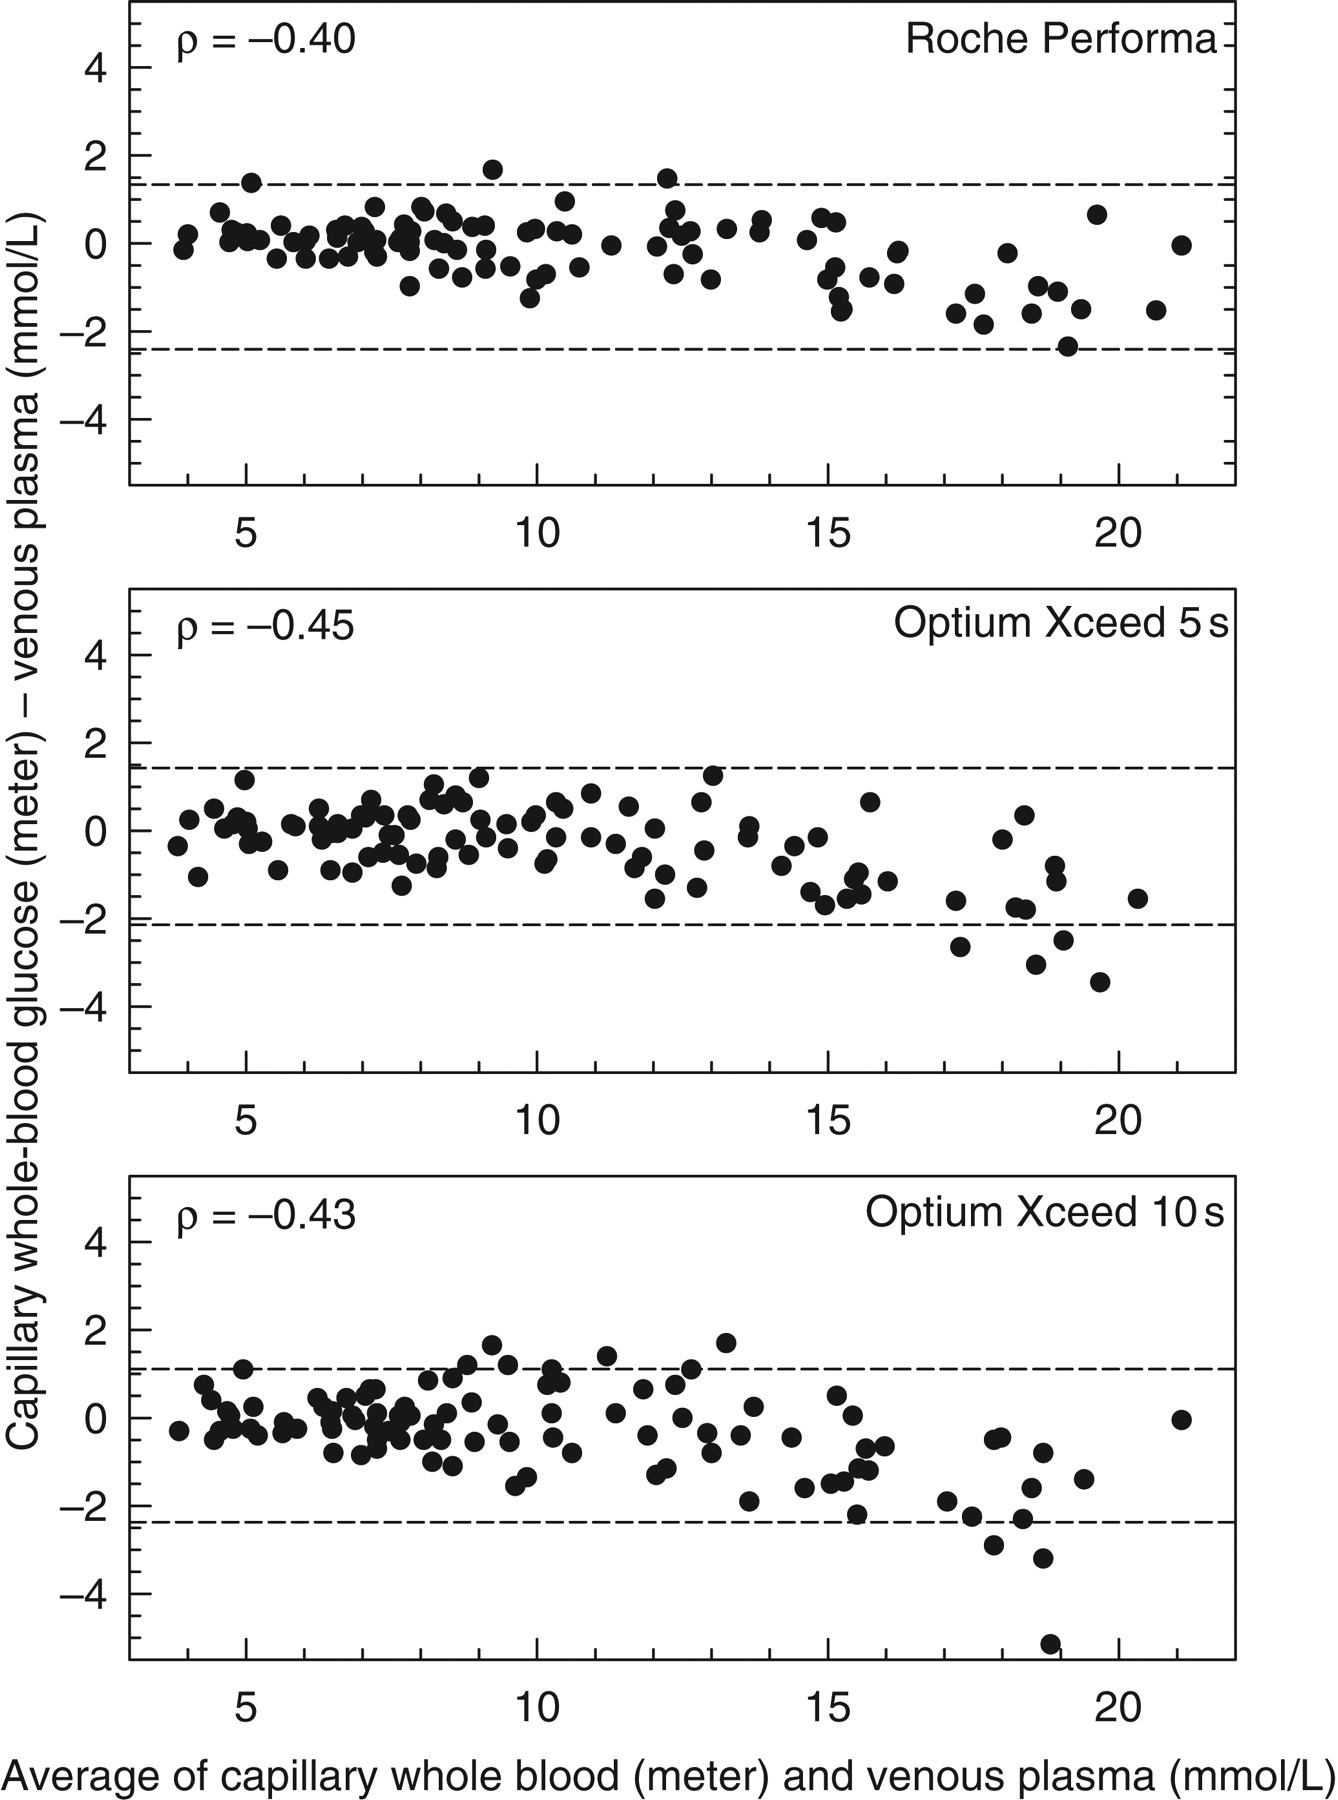
Bland–Altman difference plots. Dashed lines show 95% limits of agreement. Spearman rank correlations are shown (all P < 0.001)
Overall median (±95% CI) biases from Bland–Altman analysis were 0.04 (−0.15 to 0.18) mmol/L, −0.25 (−0.45 to 0.01) mmol/L and −0.15 (−0.51 to 0.15) for the Roche Performa, Optium 10 s and Optium 5 s meters, respectively, and 0.52 (−1.26 to 1.95)%, −2.78 (−4.55 to 0.05)% and −1.36 (−4.8 to 1.00)% when expressed as percentages.
Error grid analyses, using both the Clarke (top panels) and consensus methods (bottom panels), are shown in Figure 2. From the Clarke grid, 1% of readings fell outside the limit of either ±20% or ±0.83 mmol/L for the Roche Peforma meter. The corresponding figures were 2% and 4%, respectively, for the Optium 5 and 10 s meters, respectively. Imprecision data for control solutions are shown in Table 1. For patient samples, the CVs were 4.5%, 3.5% and 4.1% for replicate analysis (n = 20) of a sample with a mean blood glucose concentration of 15.5 mmol/L for the Roche Performa, Optium 5 and 10 s meters, respectively. The corresponding CV for replicate analysis (n = 20) of a patient sample with a mean blood glucose concentration of 5.9 mmol/L were 3.8%, 5.8% and 4.6%.
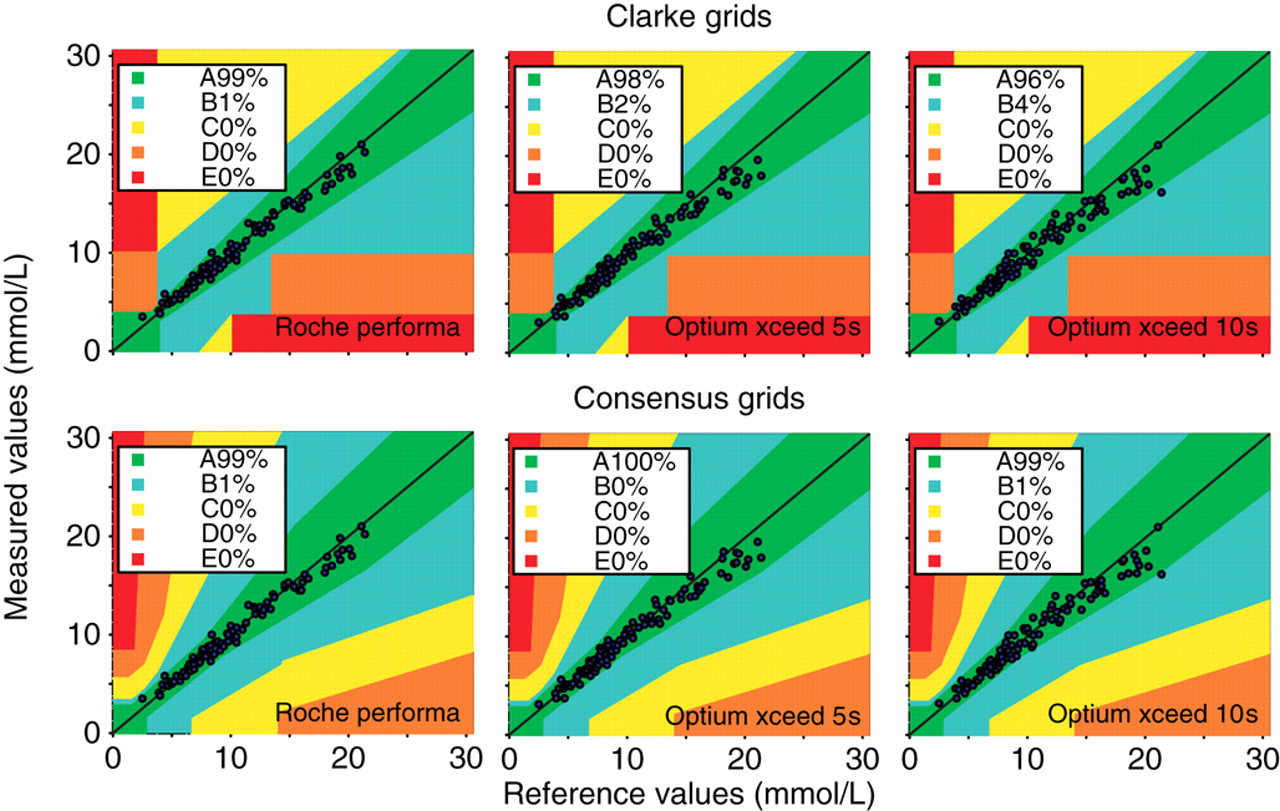
Clarke and consensus error grid analysis. Zone A indicates <20% deviation from the reference value or ±0.83 mmol/L if <4 mmol/L. Zone B indicates no change in treatment or benign treatment. Zones C–E indicate progressively more harmful degrees of misclassification
Coefficients of variation (CV) for glucose meters based on replicate analyses (n = 20) of control solutions between measurement batches
Low control solution concentration 2.5 mmol/L for all meters and high control solution concentrations 17.2 and 15.7 mmol/L for Roche and Optium meters, respectively
Median haematocrit was 0.42 (95% CI 0.40–0.43). There was a negative Spearman rank correlation between the difference in glucose concentration (mean meter reading minus laboratory reference method) and haematocrit, R = −0.289, P = 0.004 and R = −0.345, P = 0.0007 for the Optium 5 and 10 s reading meters, respectively, although not significant for the Roche Performa meter, R = −0.145, P = 0.15.
Discussion
All meters studied fulfilled the ISO15197 standard, 6 which stipulates that <5% readings should fall outside the limits of ±20% from the reference value or ±0.83 mmol/L if <4 mmol/L.
This is supported by Clarke error grid analyses, where results fell predominantly in zone A, indicating <20% deviation from the reference value. The few results outside these tolerances all fell in zone B, signifying no change in treatment or benign treatment. No results fell in zones C, D or E (as also shown in consensus error grid analysis), which would otherwise indicate progressively more harmful degrees of misclassification. Few patients in our comparisons fell into the hypoglycaemic range. It would have been desirable to compare more samples in this low range. Both types of error grid analysis are designed to determine clinically relevant performance limits, 8,9 although the consensus error grids are considered to be a refinement of the original Clarke method, based on expert consensus and with more congruent boundaries between categories. The Bland–Altman plots also give limits of agreement, signifying where 95% of the differences lie, which, although within ±20% for all the meters, needs to be interpreted with caution given the significant bias, 14 indicating that the mean difference varies according to the average, with relative under-reading at higher values. The negative bias is supported by the Spearman rank correlation coefficients, which are highly significant and not removed by logarithmic transformation of the raw data. Passing–Bablok similarly shows the biases. Despite this, the bias seen is not clinically significant, supported by the other approaches described. The median biases from Bland–Altman analysis similarly need to be interpreted with caution. It is apparent, however, that the more stringent tolerances of meter readings being within ±10% of the reference standard 1 are not met, and the 5% goal proposed by the American Diabetes Association (ADA) is probably unrealistic and not clinically relevant. 7 In this study, we have used venous plasma measured by a routine method in the clinical laboratory as the reference standard. This is an appropriate comparator to use, given the International Federation of Clinical Chemistry (IFCC) stipulation that capillary whole-blood glucose measured on meters should ‘read like plasma’ 10 and for which appropriate calibration adjustments have been made by the manufacturers. We have therefore demonstrated a robust agreement of all the meters with the reference standard, although with a slightly tighter distribution of results for the Roche meter, also supported by the better imprecision at higher levels. Some relationship was also shown between haematocrit and differences from the reference method for the Optium but not the Roche meters, and caution needs to be exercised in interpretation of all meter glucose results when haematocrit departs significantly from normal. 1 In routine use, haematocrit is usually not known, and in critical care settings this may be a potentially confounding factor. In our study, three patients were excluded because of low haematocrit (<0.30), a value arbitrarily chosen, although considered to be a significant departure from normal. Lot to lot variation in performance of reagent strips is another potential confounding factor, which also needs to be investigated further. It should be noted, however, that our results were obtained under meticulously controlled conditions and with the oversight of the institutional Point of Care Coordinator (CB). It would be instructive to replicate the study comparing results from patients' own testing under field conditions.
Both Roche Performa and Medisense Optium glucose meters (5 and 10 s reading) are accurate within ±20% of the laboratory reference standard, perform satisfactorily on error grid analysis and are acceptable for operational use for Point of Care Testing.
Footnotes
Acknowledgements
We are grateful to Flo Logan and Victoria Halliday for managing the patients and sample handling, and to the patients for their participation. Roche Diagnostics are acknowledged for logistic support and providing funding and consumables. Protocol design, data analysis and manuscript preparation, however, were all undertaken independently. We are grateful to Dr John Livesey, Endolab for helpful advice on statistical analysis of the data and to Dr Michael Lever for assistance with the figures.