
Abstract
Background
Serum free testosterone (FT) concentrations are commonly requested, but because reference FT methods are too laborious various calculational algorithms for FT based on total testosterone (TT) and sex hormone-binding globulin (SHBG) are frequently used. This study provides the first large-scale evaluation of the predictive accuracy and sources of variability for different FT formulae compared with direct laboratory measurements.
Methods
Using a large data-set of direct FT measurements by centrifugal ultrafiltration, the predictive accuracy of five different formulas for cFT (four existing plus a new formula) is evaluated in 3975 consecutive blood samples. In a second data-set of 124 samples from a reference panel of healthy eugonadal young men, we estimate the relative influence of the five algorithms and eight different TT and two SHBG assays including all available commercial total TT and SHBG assays together with a gas chromatography/mass spectrometry T reference method.
Results
cFT formulae show wide discrepancies with equilibrium-binding algorithms showing systematic overestimation relative to direct FT measurements, whereas two empirical cFT methods were more concordant. Variations between commercially available TT immunoassays have a strong impact on calculation of FT with TT assays contributing 82.2% of overall variance compared with 13.7% for the cFT algorithms and 4.1% for the SHBG assays.
Conclusions
If FT measurements are requested and direct measurement impractical, cFT formulae using TT and SHBG immunoassays provide an approximation to direct FT measurement that is strongly dependent on the TT, cFT formula used and, to a lesser extent, SHBG immunoassays.
Introduction
Traditionally, androgen deficiency is a clinical diagnosis confirmed by biochemical assay of blood testosterone and related reproductive hormones. 1 The clinical diagnosis focuses on identifying underlying pathological disorders of the hypothalamus, pituitary and/or testis that define the functional type (primary, secondary) of hypogonadism and its pathological aetiology, together with recognizable patterns of presenting symptoms, mostly subtle and non-specific. Biochemical confirmation of the clinical diagnosis relies on hormone assays that confirm persistent impairment of endogenous testosterone production. This signifies a substantial and sustained reduction in net androgen action on tissues because of the underlying, usually irreversible, pathological disorder of the gonadal axis. These principles are, however, hard to apply to age-related androgen deficiency, so-called ‘andropause’ or various synonyms, both because ageing is not a recognized pathological state as well as the substantial overlap of non-specific symptoms common to male ageing and androgen deficiency in younger men. 2 Hence attempting to define age-related androgen deficiency in individual men shifts the diagnostic emphasis heavily onto biochemical measures to define androgen deficiency by measurement of blood testosterone.
However, immunoassays of blood total testosterone (TT) have significant limitations on specificity, which emerge as method-specific variability in measurements. 3 This is worst with low circulating TT concentrations such as in children, women and androgen-deficient men where the systematic and random errors relative to the reference method of mass spectrometry is most evident. 4,5 In trying to extract more diagnostic information from serum TT immunoassay measurements, various derived testosterone measures such as ‘free’ T (FT), ‘free’ T index (FTI), ‘bioavailable’ testosterone (BT) have been proposed. Such derived testosterone measures, based loosely in theory on the free hormone hypothesis, 6,7 may be directly measured in the laboratory or calculated from TT and sex-hormone binding globulin (SHBG) measurements. 8,9 However, direct measurements of FT by equilibrium dialysis 10–12 or centrifugal ultrafiltration 13,14 are laborious and non-automatable, while a direct immunoassay 15,16 is analytically invalid for measurement of FT. 17–19 Consequently, most clinical studies use the more convenient calculated measures. These calculations employ either equilibrium binding 20,21 or empirical 8,9 equations. However, predictions from these calculations have undergone validation only in small data-sets within research laboratories, whereas large-scale evaluation from a routine diagnostic laboratory questions their accuracy in measuring FT. 9
This study critically examines the predictive accuracy of cFT formulae using both a large-scale validation study as well as application to a reference panel of healthy young men with rigorously verified normal reproductive function.
Methods
Study design
This study aimed to evaluate the accuracy and variability of cFT formulae in two parts. First, we evaluated the predictive accuracy of four existing and one new calculated FT (cFT) formulae using a panel of 3975 consecutive blood samples from a routine diagnostic laboratory services for which direct measurement of FT by centrifugal ultrafiltration was available together with contemporaneous immunoassays of TT and SHBG. Samples were obtained from both sexes (87% male, n = 3475) over an age range of 18–92 y as described previously. 9 Secondly, we evaluated the variability of cFT formulae using a comprehensive range of commercially available automated immunoassays of seven TT immunoassays and a gas chromatography/mass spectrometry (GC/MS) assay as well as both available SHBG immunoassays in a reference panel of 124 healthy, eugonadal young men with rigorously verified normal reproductive function. 5 These men provided blood samples between 08:00 h and 10:00 h after a light breakfast and had serum stored-frozen at −70°C until batchwise analysis.
Assays
In the first part, FT was measured by centrifugal ultrafiltration 14 and TT and SHBG by Immulite (Siemens DPC, Los Angeles, CA, USA) in a quality-controlled endocrinology laboratory as described. 9
In the second part, reproductive hormones were evaluated in a total of 15 laboratories, belonging to the top 20% for precision and bias (vs. median for the respective assay system) according to the National External Quality Assurance programme operated jointly by the Royal Australian College of Pathologists and Australasian Association of Clinical Biochemists. TT values were measured by GC/MS at the Australian Sports Drug Testing Laboratory, National Measurement Institute (coded T1 as reference method) and by commercial automated analyser immunoassays comprising Beckman Coulter Access, Siemens Advia ACS-180, Abbott Architect i2000/AxSym, Siemens Centaur, Roche Elecsys E 170/E 2010, Siemens Immulite 2000, Johnson & Johnson Vitros ECi (randomly coded T2–T8). Further details of the methods are described elsewhere. 5 Subsequently, SHBG was measured using two available SHBG assays (Siemens Immulite 2000, Roche Elecsys E170; randomly coded as S1 and S2) in five different laboratories. In summary, TT for each sample was analysed using eight different assays, whereas SHBG concentrations were measured using two different assays.
cFT equations
In addition to the four published equations for cFT,
8,9,20,21
we developed an additional novel empirical formula. Although our previous empirical formula (FTA)
9
was more accurate in predicting laboratory measurements of FT compared with Sodergard (FTS), Vermeulen (FTV) and Nanjee-Wheeler (FTN) methods, it had the disadvantage of requiring two formulae, one for TT < 5 nmol/L and one for TT ≥ 5 nmol/L, in order to minimize computation of impossible negative values, which were observed in 19/3975 (0.5%) of samples with extreme TT and/or SHBG concentrations. To improve upon this empirical cFT equation, we derived a new empirical algorithm, which avoided negative estimates and used only a single equation using all male and female samples. Using the variables FT, TT
2
and log10SHBG (following the Nanjee-Wheeler approach), we created a variety of combinatorial formulae for evaluation by bootstrap resampling to identify the best-fit model according to entropy reduction (Akaike Information Criterion [AIC]) criterion. In addition, the best formula was compared with the best-fit FT formulae created by the software TableCurves 3D (Table Curve 3D surface-fit simple equations). The formula of our novel, empirical algorithm is:

Data analysis
Bootstrap resampling using S-Plus (version 2000, Insightful Corp, Palo, Atto, CA, USA) was used to evaluate the models utilizing 1000 replications of a random selection of a 60% sample (with replacement) from the full data-set. The optimal model was evaluated using the AIC (defined as AIC = χ 2 − 2df) to rank goodness of fitness of bootstrap models. The model having the AIC value closest to zero is considered the best-fit because of the lowest residuals possessed by them.
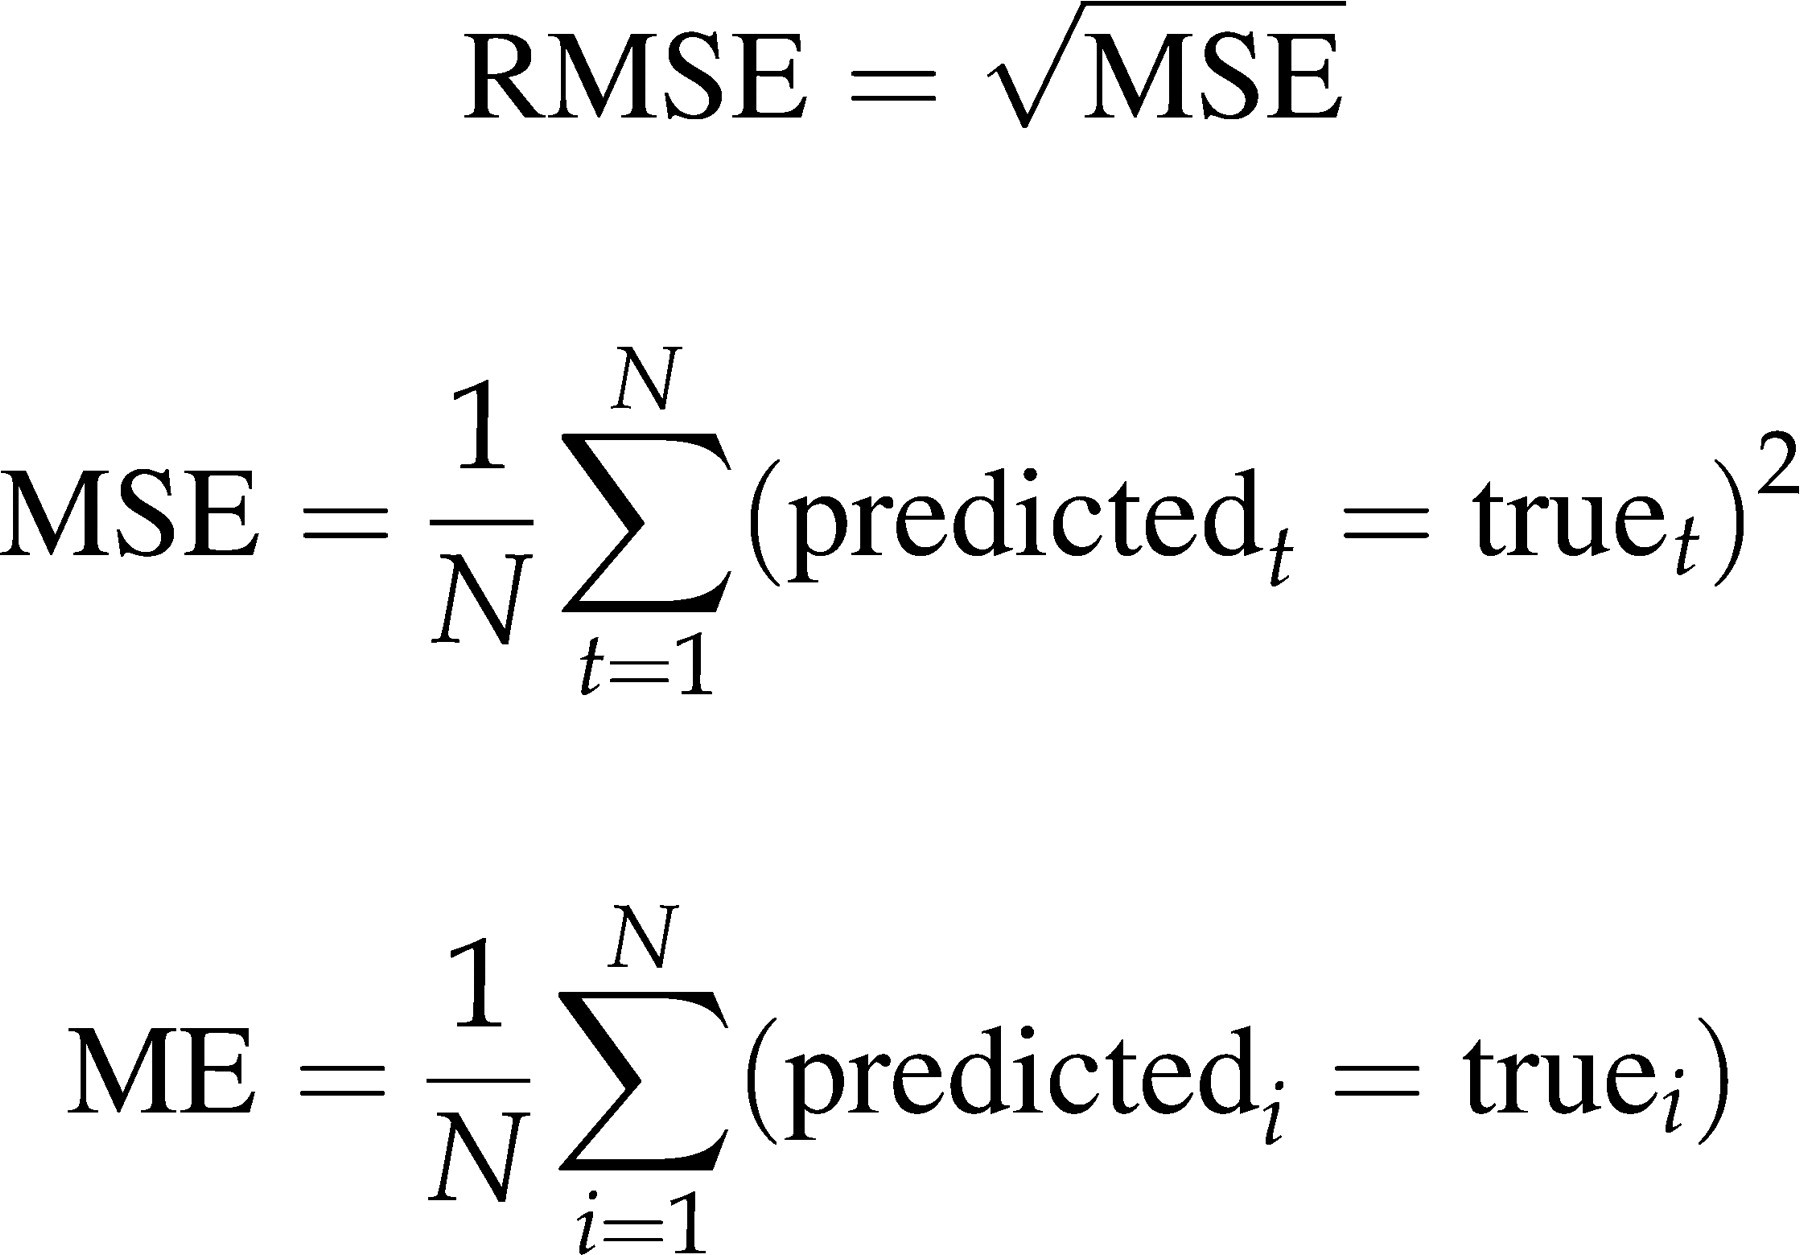
To estimate predictive accuracy, deviations between the model predicted and the laboratory measured values of FT were compared for different models using the criterion of the root mean-squared prediction error method
22
and Bland-Altman deviance approach.
23
These methods compared the accuracy and precision between the five cFT algorithms with reference to the direct laboratory FT measurement. In this method the root mean-squared prediction error (RMSE) is a measure of precision and the mean prediction error (ME) is a measure of bias. They are defined as follows:
For graphical three-dimensional (3D) plots, smoothed distribution of laboratory FT and five cFT results were plotted against TT and SHBG using a smoothing window of 10 data points and a smoothing surface at intervals of 15 on x and y axes using Sigmaplot (version 9, Cranes Software, Melbourne, Australia) software. For the graphical presentation (but none of the computations), due to strong effects of outliers on the smoothing algorithm, samples with extreme values (>99.5 percentile) in TT (>52 nmol/L) and SHBG (>186 nmol/L) were excluded from the graphical presentation to facilitate visual focus on the bulk of samples. This resulted in omission of 36/3795 (0.9%) of samples from the 3D graphs.
Results
In the first part of the study, Table 1 provides descriptive statistics of the 3975 samples, measured TT, SHBG and FT, cFT estimates and their deviations from measured FT values. Table 2 compares the goodness-of-fit (AIC), root mean-square predictive error (RMSE) and deviation plot estimates for each of the five cFT algorithms. According to both the goodness-of-fit criterion (AIC) as well as the predictive error (RMSE), the ranking of the five cFT estimates was FTA > FTZ > FTV > FTN > FTS.
Characteristics of subjects and laboratory free testosterone (FT) and five calculated FT formulae (FTA, FTN, FTS, FTV, FTZ)
*For each variable, the percentiles display the quartiles (first = 25 centile, second = 50 centile, third = 75 centile), the 95% confidence intervals (2.5th and 97.5th centiles) and the range defined by the minimum (0 centile) and maximum (100 centile). Note that minima display whether the formula provides impossible negative estimates at extremes. TT, total testosterone; SHBG, sex hormone-binding globulin
Ranking of the five computed free testosterone (FT) from best to worst for prediction of the laboratory FT
Five different algorithms to calculate FT are ranked according to their goodness-of-fit by the Akaike Information Criterion (AIC), a summary measure of entropy in the data. An AIC value closest to zero is considered the best fit. Precision (root mean-squared error) and bias (mean error) are calculated as described by Sheiner and Beal. Confidence interval (95% confidence limits) of deviance calculated as described by Bland and Altman
The performance of the five cFT algorithms is illustrated in box plots (Figure 1) and 3D plots (Figure 2, see online for colour). In both illustrations it is clear that the shapes of FT, FTA and FTZ are reasonably congruent, whereas the patterns of FTN, FTS and FTV are different. The differences between FTZ and FTA in model goodness-of-fit and in predictive error were small.
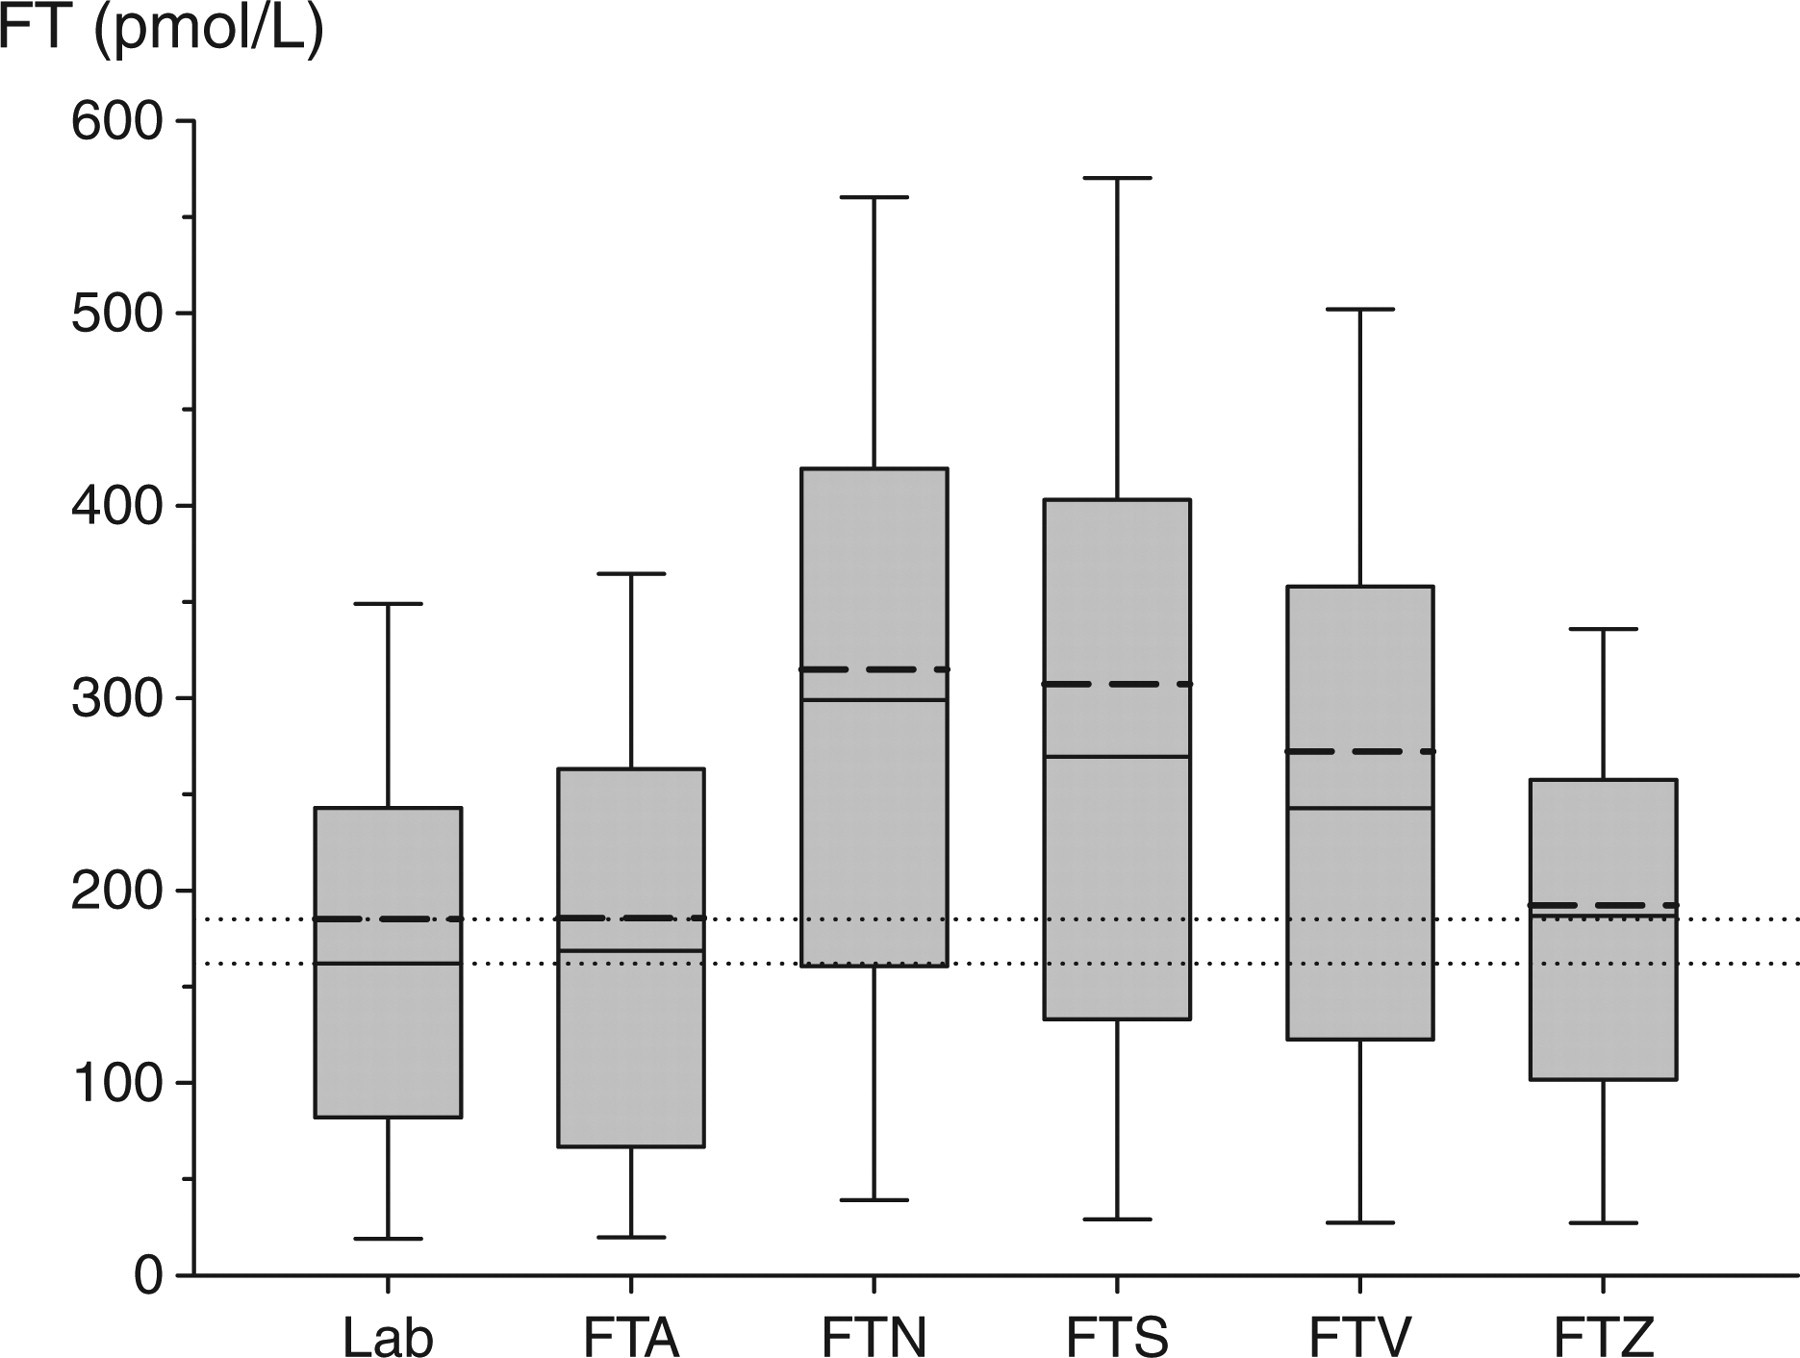
Comparison of the reference method of free testosterone (FT) measurement with five different calculational methods in 3975 samples based on total testosterone (TT) and sex hormone-binding globulin (SHBG) measurement. The horizontal dotted lines represents the mean (185 nmol/L) and median (162 nmol/L) of laboratory FT measurements. For each method, the median is represented by short, unbroken line and the mean by a thick broken line within the boxes. Boxes cover the interquartile range, whereas the whiskers determine the fifth and 95th centiles
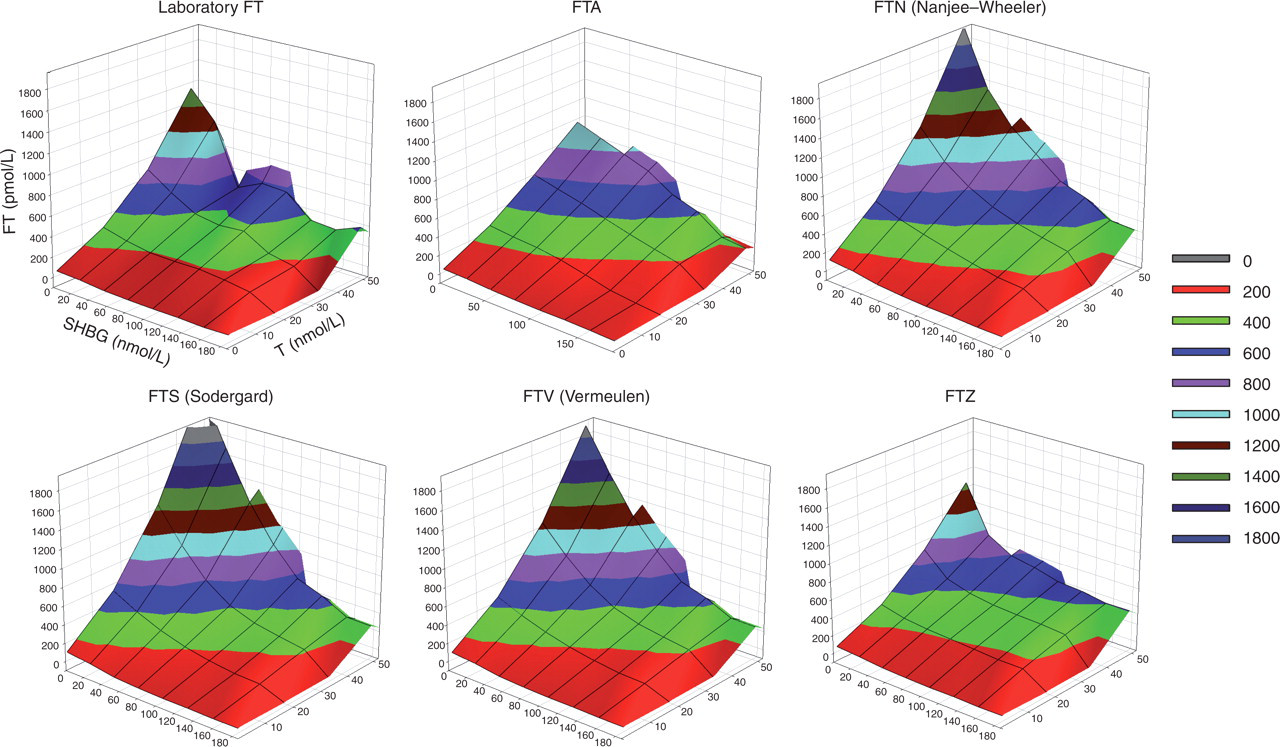
Three-dimensional graphs of laboratory measured free testosterone (FT) and the five calculated FT formulae. To enhance visual comparability, the surface is coloured according to the FT range using a shading code, which is defined in the inset on the right. Note that extreme upwards deviations in the FTS, FTV and FTN formulae with extreme total testosterone and/or sex hormone-binding globulin values. A colour version of this figure is available as supplementary online data
In the second part of the study, the five cFT estimates were calculated using all eight TT and two SHBG assays methods available (16 assay combinations) in a reference panel of 124 healthy eugonadal young men (Figure 3). Partitioning the sources of explained (model) variation in the analysis of variance, the TT assays contributed 82.2% of overall variance compared with 13.7% for the cFT calculations and 4.1% for the SHBG assays. The impact of systematic variation due to the cFT algorithms remains prominent when the larger effects of TT assays are removed by reducing the analysis to the MS-based reference method (T1; Figure 4). Similar patterns were applied to the other seven TT immunoassays (data not shown).
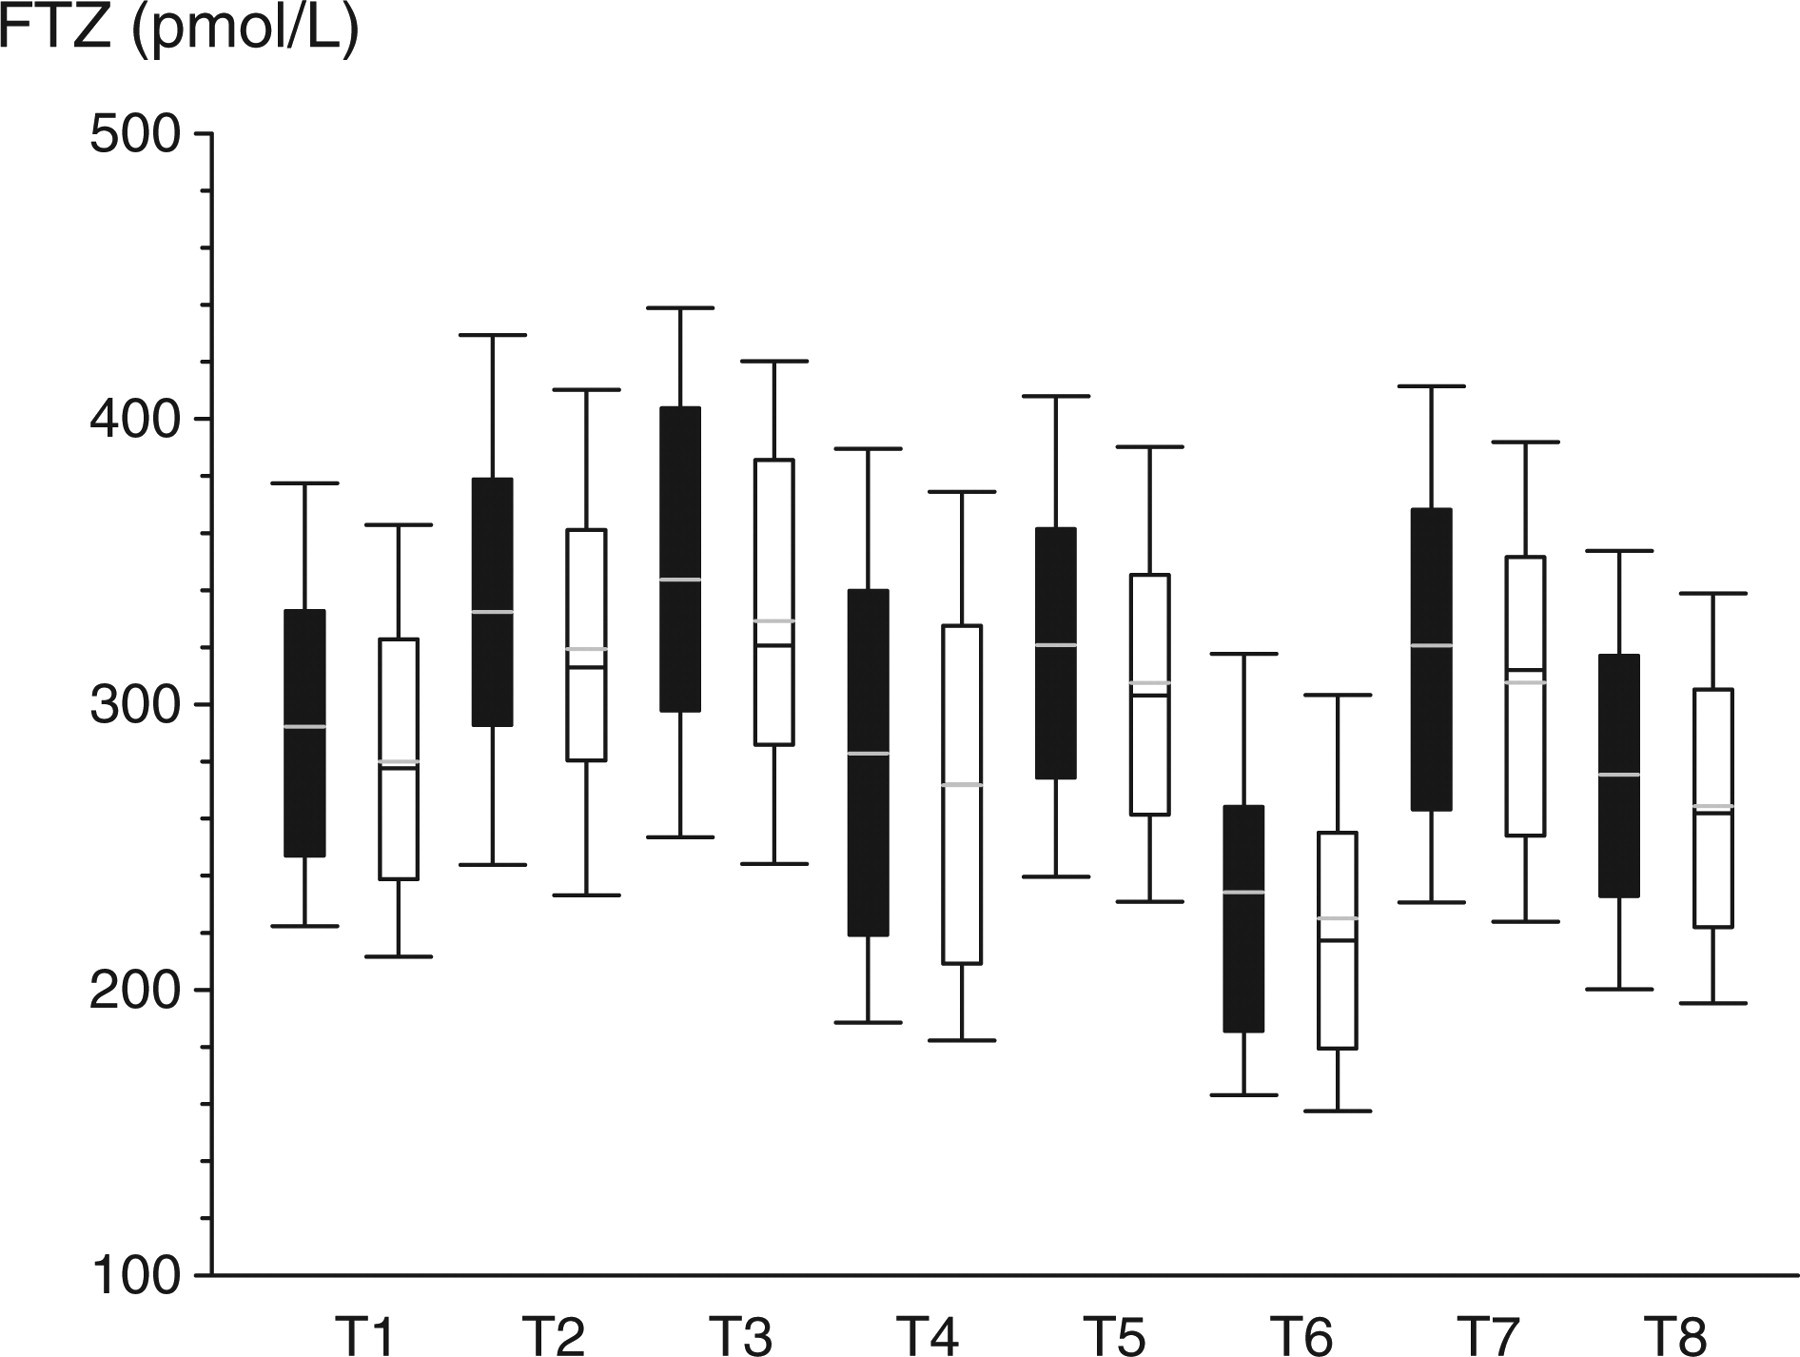
Comparison of different assay methods by calculating free testosterone using FTZ formula to display the variability introduced by total testosterone and sex hormone-binding globulin (SHBG) immunoassays. T1–T8 represent different methods for testosterone measurement (T1: GC/MS, T2–T8: seven different immunoassays). S1 (black filled) and S2 (open unfilled) represent the two different SHBG immunoassays. The boxes cover the interquartile range, with the whiskers representing the fifth and 95th centiles
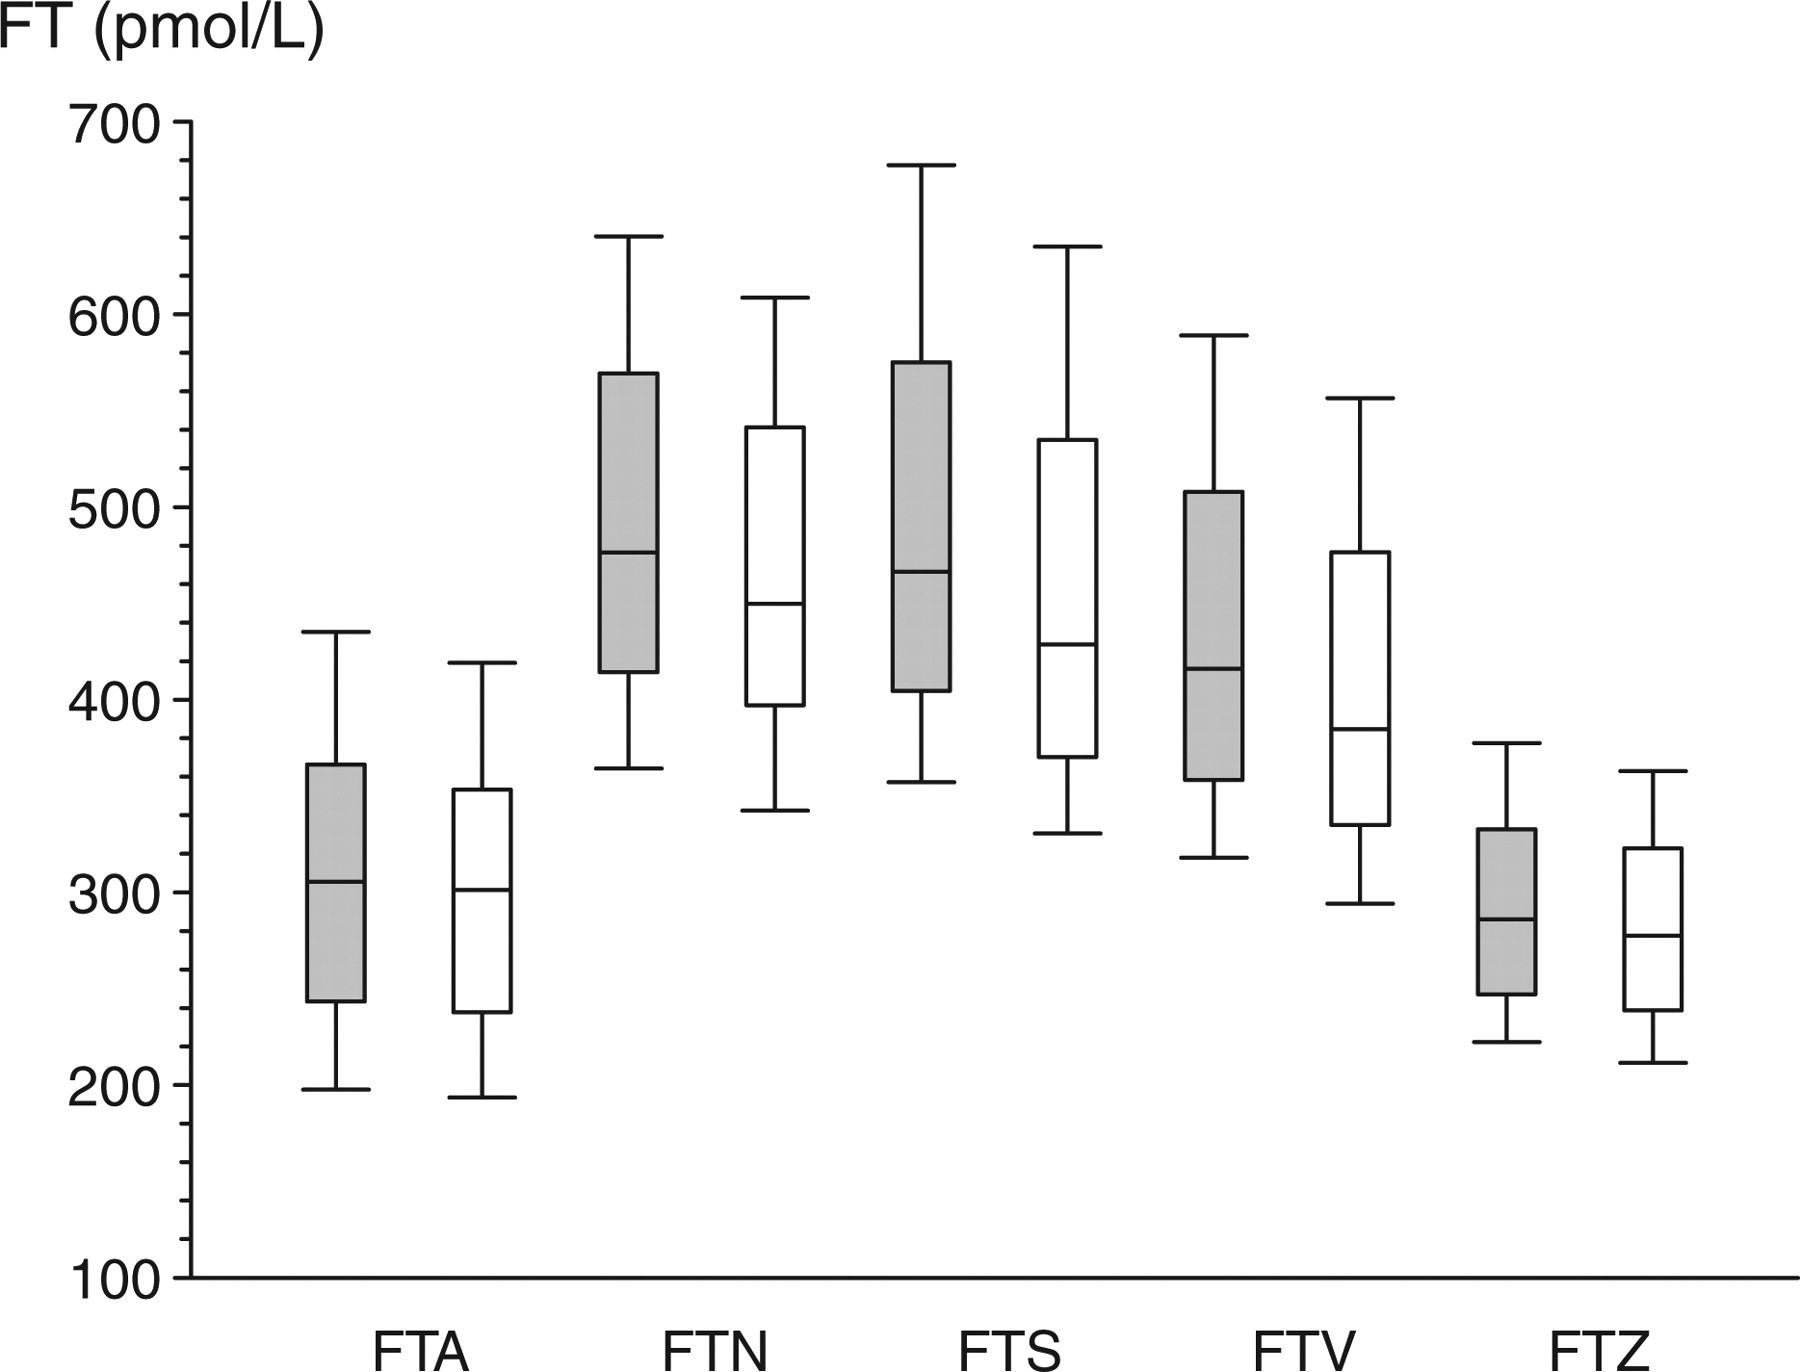
Comparison of five different calculational FT formulae in 124 samples from a reference panel of healthy eugonadal young men based on testosterone measurement by the GC/MS reference method and sex hormone-binding globulin measurements by two different assays as in Figure 3. The boxes cover the interquartile range, with the whiskers representing the fifth and 95th centiles
Discussion
The present findings demonstrate wide variability in predictive accuracy between five cFT formulae, comprising four existing and a novel formula, based on calculations from TT and SHBG immunoassays when compared with direct laboratory measurement by centrifugal ultrafiltration, an accelerated form equilibrium dialysis, the reference FT method. This variability between cFT estimates is most strongly influenced by variations between TT assays, accounting for over 80% of attributable variance, and to a lesser extent by the cFT equations (14%) and least by the SHBG assays (4%). Wide variation between commercial TT immunoassays 4,5,24 is primarily attributable to systematic differences in specificity between immunoassay methods rather than between laboratories 5 and constitutes an increasingly recognized problem for clinical use of these assays that can ultimately be overcome only by highly specific mass spectrometry-based methods. 3 It should be borne in mind that direct measurements of FT are fundamentally different from measurements by mass spectrometry, which measure TT and not FT. The present findings based on empirical evaluation again question the frequent tacit interpretation that cFT formulae are accurate. 3
We evaluated predictive accuracy of candidate cFT formulae using a database of nearly 4000 consecutive blood samples from a routine diagnostic laboratory, where FT was measured by centrifugal ultrafiltration 14 together with TT and SHBG immunoassays on every sample. Among the five cFT calculations two, FTA and FTZ, had the highest predictive accuracy, performing better than the FTS, FTV and FTN formulae in both model fit and predictive error estimation. In addition, 3D graphical representations that display the patterns and complexity of the data surfaces showed that these two empirical equations conformed more closely to the contours of the laboratory measured FT values than did the other equations, consistent with their quantitatively superior predictive properties. While the new FTZ formula was marginally inferior in predictive accuracy compared with FTA, it had the advantage of comprising a single formula that cannot produce negative cFT estimates even with extreme TT and SHBG values as confirmed in this large data-set. A feature of this study is the analysis of predictive accuracy using bootstrap resampling in a large data-set. When used with a suitably large data-set, this technique allows the independent development and evaluation of various cFT formulae by its computer-intensive extension of split-sample methodology. 25 Traditionally, a large data-set could be split into two distinct subsets (training and test) on which the formulae would be developed and then tested, respectively, on distinct samples. The advent of bootstrap resampling made feasible by the availability of powerful computing resources allows for an iterative automation and extension of the split-sample methodology, 25 thereby making more efficient use of large data-sets.
The present finding differs from previous studies that compared some of the same cFT equations in much smaller data-sets. 26,27 However, as neither of those studies measured FT directly as the independent reference method, they could not evaluate predictive accuracy at all, so as to arrive at objective conclusions on validity of the formulae. Hence, they overlooked the suboptimal performance of the widely used binding equation-based formulae they endorsed. 26,27 Furthermore, by restricting analysis to only a single TT and SHBG immunoassay for each variable, previous studies were unable to appraise the major sources of variability in cFT equations identified in the present study, whereby the TT assay produced the majority of the systematic variation. The present study did not measure directly ‘bioavailable’ T, an alternatively derived testosterone measure. 28 Hence, lacking an independent empirical measurement as a reference, we did not attempt evaluation of the predictive accuracy of the various formulae proposed for this alternative to cFT as another derived testosterone measure although such independent objective evaluation would be of interest.
The two methods based on equilibrium-binding equations (FTS, FTV) systematically overestimate the measured FT values. This systematic overestimation presumably arises from violation of one or more of the many assumptions implicit in this approach. For example, these adaptations of the binding equation calculations assume that: (i) T binding to SHBG is adequately represented by immunoassay measurements of SHBG mass rather than binding estimates; (ii) that the incorrect stoichiometry assuming one binding site rather than two 29 does not matter and (iii) fixed, approximated affinity constants can substitute for empirically measured affinity constants. Even modest deviations from any one of these assumptions could account for the systematic errors identified in the outputs from these nonlinear binding equation formulae. Validation of these assumptions has been very limited. Neglecting binding to proteins other than SHBG albumin within the range of 40–50 g/L appears to have negligible influence on cFT estimates. 21 Other circulating T-binding proteins such as CBG contribute minimal T binding. 30 However, the T-binding affinity constants for SHBG used in equilibrium binding formulae (5.97 × 10⁸, 20 10 × 108, 21 19 × 108, 31 11.3 × 10⁸ 32 ) have varied sufficiently widely to account for the observed systematic overestimation.
An alternative approach has been the development of empirical calculational methods free from assumptions required by formulae that hinge on theoretical-binding equilibria. The original empirical model was the FTI (or androgen index), defined as the ratio of TT to SHBG expressed as a percentage. 33 However, this index corresponds theoretically to ‘free’ testosterone if and only if the molar ratio of TT to SHBG is very low, circumstances that apply in women and children but not adult men as confirmed empirically. 9,34 Hence, while FTI is potentially useful in women undergoing evaluation of androgen status, it is not applicable to evaluating men for possible androgen deficiency, where it merely reflects (inversely) the SHBG concentration. Even in women at extremes of low SHBG, the FTI assumption may be violated. More suitable empirical methods have been based on modelling the relationship between measured FT with TT and SHBG immunoassay measurements. 8 Our earlier algorithm FTA, while having the best predictive accuracy and model fit among published formulae, suffered the disadvantages of: (i) needing two formulas, one for low (TT < 5 nmol) and high (TT > 5 nmol/L) TT values and (ii) rarely computing impossible negative values with extreme TT and SHBG concentrations. Hence we developed a new, single empirical formula FTZ with almost equally good predictive accuracy, but which avoids the need for two formulae while avoiding negative predictive estimates even with extreme TT and SHBG values. We propose that the FTZ formula is preferable overall for its advantages with only minimal deterioration in predictive accuracy. The limitation of empirical methods is that they may be method-specific introducing difficulties in extrapolating them to different laboratories and methods. Development of lab-specific reference ranges introduces additional complexities due to the need to develop a valid reference population for calibration, which requires rigorous screening to exclude reproductive disorders. 5
At a theoretical concentration, the concept of FT arises from a physiological consideration that a non-polar steroid-like testosterone circulates at concentrations exceeding its low aqueous solubility only as a consequence of binding to serum proteins. Yet, to exert its biological action this hydrophobic steroid must transfer from its predominantly protein-bound circulating form to tissues and cells crossing the aqueous extracellular fluid compartment. Non- or loosely protein-bound steroid transiting this compartment of the extracellular fluid is referred to as FT. Although arising as an abstraction, it is assumed that such FT can be measured reproducibly in the laboratory and, according to the ‘free hormone’ hypothesis, it is further asserted that it represents the most biologically active fraction of T. This reasoning may be flawed in that such a free fraction of T, if more readily accessible to sites of androgen bioactivity would be equally accessible to sites of metabolic inactivation that terminate androgen action. Hence, the free hormone hypothesis is equally compatible with such a free fraction being considered having greater or lesser bioactivity than protein-bound testosterone. While the definitive biological functions of steroid transport proteins like SHBG remains unclear, recent studies cast doubt upon the assumption inherent in the free hormone hypothesis that tightly SHBG-bound testosterone represents a biologically inert reservoir. On the contrary, there is evidence for active cellular uptake of SHBG-bound testosterone 35 and of testosterone itself 36,37 as well as characteristic membrane-type signalling via G protein and cyclic adenosine monophosphate. 38,39
In conclusion, if FT measurements are sought and the direct measurement by the reference FT method is impractical, the major alternative is cFT formulae using TT and SHBG immunoassays results. The present study shows that such cFT estimates are not only strongly dependent on the immunoassays used to measure TT (especially) and to a lesser extent SHBG, but also vary systematically according to the calculational formula used. This study also demonstrates the utility of bootstrap resampling as a computer-intensive extension of split-sample methodology for development and evaluation of empirical formulae from large data-sets in clinical chemistry. Empirical formulae developed by reference to direct laboratory FT measurements have the advantage of higher predictive accuracy but the drawback of being immunoassay method-specific. Although FT calculations lack solid biological basis, empirical applications of cFT estimates may still be evaluated for clinical or research utility as a convenient summary metric incorporating TT and SHBG measurements if suitably accurate formulae are available. The present findings suggest that empirical formulae may be suited to such applications.
Footnotes
Acknowledgement
Gideon Sartorius is supported by grants of the Swiss National Research Foundation (grant PBBSB-116889) and the Lichtenstein-Stiftung, Basel, Switzerland.