
Abstract
Background
Estimation of glomerular filtration rate (GFR) using plasma creatinine remains controversial, especially when GFR approaches normal values. The aim was to re-examine estimated GFR (eGFR) using dual-reference GFR measurements.
Methods
eGFR (simplified modified Modification of Diet in Renal Disease equation) was compared with GFR measured with iohexol for predicting GFR measured with 51Cr-ethylenediaminetetraacetic acid (EDTA). Dual six-sample GFR (20–240 min postinjection) was measured in 60 patients and 20 normal volunteers with 51Cr-EDTA (GFREDTA) and iohexol (GFRiohexol) injected into separate arms and sampled contralaterally. This was repeated in the normal volunteers under fasting conditions (twice in nine). Percentage bias, imprecision (SD of bias) and disagreement (sign-less difference) between eGFR and GFREDTA were compared with those between GFRiohexol and GFREDTA.
Results
Changes between fasting and postprandial eGFR correlated significantly with corresponding changes in GFRiohexol and GFREDTA. eGFR predicted GFREDTA less precisely (SD 19.9%) than GFRiohexol (10.5%; P < 0.01). Although eGFR showed a poorer correlation with GFREDTA when GFREDTA > 80 mL/min/1.73 m2 compared with <80 mL/min/1.73 m2, there was no significant difference with respect to imprecision or disagreement of >20 or 30%. However, eGFR was closer than GFRiohexol to GFREDTA in a higher fraction of studies when GFREDTA > 80 mL/min/1.73 m2 (28/60) than when it was <80 mL/min/1.73 m2 (9/37; P < 0.05).
Conclusion
eGFR is inferior to GFRiohexol for predicting GFREDTA. The disagreement between GFRiohexol and GFREDTA illustrates the extent to which uncertainty in GFREDTA contributes to the performance of eGFR. eGFR performs no better at lower, compared with higher levels of GFR.
Introduction
There have been numerous evaluations of the Modification of Diet in Renal Disease (MDRD) study equations for the estimation of glomerular filtration rate (eGFR) from plasma creatinine concentration. 1 Most find eGFR of value, both in general populations 2 and in special groups such as the elderly, 3,4 diabetics 5,6 and patients with chronic kidney disease (CKD) 7–11 but there are several reporting no improvement over other creatinine-based methods or poor performance in transplant recipients, 12 patients with CKD, 13,14 including those with normal creatinine, 15 diabetics 16–19 and the obese, 3 or misclassification of patients with renal disease into the wrong CKD stage. 20 Moreover, variations in creatinine assay, 21,22 standardization of the assay 23,24 and a preceding meal 25,26 also affect the predictive power of eGFR. The only well-studied ethnic groups are Caucasians and Afro-Caribbeans, although there have been recent studies in Indians, 27 Japanese 28 and Chinese. 11,13 The MDRD equations are neither considered appropriate in children 29 nor when GFR exceeds 60 mL/min/1.73 m2. 10,16,18,27,30–33 or 90 mlLmin/1.73 m2. 2,4
Evaluations of eGFR have been based on numerous reference indicators, including radiopharmaceuticals (51Cr-ethylenediaminetetraacetic acid [EDTA], 5,14,17,18,21,22 99 mTc-diethylenetriaminepentaacetic [DTPA] 3,11,13,27,30,34 and 125I-iothalamate 2,34 ) and stable compounds (iohexol 15 , inulin 4,8,9,16,29 and iothalamate 7,31 ) and on numerous measurements, including non-steady-state two-compartment or one-compartment plasma and urinary clearances and steady-state urinary clearance. Any particular reference technique, however, has its own experimental error and what is missing from the literature is a comparison between eGFR and a reference method that at the same time is also compared with a second, independent reference method. Such an inclusion would highlight the imprecision and inaccuracy of the gold standard methods and show to what extent differences between eGFR and either reference method are exclusively the result of issues with eGFR rather than the reference methods themselves.
The first aim of our study, therefore, was to evaluate eGFR initially by comparing its ability to predict multisample (two-compartment) GFR measured with 51Cr-EDTA (GFREDTA; the primary gold standard) with that of multisample GFR simultaneously and independently measured with iohexol (GFRiohexol; the secondary gold standard), a filtration marker that has been validated against both 51Cr-EDTA 35–39 and inulin 40–43 ). The second aim was to compare the reproducibility of eGFR and its response to food intake with those of 51Cr-EDTA and iohexol. Finally, we exploited the availability of two gold standards to re-examine the prevailing view that eGFR is more reliable at GFR concentrations below the reference range compared with its reliability at higher concentrations of GFR.
Methods
Subjects
Subjects comprised 60 patients referred for clinical measurement of GFR (40 males, 20 females, median age 56, range 28–79 y; median body mass index [BMI] of 28, range 20–41 kg/m2) and 20 healthy volunteers (seven males, 13 females, median age 44, range 30–59 y; median BMI of 21.5, range 18–34 kg/m2). The overwhelming majority of subjects were Caucasian and none were black. Patients were asked to consider volunteering for an additional, simultaneous GFR measurement with iohexol: 36 were diabetics (21 of whom were receiving insulin), 10 had cancer, 13 had skin disease and were receiving or being considered for cyclosporine treatment and one was referred from the nephrology service. GFR was measured in the morning after the patient had consumed a routine breakfast, i.e. were non-fasting. The 20 healthy volunteers were studied twice, at the same time in the morning, once fasting and once, like the patients, after a non-standardized breakfast. Ten of the healthy volunteers had a further fasting study. Each healthy volunteer's two or three studies were completed within four weeks.
This was a prospective study completed within 18 months, during which there were no changes in laboratory creatinine practice. All subjects gave written, informed consent and the study was approved by the local research ethics committee and UK Administration of Radioactive Substances Advisory Committee.
Estimation of GFR
Plasma creatinine was measured from the baseline blood sample (see below) in all but nine subject studies (including one normal volunteer study) using the Jaffe method (Dimension® RxL Max Clinical Chemistry analyser [Dade Behring, Milton Keynes, UK]) and eGFR calculated from a modified version of the four-variable MDRD equation. 1 The values assigned to the assay calibrators were traceable to the National Institute of Standards and Technology (NIST) Standard Reference Material (SRM) 914.
When compared with the reference method of gas chromatography/isotope dilution mass spectrometry (GC/IDMS), the bias for serum and plasma samples exceeds that stipulated by NKDEP (National Kidney Disease Education Programme). 44 In order to harmonize reported eGFR, taking into account the specificities of the assays used, it has been suggested that method-specific slope and intercept adjusters be applied to measured creatinine results. 45 As such, the calculated eGFR will be in agreement with those derived from an ‘IDMS traceable’ method using the 175 version of the equation. These adjusters have been determined from the United Kingdom National External Quality Assessment Scheme (UK NEQAS) pilot scheme for eGFR.
For dimension, intercept = 6.78 and slope = 1.030.
Hence, the calculation of eGFR using the MDRD equation appropriately modified becomes:
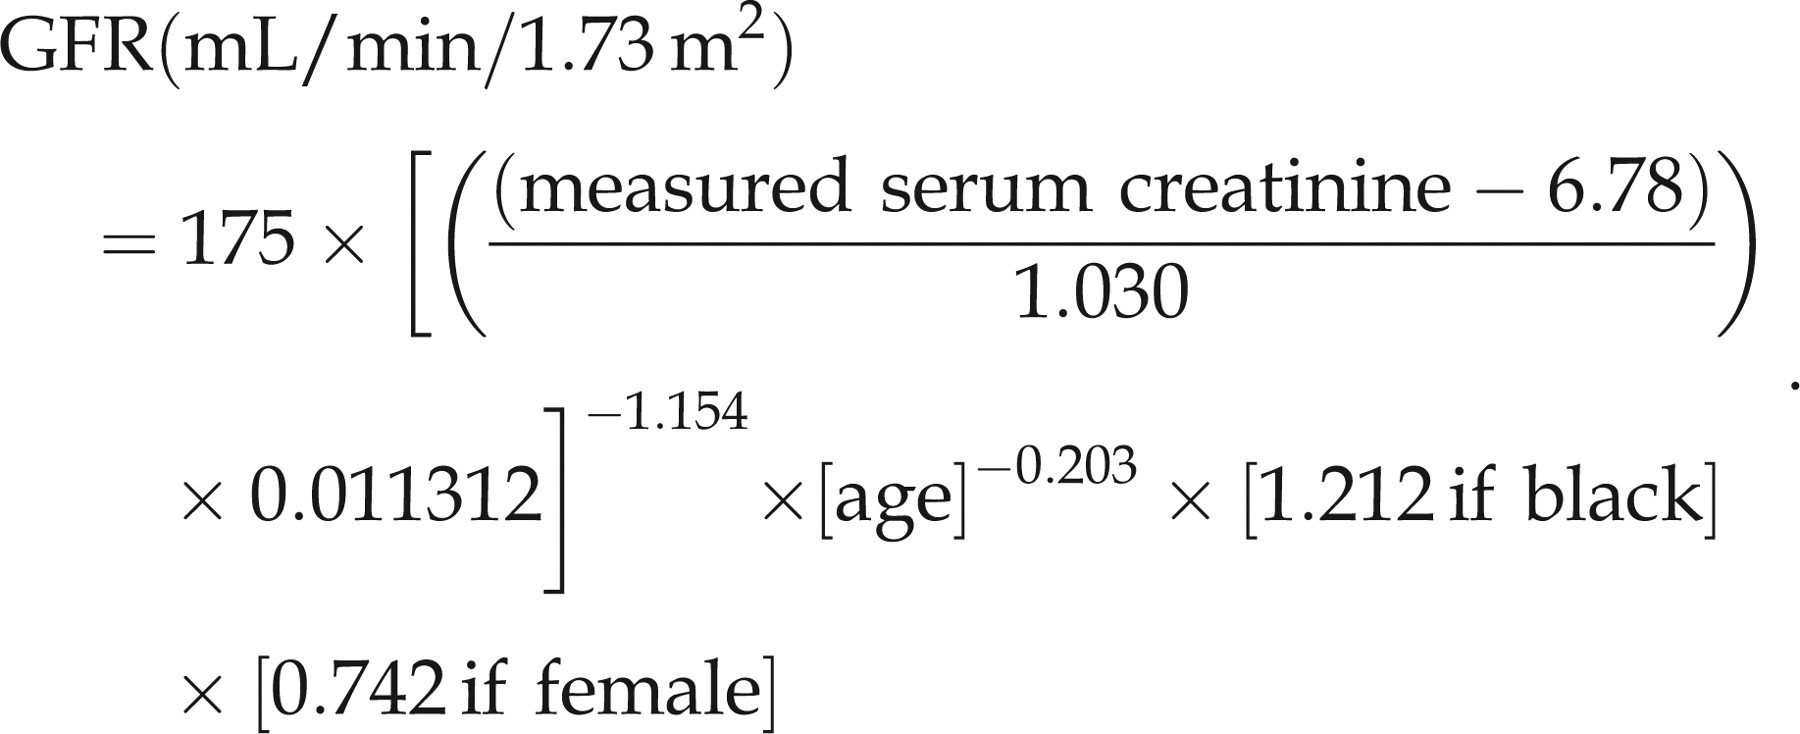
Correlation data, generated as part of our participation in the UKNEQAS GFR estimation scheme, between the equation above and the IDMS creatinine ‘175’ version supports this approach. Thus, ordinary least square linear regression analysis yielded the following equation (samples had creatinine concentrations in the range of 50–130 μmol/L):

The slope is not significantly different to unity (P = 0.15) and the intercept not significantly different to zero (P = 0.32).
Measurement of GFR
Two reference values of GFR were measured, one with 51Cr-EDTA and the other with iohexol (GE Healthcare, UK). The two indicators were separately injected into each antecubital fossa and assayed in contralateral samples drawn before (baseline) and 20, 40, 60, 120, 180 and 240 min after injection, 51Cr-EDTA by well-counting (Wallac 1480 Wizard 3”, Turku, Finland) and iohexol by X-ray fluorescence (Oxford Instruments, Oxford, UK), as previously described. 46 GFR was measured using a two-compartment model and scaled to a body surface area of 1.73 m2. 47 In five patient studies (in one of whom a plasma creatinine measurement was also missing), the iohexol clearance curve could not be resolved into two exponentials and so they were not included in the analysis, leaving a final total of 97 subject studies for analysis.
Statistics
Taking GFREDTA as the primary gold standard, bias (average difference between paired measurements), imprecision (one standard deviation of bias) and disagreement (signless difference) were expressed in absolute terms and as percentages of the average. Student's unpaired t-test was used to compare biases and to measure the significance of the difference of bias from zero. Imprecisions were compared using the F-test. 48 The boundary for low and high GFR was set at 80 mL/min/1.73 m2 (based on 51Cr-EDTA) as this, in European guidelines, is the minimum for live kidney donation. 49
Results
Reproducibility of eGFR
As we have previously shown by comparing the reproducibilities of GFREDTA and GFRiohexol, fasting GFR changes in normal subjects between repeat studies by several percent, even under identical conditions. 46 Changes in GFREDTA correlated with the corresponding changes in GFRiohexol, indicating that they were not artefactual. 46 In these same normal subjects who underwent two fasting studies, eGFR was significantly less reproducible than GFREDTA and GFRiohexol (Table 1). Nevertheless, the individual changes in eGFR between the two studies correlated positively and significantly with the corresponding changes in both GFREDTA (r = 0.73, n = 9, P < 0.05) and GFRiohexol (r = 0.87, n = 9, P < 0.01; Figure 1), confirming a non-random element in variation of true GFR detectable by eGFR.
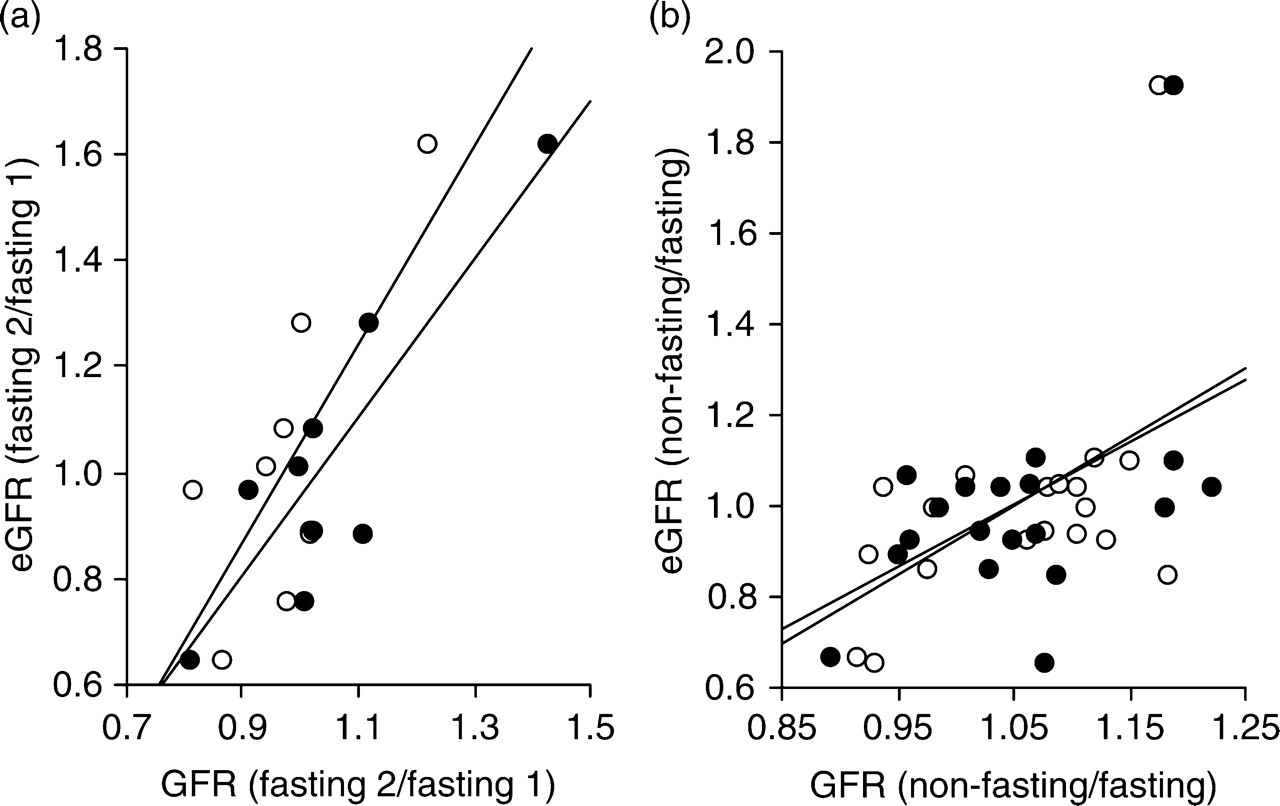
Correlation between corresponding individual fractional simultaneous changes in estimated glomerular filtration rate (eGFR) and (a) GFREDTA (open circles) and (b) GFRiohexol (closed circles) between fasting studies (left panel; n = 9) and in response to a non-standardized light meal (right panel; n = 19). With respect to the meal, the relation based on GFREDTA, but not on GFRiohexol, was still statistically significant after exclusion of the individual who displayed a y-axis value of >1.8. Lines are least squares fitted regression lines
Reproducibility, bias and imprecision (1 SD of bias) with which the first fasting study predicted the second fasting study for all three measures of glomerular filtration rate (GFR)
*P < 0.01 vs. GFREDTA
† P < 0.05 vs. GFRiohexol
Response to food
As previously reported, 46 the non-standardized meal in the current study produces a small increase in GFR of about 5 mL/min/1.73 m2. Unlike GFREDTA and GFRiohexol, there was no significant change in eGFR in response to this meal in normal subjects who underwent both fasting and non-fasting studies (−3.7 SD [21.8] mL/min/1.73 m2). As in the reproducibility study, however, individual changes correlated positively with the corresponding changes in both GFREDTA (r = 0.52, n = 19, P < 0.05) and GFRiohexol (r = 0.48, n = 19, P < 0.05; Figure 1).
Prediction of GFREDTA
Bland-Altman plots showed that the absolute differences between GFREDTA and eGFR and between GFREDTA and GFRophexol increased as functions of the respective averages (Figure 2), supporting the expression of the results as relative (percentage) values, as in Cirillo's study. 8
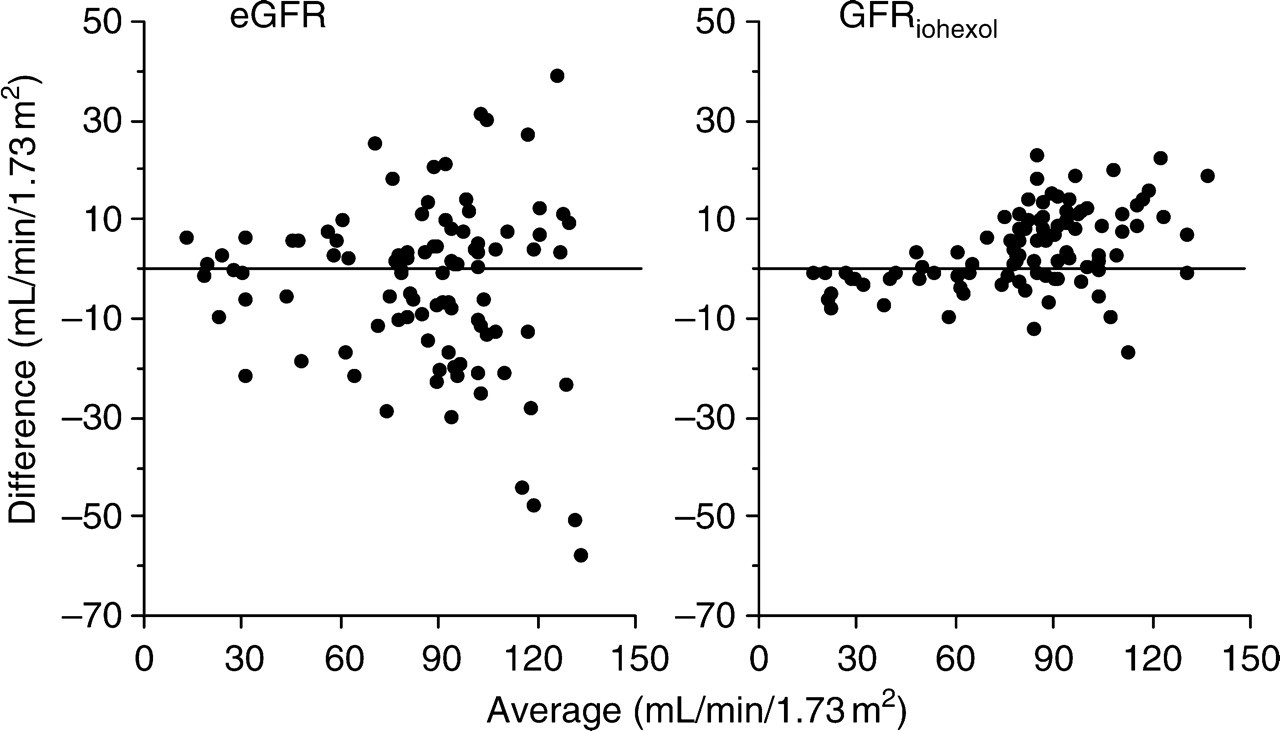
Bland-Altman plots with respect to estimated glomerular filtration rate (eGFR) and GFREDTA (left panel) and GFRiohexol and GFREDTA (right panel)
GFRiohexol correlated closely with GFREDTA, closer than the correlation between eGFR and GFREDTA (Figure 3, Table 2). Both correlation coefficients were higher when GFREDTA was <80 mL/min/1.73 m2.
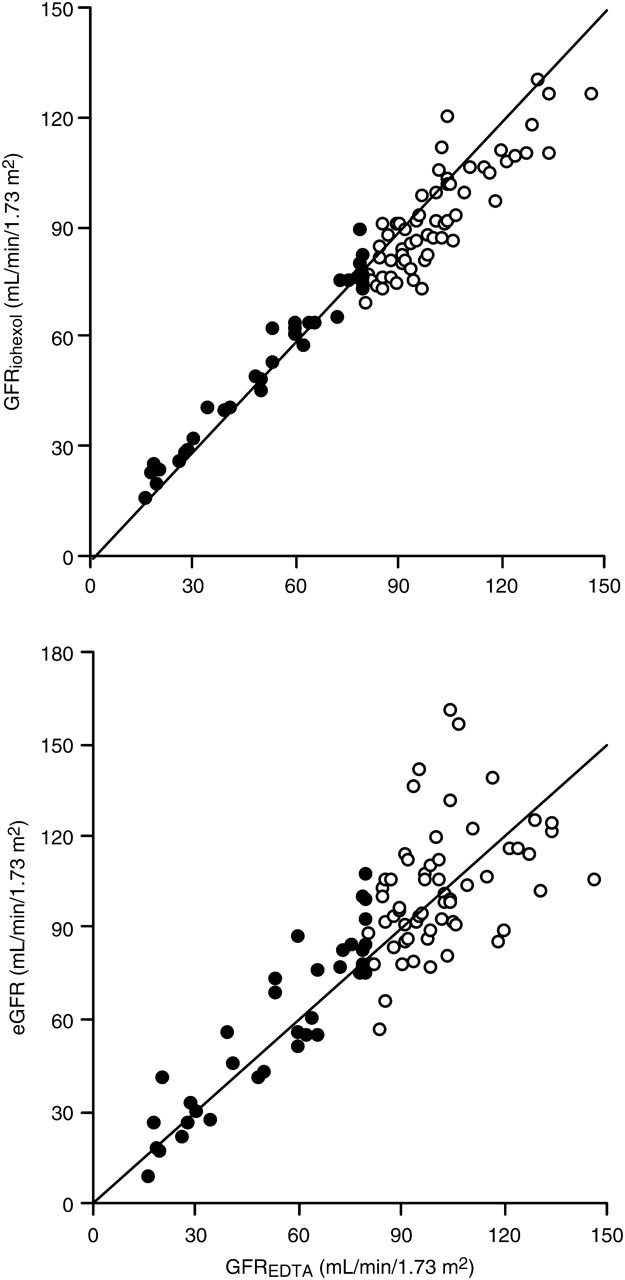
Correlations between (glomerular filtration rate) GFREDTA and GFRiohexol (upper panel) and between estimated GFR (eGFR) and GFREDTA (lower panel). Closed circles denote GFREDTA < 80 mL/min/1.73 m2; open circles denote GFREDTA > 80 mL/min/1.73 m2. Lines are identity (see Table 2)
Correlation coefficients between GFREDTA and estimated GFR (eGFR) and between GFREDTA and GFRiohexol irrespective of renal function and in studies, respectively, with GFREDTA < 80 mL/min/1.73 m2 (n = 37) and >80 mL/min/1.73 m2 (n = 60)
The relative bias of GFRiohexol, but not of eGFR, for predicting GFREDTA, was significantly different from zero (Table 3). eGFR predicted GFREDTA with significantly less precision than GFRiohexol. The mean disagreements between GFREDTA and (i) eGFR and (ii) GFRiohexol were 15.3% and 8.6%, respectively (Table 3). Imprecisions of eGFR and GFRiohexol were inferior at GFR values <80 mL/min/1.73 m2 compared with >80 mL/min/1.73 m2 but not significantly (Table 4).
Mean difference (bias), 1 SD (imprecision) and mean disagreement (signless difference) with respect to prediction of (glomerular filtration rate) GFREDTA by estimated GFR and by GFRiohexol (n = 97)
*Precisions significantly different using F-test (P < 0.01)
†Significantly different from zero (P < 0.01)
Dependence of estimated glomerular filtration rate (eGFR) on filtration function. Mean % difference (±1 SD: imprecision) and % disagreement (in italics) between eGFR and GFREDTA and between GFRiohexol and GFREDTA
There was no significant difference between <80 and >80 mL/min/1.73 m2 with respect to the percentages of paired values (eGFR vs. GFREDTA or GFRiohexol vs. GFREDTA) disagreeing by more than 20% and
*Significantly different from zero. There were no significant differences in imprecision across filtration function boundary, but bias of GFRiohexol was significantly higher for GFREDTA >80 mL/min/1.73 m2
A plot of the absolute (signless) disagreement between eGFR and GFREDTA against the absolute (signless) disagreement between corresponding GFREDTA and GFRiohexol values would consistently yield points only on one side of the line of identity if GFREDTA and GFRiohexol always agreed with each other. Points were however distributed on both sides of the line of identity (Figure 4), indicating that GFREDTA was not always closer to GFRiohexol but instead occasionally closer to eGFR (in 38 of 97 studies [39%]). When this plot was restricted to studies in which GFREDTA exceeded 80 mL/min/1.73 m2, this proportion increased to 47%, but was only 24% when GFREDTA was <80 mL/min/1.73 m2 (P < 0.05).
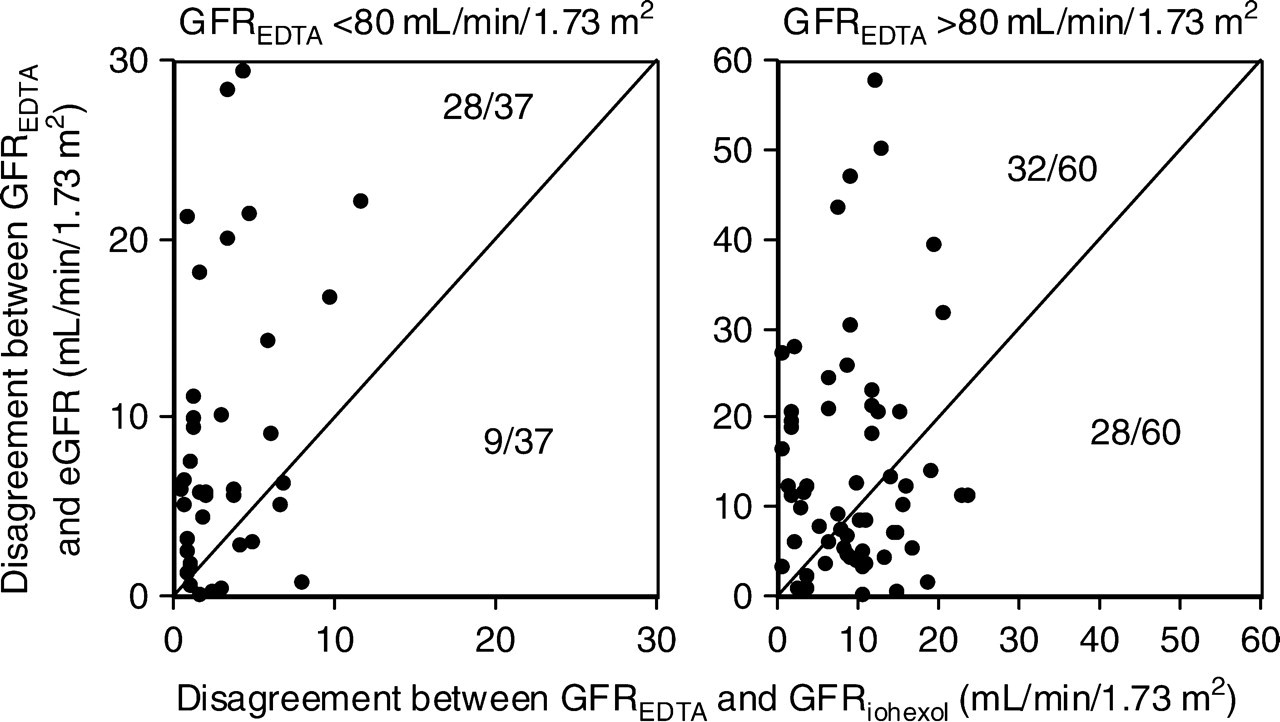
Relations between the respective corresponding absolute (signless) differences (absolute disagreement) between estimated glomerular filtration rate (eGFR) and GFREDTA (y-axis) and GFRiohexol and GFREDTA (x-axis) shown for subjects with GFREDTA of <80 mL/min/1.73 m2 (left panel) and >80 mL/min/1.73 m2 (right panel). In the left panel, GFREDTA and GFRiohexol agreed with each other less closely than GFREDTA with eGFR in nine of 37 subject studies (points to the right of the line of identity), whereas the corresponding proportion in the right panel was 28 of 60 (P < 0.05)
Discussion
Statistical approaches to the evaluation of eGFR have varied widely with overlapping and sometimes confusing terminology. For example, Froissart et al. 20 defined precision as one SD of mean difference between estimated and reference values while Cirillo et al. 8 defined imprecision as the ‘percentage absolute’ signless difference. The terminology and statistical approach used in the current paper is therefore similar to Froissart et al. 20 with respect to bias and precision and similar to Cirillo et al. 8 with respect to disagreement.
The principal findings in this study are: first, eGFR is able to detect the true, small variations in GFR that takes place between fasting measurements, which is important as it underlines its potential value in longitudinal studies in the same patient; and secondly, eGFR performs no worse, if not better, at higher levels of filtration function. As illustrated in Figure 4, this conclusion is based on absolute disagreement as well as relative disagreement.
In view of the effect of a meal on plasma creatinine concentrations, independent of changes in GFR, an inverse relation between corresponding changes in eGFR and GFREDTA might have been expected instead of a positive one. The meal, however, was light and, as previously shown by a positive rather than a negative relation between corresponding changes in GFR and extracellular fluid volume in response to this meal, 50 produced a primary change in GFR rather than one in creatinine.
Most previous studies concerning eGFR have focussed on absolute (i.e. mL/min/1.73 m2), rather than relative, differences. As is evident from the Bland-Altman plots (Figure 2) and from the functional categories given by Froissart et al. 20 this inevitably leads to increasing bias and imprecision at higher concentrations of GFR. Nevertheless, for tailoring drug therapy in cancer, for instance, relative errors in GFR measurement are more important than absolute errors, underscoring emphasis on relative differences in GFR measurements. This is because the area under the blood cancer drug concentration-time curve determines toxicity to bone marrow. This area for a drug eliminated by glomerular filtration is equal to the dose divided by renal clearance, so if GFR is measured as 25 mL/min in a patient with a true value of 5 mL/min, an absolute difference of 20 mL/min, the drug will be over-prescribed four-fold. In contrast, the same absolute difference in a patient with a true GFR of 100 mL/min, overestimated as 120 mL/min, will lead to over-prescription by a factor of only 1.2.
Focussing on absolute rather than relative difference has contributed to the view that eGFR is unreliable when GFR approaches the reference range. Percentage precision of both eGFR and GFRiohexol at values >80 mL/min/1.73 m2 was no worse than <80 mL/min/1.73 m2, but biases were significantly greater for both. The underestimation of true GFR by eGFR at higher levels of function has been shown in several previous studies 3,7,8,10,20,30,34 and the reverse at low levels of function. 7,8,12,13,20 Nevertheless, we agree with Froissart et al. 20 that precision is more important than bias; so, the current study suggests that eGFR performs no better at lower values of GFR. Pearson's correlation coefficient tends to obscure this, as shown in the current study, in which we found that inspite of slightly inferior precisions, eGFR and GFRiohexol both showed better linear correlations with GFREDTA at low levels of GFR than at high levels. Thus, with respect to eGFR, correlation coefficients were 0.92 and 0.41 in patients with GFREDTA below and above 80 mL/min/1.73 m2, very similar to those of Poggio et al. 10 for whom they were 0.90 and 0.36 for CKD patients and renal donors, respectively, with a cut-off of 60 mL/min/1.73 m2. (Correlation analysis is probably erroneous in the current context and only included in this manuscript for the purpose of comparison with previous studies.) A performance of eGFR that is not inferior at high levels of renal function is also supported by the finding that GFRiohexol is closer to eGFR than it is to GFREDTA more often at higher levels of GFR than at lower levels (Figure 4).
Although iohexol is now regarded as a valid gold standard for measuring GFR, we found, as previously reported, that GFRiohexol tended to underestimate GFREDTA at high values of GFR and vice versa at low values of GFR. Iohexol protein-binding may have been the cause at high GFR and extra-renal iohexol clearance the cause at low GFR, but we have no data to confirm this.
In conclusion, eGFR was significantly less accurate than GFRiohexol for the prediction of GFREDTA, less reproducible than both GFRiohexol and GFREDTA and failed to detect a change in GFR resulting from a small meal. Nevertheless, the use of a second gold standard exposes the contribution of errors in the primary gold standard to the perceived inaccuracy of eGFR as a predictor of true GFR. Our data also question the view that eGFR is less reliable at higher values of filtration function than at lower values.
Footnotes
Acknowledgements
This work was supported by the Kidney Research UK. We are grateful to the participating volunteers and to Dr L Tomlinson for helpful comments.