
Abstract
Background
The principle of the erythrocyte sedimentation rate (ESR) as assessed by TEST 1 is different from that of Westergren-based methods. This could result in different influences on the tests by paraproteins.
Methods
We investigated the effect of paraproteins on ESR readings by TEST 1 (y) and the StarrSed (x), a Westergren-based method, in 142 patients with paraproteinaemia. Agreement (Passing-Bablok) and bias (Bland–Altman) between methods was investigated and compared with that of a control population.
Results
A poor agreement between the two methods was found in patients with a paraprotein (y = 0.67x + 3.3) in comparison with that of the control population (y = 0.96x + 0.2). Large differences between methods were present when ESR readings were >40 mm/hour, but clinical interpretation was similar in 90% of cases. Linear regression showed a concentration dependent influence of paraproteins on ESR readings by the StarrSed, especially for immunoglobulin class IgM.
Conclusion
ESR readings by TEST 1 result in similar clinical interpretation for most subjects, but readings are less influenced by the presence of a paraprotein than those of a Westergren-based method.
Introduction
Measurement of the erythrocyte sedimentation rate (ESR), also known as the length of sedimentation reaction in blood, is an easy and inexpensive laboratory technique that has been used as a non-specific screening procedure to assess the acute-phase response for many years. 1 Determination of the ESR is also commonly used for monitoring of disease activity in rheumatoid arthritis as it is part of the Disease Activity Score in 28 joints. 2 The International Council for Standardization in Haematology has recommended the original method described by Westergren as the gold standard. 1 The Westergren method measures the plasma column after one hour of spontaneous sedimentation. The ESR reading is thus a representation of the physical process of erythrocyte sedimentation that can schematically be divided into three phases. After the lag-phase in which an initial reorientation of the individual erythrocytes takes place, an erythrocyte sediment is formed mainly under influence of gravitational forces and formation of erythrocyte aggregates that are formed after shielding the negative zeta-potential. In the last phase, the erythrocyte sediment is more tightly packed, which has a minimal influence on the final ESR result. Any condition that is associated with increased concentrations of positively charged molecules will lead to an elevated ESR reading. Examples of such molecules are the proteins of the acute-phase response (e.g. fibrinogen) and immunoglobulins. In particular, paraproteins (i.e. a monoclonal expression of an immunoglobulin) that can be found in multiple myeloma or Waldenstrom’s macroglobulinaemia will enhance rouleaux formation, resulting in increased ESR readings. 3–5
All techniques that are based on the Westergren principle have the major disadvantages of being time-consuming. In the TEST 1 (Alifax, Padovo, Italy), ESR is assessed using a quantitative capillary photometry-based technology.
6
After three minutes of mixing, the erythrocyte microsedimentation is measured at 37°C by centrifuging each sample at about 20×
Previous studies performed in subjects of the general population have shown a good correlation between ESR results by TEST 1 and Westergren-based methods. 7–9 These studies have not taken into account the influence of the presence of paraproteins on ESR readings. As the TEST 1 measures the ESR in the initial lag-phase, we hypothesized that this method may be less influenced by the presence of a paraprotein compared with other methods based on the Westergren principle. The aim of this study was, therefore, to investigate the effect of paraproteins on the ESR measured with the TEST 1 in comparison with the ESR measured with the StarrSed, a Westergren-based method.
Materials and methods
Patient collection and methods
From February until October 2007 142 consecutive patients, known to have a paraprotein, and who were visiting the laboratory for routine paraprotein concentration monitoring, were asked to participate in the study. Informed consent was obtained from each patient before one additional tube containing K3-ethylenediaminetetraacetic acid was collected to be able to simultaneously asses the ESR using the TEST 1 and the StarrSed (Goffin Meyvis, Etten-Leur, The Netherlands), which is a Westergren-based method. In each patient, the type and the concentration of the paraprotein was determined by electrophoresis followed by immunofixation on the Sebia Hydrasys electrophoresis system using agarose gels and the Hydragel 6/12 IF Pentakit (SEBIA Benelux N.V., Issy-les-Moulineaux, France). Data of 102 consecutive hospital patients from a validation protocol that was previously performed by the authors (data not published) served as a control population. In this validation protocol, ESR was similarly measured using the same techniques as in the present study. To rule out infection or other inflammatory processes C-reactive protein (CRP) was measured using an immunoturbidimetric assay on the Roche Modular P-Module (Roche Diagnostics GmbH, Mannheim, Germany) in combination with a leukocyte count that was measured using the LH750 (Beckman-Coulter Nederland BV, Mijdrecht, The Netherlands).
Statistics
Data were analysed using MS Excel 2003 software (Microsoft™, Redmond, WA, USA) and Analyse-It v1.72 (Analyse-It Software Ltd., Leeds, UK). Passing-Bablok analysis was used to compare ESR values, and Bland–Altman analysis was used to evaluate bias and 95% CI limits of agreement. Differences between methods were tested using the Wilcoxon-signed rank tests. Linear regression was used to investigate the effect of paraprotein concentration on measured ESR. For the linear regression analysis samples in which paraprotein concentration could not be determined quantitatively from the electrophoresis pattern were excluded. Values of P < 0.05 were considered to be statistically significant.
Results
In the hospital population, a good agreement between the StarrSed (x) and the TEST 1 (y) was found with a regression equation of the Passing-Bablok method comparison of y = 0.96x + 0.17 (95% confidence interval [CI] slope 0.85–1.05 and intercept −0.84 to 1.52, Figure 1). In contrast, the presence of a paraprotein (concentration up to 55 g/L) resulted in poorer agreement between these methods y = 0.67x + 3.33 (95% CI slope 0.57–0.77 and intercept 0.46–4.29). When ESR values <40 mm/hour only were included, a good agreement with a regression equation of y = 1.00x + 0.00 (95% CI slope 0.82–1.31 and intercept −3.31 to 1.68) was found. From the Bland–Altman plots, it becomes clear that the poor agreement between both methods arises from the large divergence when higher ESR values are measured. ESR readings of >40 mm/hour show not only a larger difference between both methods, but individual ESR readings of the StarrSed are also higher than those of the TEST 1. This results in a larger mean bias in patients with a paraprotein (−12.5 mm/hour, 95% CI −16.9 to −8.0 mm/hour) when compared with that of a random hospital population (−0.9 mm/hour, 95% CI −2.4 to 0.6 mm/hour).
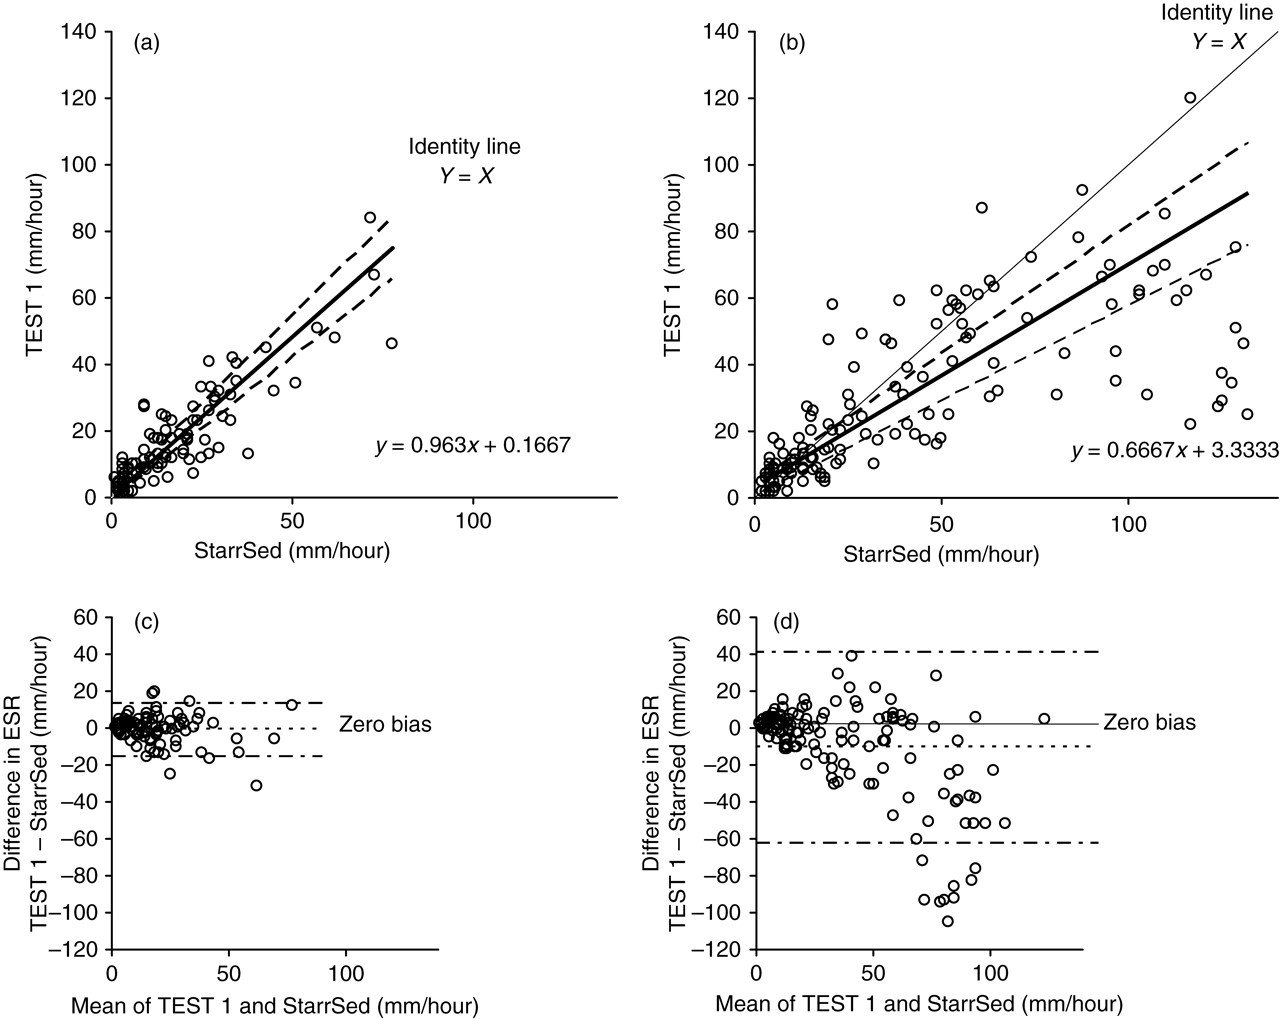
Comparison of erythrocyte sedimentation rate measured with the StarrSedd and TEST 1 in a hospital population (a/c) and in patients with a paraprotein (b/d). (a and b) Passing-Bablok plots. Regression equations are shown in the graph. (c and d) Bias plots. Horizontal lines (– • –) denotes 95% limits of agreement (c: −15.8 to 14.1 mm/hour and d: −65.1 to 40.1 mm/hour)
Owing to the molecular structure of paraprotein subtypes, it may be expected that different classes behave differently in ESR measurement. Therefore, a subgroup analysis, in which three groups were created according to immunoglobulin class (IgG (n = 86; concentration up to 55 g/L), IgA (n = 21; concentration up to 47 g/L) or IgM (n = 35; concentration up to 43 g/L)), was performed. Paraproteins of class IgG and IgA showed a poor agreement between the two methods with a slope of the Passing-Bablok curve similar for both paraprotein classes (Table 1). The agreement between methods seemed to be even worse for paraproteins of class IgM as the slope of the Passing-Bablok curve was lower, but with an overlap of the 95% CIs. The large difference in ESR readings for ESR readings >40 mm/hour contributed to these poor agreements, which was also reflected in the bias plot per paraprotein class. The difference in ESR readings between the StarrSed and the TEST 1 was significantly different for paraprotein subclasses IgG and IgM. However, as a large number of patients with paraprotein class IgG (n = 63; 73%) had an ESR reading <40 mm/hour which influenced mean bias and 95% limits of agreement, the mean bias and 95% limits of agreement for this class were the smallest. The largest difference between methods was found for paraprotein of class IgM.
Relationship of erythrocyte sedimentation rate readings by TEST 1 (y) to StarrSed (x) for paraprotein classes
CI, confidence interval
*P values were determined using the Wilcoxon-signed rank test
The clinical impact of both methods was investigated by evaluating the effect on clinical interpretation (i.e. ESR below or above the reference level for both methods) and by comparing absolute bias. Although TEST 1 ESR readings were on average lower than those of the StarrSed, a good concordance with respect to clinical interpretation was found (Table 2). More importantly, discordant results were only found when ESR reading were low (highest discordant ESR reading for the StarrSed was 30 mm/hour) in combination with low paraprotein concentrations (mean concentration of 4.6 g/L for IgG and 2.1 g/L for IgM). In addition, for paraproteins of class IgG and IgA individual ESR readings by TEST 1 were lower in around 50% of the cases, indicating that some patients will have a lower ESR reading when the TEST 1 is used instead of a Westergren-based method, but that an equal population of patients will have a higher ESR reading in comparison with that of a Westergren-based method. Thus both methods will show elevated ESR readings in an equal proportion, but a different subset, of patients with undiagnosed paraprotein of class IgG or IgA. Unfortunately, this did not seem to be valid for patients with a paraprotein of class IgM. Overall, these findings indicate that clinical decision will be relatively uninfluenced by the method used for ESR measurement. In the majority of cases when using TEST 1 the presence of a paraprotein results in an ESR reading above the reference value, but this increase is less pronounced in comparison with an ESR reading by the StarrSed.
Evaluation of clinical impact TEST 1 versus StarrSed
Kw, weighted Kappa statistic (value of 0.40–0.60 indicate a moderate, 0.60–0.80 a good and 0.80–1.00 a very good agreement)
We hypothesized that the observed differences were dependent on the amount of paraprotein present. Therefore, the relationship between paraprotein concentration and height of ESR reading was investigated using linear regression. For the overall population under study, it was found that both methods were influenced by the presence of a paraprotein (Table 3). However, ESR readings by the StarrSed were more influenced than those measured by the TEST 1, with the slope of the linear regression equation being 2.6 times higher (2.4 versus 0.9). As the 95% CIs do not overlap this difference can be considered statistically different. This implies that for each gram per litre paraprotein, the StarrSed reading is increased by 2.4 mm/hour compared with 0.9 mm/hour for the TEST 1. For the StarrSed, a significant linear relationship was found for the presence of a paraprotein of either immunoglobulin class. The largest effect was found for paraproteins of class IgM followed by IgA. Surprisingly, a significant correlation was only found between the ESR reading by TEST 1 and paraprotein of class IgG, but not for those of class IgA and IgM. Although ESR readings on both methods were dependent on the amount of paraprotein of class IgG, the slopes of the regression line for the StarrSed was approximately two-fold higher. It can be concluded that the presence of a paraprotein has a larger quantitative effect on ESR readings measured by the StarrSed than by TEST 1. Within ESR measurements on the StarrSed, the effect of paraproteins of class IgM and IgA is larger than that of class IgG.
Relationship between paraprotein concentration (x) and erythrocyte sedimentation rate readings (y) by TEST 1 and the StarrSed using linear regression
Note: Subjects in which the paraprotein could not be quantified from the electrophoresis pattern were excluded from the linear regression analysis. The slope indicates the amount of elevation of the erythrocyte sedimentation rate result per g/L paraprotein present
CI, confidence interval
*P < 0.0001; † P = 0.01
Discussion
We have shown that among patients with a paraprotein, there is a negligible difference in clinical interpretation when ESR is measured with either the StarrSed or the TEST 1. However, the presence of a paraprotein has different impact on the ESR reading. In particular, when ESR readings exceeded 40 mm/hour a large difference between the methods was observed. This can be explained by the paraprotein dependency of the ESR reading, which is more pronounced in the StarrSed in comparison with TEST 1 method.
This is the second study known to us that has investigated the influence of paraproteins measured by TEST 1 in comparison with a Westergren-based method. In a previous study, Ajubi et al. 10 have shown a linear relationship between ESR reading by TEST 1 (x) and paraprotein concentration (y) (y = 0.22x + 0.69; r = 0.71). These findings correspond well with those of our study when they are presented with ESR put on the x-axis (y = 0.17x + 5.5; r = 0.39). However, their finding that such a relationship is also present in a subgroup of patients with a paraprotein of class IgM (y = 0.23x − 0.95; r = 0.93) are in contradiction to our finding, because we did not find a correlation between ESR reading and the concentration of paraprotein of class IgM (y = 0.08x + 6.9; r = 0.20). This discrepancy could possibly be explained by the differences in composition of the investigated groups. Whereas the study of Ajubi et al.10 consisted of few subjects with paraprotein of class IgM (n = 9) with concentrations up to 20 g/L, our study was larger (n = 28) with paraprotein concentrations up to 43 g/L.
In addition to the study of Ajubi et al.10 we have also investigated the relationship between paraprotein concentrations of all three classes for both the TEST 1 and the StarrSed. Our results indicate that ESR values measured by the StarrSed are paraprotein concentration dependent, whereas those measured by TEST 1 are not with the exception of paraprotein of class IgG. For the overall study population, the influence of ESR readings by the StarrSed in the presence of a paraprotein was statistically greater than that measured by the TEST 1. The different influence of paraproteins on ESR readings in both methods might be explained by the dissimilarities in method principles. As described earlier, erythrocyte sedimentation occurs in three phases. In TEST 1, the ESR readings take place in the lag-phase before the actual sedimentation of the erythrocytes. In this phase only small changes in erythrocyte distribution occur as reorientation of erythrocytes takes place. As this process is most probably not influenced by the presence of a paraprotein, there will only be a minimal effect on the ESR reading. In contrast, in Westergren-based methods the ESR readings are largely influenced by the physical interactions in the second phase of the process. As paraprotein of class IgM has the greatest effect, the interaction of immunoglobulins with the negatively charged erythrocytes is most likely size-dependent. Moreover, as a pentamer, IgM has not only the best capability to shield the negative charges on the surface of an erythrocyte, but its size will also enhance rouleaux formation by coupling individual erythrocytes. This also explains why different regression slopes were found for different paraprotein classes.
As the influence of paraproteins on the TEST 1 ESR result is minimal in comparison with that of the StarrSed it may be postulated that TEST 1 is a better method to use as a screening technique for the presence of an infection in patients with a paraprotein. During the study, we have also collected data on CRP and leukocyte counts, but the majority of the subjects (n = 111; 78%) had a CRP concentration <6 mg/L and only two of the subjects with an increased CRP concentration had a leukocytosis indicating that most of the sampled patients did not show any signs of infection during this routine follow-up. Therefore, we were not able to investigate this hypothesis and a new study should be designed to do so.
In conclusion, this study supports the validity of TEST 1 for ESR measurement in patients with a paraprotein. ESR readings by TEST 1 result in similar clinical interpretation, but are less affected by the presence of a paraprotein, compared with Westergren-based methods. Conversely, TEST 1 is, therefore, not a useful indicator of the presence of a paraprotein.
Footnotes
ACKNOWLEDGEMENTS
The authors would like to thank Arno I W de Natris for his excellent technical assistance during the study period.