l-carnitine is an endogenous substance, vital in the transport of fatty acids across the inner mitochondrial membrane for oxidation. Disturbances in carnitine homeostasis can have a significant impact on human health; therefore, it is critical to define normal endogenous concentrations for l-carnitine and its esters to facilitate the diagnosis of carnitine deficiency disorders. This study was conducted to determine the normal concentrations of a number of carnitines in healthy adults using three analytical methods. The impact of age and gender on carnitine concentrations was also examined.
Methods
Blood samples were collected from 60 healthy subjects of both genders and various ages. Plasma samples were analysed for endogenous carnitine concentrations by radioenzymatic assay, high-performance liquid chromatography and electrospray tandem mass spectrometry.
Results
Precision and accuracy of results obtained for each assay were within acceptable limits. Average endogenous concentrations obtained from the three analytical methods in this study were in the range of 38–44, 6–7 and 49–50 μmol/L for l-carnitine, acetyl-l-carnitine and total carnitine, respectively. Comparison of results between the genders indicated that males had significantly higher endogenous plasma l-carnitine and total carnitine concentrations than females. Age was found to have no impact on plasma carnitine concentrations.
Conclusion
These results are useful in the evaluation of biochemical or metabolic disturbances and in the diagnosis and treatment of patients with carnitine deficiency.
Introduction
l-carnitine (3-hydroxy-4-N-trimethylammonium butyrate) is an endogenous substance present in all mammalian species. A wide range of biological activities of l-carnitine have been described, including buffering of the ratio of free coenzyme A (CoA) to Acyl CoA and as a scavenger of unwanted acyl groups; however, the most important role of l-carnitine is in the transport of fatty acids across the inner mitochondrial membrane for subsequent β-oxidation.1 Mitochondrial fatty acid oxidation is a fundamental source of cellular energy, particularly in cardiac and skeletal muscle; therefore it is not surprising that approximately 98% of the total carnitine concentrations within the body are located in these tissues.2,3 Despite the fact that plasma comprises only approximately 1% of the total body carnitine pool, it is commonly used in studies as an indication of the total body carnitine status in patients and subjects.4,5
Disturbances in carnitine homeostasis have been shown to impact greatly on human health. Metabolic disorders resulting in low plasma l-carnitine concentrations are associated with cardiomyopathy, encephalopathy, muscle weakness and even early death if left untreated.6,7 The less severe, but more common, secondary carnitine deficiency may be the result of impaired renal or hepatic function, or may be induced by administration of certain therapeutic agents, such as pivampicillin and valproic acid.6,8,9 It is therefore critical to properly define normal endogenous values for l-carnitine and its esters so that these carnitine deficiency disorders may be correctly and easily diagnosed.
Analytical methods used for the measurement of plasma carnitine concentrations can be categorized as enzymatic, chromatographic and mass spectrometric assays. Enzymatic assays represent the more traditional approach and most published papers of l-carnitine pharmacology have utilized this type of assay. High-performance liquid chromatography (HPLC) potentially has a wider application as it allows for the quantification of specific short-chain acylcarnitines, in addition to l-carnitine, which may be used as markers of metabolic diseases. Mass spectrometry methods are established in the diagnosis of metabolic disorders and have the added advantage of allowing the measurement of l-carnitine and an entire range of its esters in one analytical run. These assays have been reviewed in more detail elsewhere.10
While a large number of studies have reported a range of plasma l-carnitine concentrations in healthy adults (Table 1), most of these published reports have used modifications of early enzymatic assays.11–14 With the advent of newer HPLC and mass spectrometry methods, it is not known whether utilization of these methods has affected the interpretation of normal values. Consequently, the aim of this study was to determine normal concentrations and reference intervals for a number of endogenous carnitines in the healthy adult population using three analytical approaches – radioenzymatic assay (REA), HPLC and electrospray ionisation-tandem mass spectrometry (ESI MS/MS). In addition, the impact of gender and age on endogenous carnitine concentrations was examined.
Summary of previously reported healthy subject endogenous carnitine concentrations
Data are expressed as mean ± SD. REA, radioenzymatic assay; MS/MS, mass spectrometry; HPLC, high-performance liquid chromatography; ?, data not reported
Materials and methods
This study was reviewed and approved by the Human Research Ethics Committee of the University of South Australia. Subjects were completely informed of the study procedures and provided written informed consent prior to study initiation. The study was conducted in accordance with the Declaration of Helsinki and the National Statement on Ethical Conduct in Human Research issued by the National Health and Medical Research Council (Australia).
Sixty healthy adult subjects were recruited for study participation and were divided into four categories according to gender and age, as outlined in Table 2. A single blood sample (20 mL) was collected via venepuncture from each subject and transferred into heparinized collection tubes. Samples were stored on ice and centrifuged within 30 minutes of collection for the separation of plasma. Plasma was divided into three aliquots for sample analysis, one each for analysis by REA, HPLC and ESI MS/MS. An additional aliquot was taken from each plasma sample and combined to form a pooled plasma sample for use as a quality control.
Demographic data for each subject group
Parameter
Subject group
Females 18–40
Females >40
Males 18–40
Males >40
No. of subjects
15
15
15
15
Gender
Female
Female
Male
Male
Age: Group (years)
18–40
>40
18–40
>40
Age: mean ± SD (years)
25.9 ± 3.87
50.8 ± 8.13
28.2 ± 7.08
52.0 ± 6.71
All plasma samples were stored at −20°C until sample analysis. Previous preliminary studies have demonstrated that l-carnitine and its esters are stable for four weeks under the collection and storage conditions that were used.
All analytical laboratories were blinded to sample identification codes.
Quality control samples
Identical quality control samples were prepared for each of the three analytical methods and submitted for analysis with the subject samples. In order to test precision, 10 aliquots of a pooled plasma sample (QCP) were included in the sample set for each method. For assessment of accuracy, quality control samples with known concentrations were prepared with dialysed plasma and designated as QCA (l-carnitine 7.50 μmol/L, acetyl-l-carnitine 1.50 μmol/L, total carnitine 9.75 μmol/L), QCB (l-carnitine 30.0 μmol/L, acetyl-l-carnitine 6.00 μmol/L, total carnitine 39.0 μmol/L) and QCC (l-carnitine 150 μmol/L, acetyl-l-carnitine 30.0 μmol/L, total carnitine 195 μmol/L). Five aliquots of each of these quality control samples were included for analysis by each analytical method.
Radioenzymatic assay
Plasma samples were analysed for l-carnitine (free carnitine) concentrations by the Department of Chemical Pathology, Women's and Children's Hospital, Adelaide, South Australia. Samples were analysed by REA based on the method of Cederblad and Lindstedt,15 using the reaction:
Briefly, the analytical method comprised four steps: sample preparation, incubation, separation and quantification of the product. Samples were prepared by mixing 10 μL of plasma, 90 μL of water and 20 μL of carnitine acetyltransferase (1.25 mg/mL, F Hoffman La Roche Ltd, Basel, Switzerland). To this, 70 μL of a reagent solution was added, which consisted of 14C-acetyl-CoA (0.25 mCi/2.5 mL, NEN Life Science Products Inc., Boston, MS, USA) and acetyl-CoA (Sigma-Aldrich Pty Ltd.) in a combined concentration of 43 μmol/L and 0.025 mCi/3.5 mL in a potassium phosphate buffer (0.3 mmol/L, pH 7.6) containing 1.4 mmol/L N-ethyl maleimide (Sigma-Aldrich Pty Ltd., St Louis, MO, USA).
Each sample was incubated for 60 minutes at room temperature and then separated using an ion-exchange resin (BioRad AG2-X8, 20–50 mesh chloride form, BioRad Laboratories, Hercules, CA, USA). Radiolabelled product was quantified by scintillation counting. Standard curve samples were prepared using an l-carnitine chloride solution (Sigma-Aldrich Pty Ltd) over the range of 0–200 μmol/L and were processed according to the same procedure as the subject plasma samples.
High-performance liquid chromatography
Plasma samples were quantified for l-carnitine, acetyl-l-carnitine and total carnitine concentrations by the Centre for Pharmaceutical Research, University of South Australia, Adelaide, South Australia. Sample analysis was carried out using the fluorometric detection method described by Longo et al.16
In short, samples were purified by solid-phase extraction (Bond Elut SAX-Isolute cartridges 100 mg/mL, Varian, Palo Alto, CA, USA) followed by derivatisation with 1-aminoanthracene (Sigma-Aldrich Chemie GmbH) with 1-3-(dimethylaminopropyl)-3-ethylcarbodiimide hydrochloride (Aldrich Chemical Company Inc., Milwaukee, WI, USA) present as a catalyst. Chromatography was carried out using a Shimadzu pump (LC-10AD), automatic injector (SIL-10AD), system controller (SCL-10A) and spectrofluorometric detector (RF-10AXL; Shimadzu Corporation, Kyoto, Japan) together with a Varian Res Elut-BD C18 analytical column (4.6 mm × 250 mm, with spherical particles of 5 μmol/L; Varian) and an Alltech column heater (Model 530, 220 V; Alltech Associates Inc., Deerfield, IL, USA). The mobile phase was run at a flow rate of 1 mL/min and consisted of 35% acetonitrile (HiPerSolv for HPLC, BDH Laboratory Supplies, Leicestershire, UK) and 65% ammonium acetate buffer (0.1 mol/L, pH 3.5). The detector wavelengths were 248 nm (excitation) and 418 nm (emission). The sample injection volume was 20 μL and run time was 20 minutes. Integration was carried out using CLASS-VP software (Version 6.10, Shimadzu Corporation).
The standard curve was constructed using samples of dialysed human plasma spiked with aqueous solutions of l-carnitine, acetyl-l-carnitine and propionyl-l-carnitine. Calibration ranges for each of the analytes were: 2.5–160 μmol/L for l-carnitine, 0.5–32 μmol/L for acetyl-l-carnitine and 3.25–208 μmol/L for total carnitine (l-carnitine + acetyl-l-carnitine + propionyl-l-carnitine).
Electrospray tandem mass spectrometry
Subject plasma samples were analysed for l-carnitine, total carnitine and an array of 31 acylcarnitines (including acetyl-l-carnitine) by Pediatrix Screening, Bridgeville, PA, USA, based on the method described by Chace et al.17 (with modifications for plasma). Four 25 μL aliquots of each plasma sample were pipetted onto the designated target areas on purpose-prepared filter paper (S&S grade 903, Schleicher & Schuell Bioscience Inc., Keene, NH, USA) and allowed to dry for two to three hours at room temperature. Once dry, the filter papers were sealed inside individual glassine envelopes (Westvaco number 10 stamp envelopes, MeadWestvaco Corporation, Glen Allen, VA, USA) and then placed in plastic-covered foil zipper pouches containing desiccant pillows. The filter papers were then shipped to Pediatrix Screening for analysis.
The analysis involved extraction of plasma from a 3/16 in. punch of filter paper using 300 μL methanol containing stable isotopically labelled internal standards over a period of 30 minutes. Samples were then derivatized with 50 μL acidified butanol for 15 minutes at 65°C to form butyl-esters of the carnitines. The derivatized carnitines were then analysed by flow injection ESI MS/MS (API-Sciex 3000, Foster City, CA, USA) with a throughput of two minutes per sample. The modified method utilized multiple deuterated internal standards, allowing for correction for any free carnitine produced during the derivatization with acidified butanol.
Calibration ranges for each of the analytes were: 0–80 μmol/L for l-carnitine, 0–50 μmol/L for acetyl-l-carnitine and 0–10 μmol/L for non-acetyl acylcarnitines.
Total acylcarnitine concentrations were determined as the sum of all 31 of the quantified acylcarnitines. Total carnitine concentrations were calculated as the sum of l-carnitine and total acylcarnitines.
Data analysis
Statistical comparisons were performed on Ln-transformed data using an analysis of variance with post hoc analysis (contrasts) if significance was detected. Statistical examination of the relationship between carnitine concentrations and age was conducted using linear regression. Significance was set at an α level of 0.05. WinNonlin® Professional Version 4.1 (Pharsight Corporation, Mountain View, CA, USA) was used for all statistical analyses.
Reference interval was defined as the range of values which included 95% of the healthy population. As the distribution of carnitine concentrations within the population is slightly skewed, the lower and upper limits of the reference intervals for each analyte were determined as the 2.5 and 97.5 percentiles of the data.
Results
Sixty healthy adult subjects participated in the study and were partitioned into groups according to gender and age. The demographic details of each study group are outlined in Table 2.
The mean precision and accuracy values for l-carnitine, acetyl-l-carnitine and total carnitine were within 9% for all the analyses; the accuracy for total acylcarnitines was slightly higher for QCA (23.0%). Precision and accuracy results for each of the analytes by each analytical method are outlined in Table 3. It should be noted that the concentrations of each analyte quantified by ESI MS/MS for the high quality control samples (QCC) were outside the standard range and consequently these results were excluded in the calculation of accuracy values.
Precision (data expressed as %CV) and accuracy (data expressed as mean ± SD) results for l-carnitine, acetyl-l-carnitine, total acylcarnitine and total carnitine concentrations quantified by radioenzymatic assay (REA), high-performance liquid chromatography (HPLC) and electrospray ionisation-tandem mass spectrometry (ESI MS/MS)
Parameter
Analytical method
REA
HPLC
ESI MS/MS
Precision
l-Carnitine
2.90
5.00
8.58
Acetyl-l-carnitine
NA
3.97
7.56
Total acylcarnitine
NA
NA
6.59
Total carnitine
NA
3.19
8.12
Accuracy
l-Carnitine
QCA
−1.33 ± 7.30
7.21 ± 3.77
−6.39 ± 6.32
QCB
3.33 ± 4.71
8.15 ± 5.18
−8.47 ± 4.34
QCC
0.133 ± 7.47
4.44 ± 4.99
NA
Acetyl-l-carnitine
QCA
NA
7.10 ± 8.33
6.91 ± 9.18
QCB
NA
4.21 ± 4.47
3.54 ± 5.11
QCC
NA
2.46 ± 4.89
NA
Total acylcarnitine
QCA
NA
NA
23.0 ± 8.07
QCB
NA
NA
5.75 ± 3.75
QCC
NA
NA
NA
Total carnitine
QCA
NA
3.19 ± 12.2
0.390 ± 6.57
QCB
NA
3.96 ± 5.18
−5.19 ± 4.04
QCC
NA
9.00 ± 7.37
NA
NA, not analysed; Precision: 100 × SD of 10 measured concentrations of QCP/mean of 10 measured concentrations of QCP. Accuracy: 100 × (measured concentration − actual concentration)/actual concentration
Mean ± standard deviation (SD) and 95% confidence interval for l-carnitine, acetyl-l-carnitine, total acylcarnitine (defined as the sum of all acylcarnitines, including acetyl-l-carnitine) and total carnitine concentrations for each analytical method are detailed in Table 4. l-carnitine concentrations quantified by both HPLC and ESI MS/MS were significantly higher than those measured by REA. Both the l-carnitine and acetyl-l-carnitine concentrations measured by HPLC were slightly, but significantly, higher than the concentrations quantified by ESI MS/MS. No significant differences were found between total carnitine concentrations quantified by HPLC and ESI MS/MS.
Comparison of analytical methods: endogenous plasma l-carnitine, acetyl-l-carnitine, total acylcarnitine and total carnitine concentrations obtained by radioenzymatic assay (REA), high-performance liquid chromatography (HPLC) and electrospray ionisation tandem mass spectrometry (ESI MS/MS) (n = 60)
Parameter
Analytical method
REA
HPLC
ESI MS/MS
l-carnitine
38 ± 8.0 (36–40)
43.3 ± 8.57 (41.1–45.5)*
41.2 ± 10.1 (38.5–43.8)*†
Acetyl-l-carnitine
NA
6.65 ± 2.11 (6.10–7.19)
6.43 ± 2.01 (5.92–6.95)†
Total acylcarnitine
NA
NA
8.67 ± 2.38 (8.07–9.31)
Total carnitine
NA
49.2 ± 9.33 (46.8–51.6)
49.9 ± 11.0 (47.0–52.7)
NA, not analysed. Data are expressed as mean ± SD (95% confidence interval)
*P < 0.05, compared with REA
†P < 0.05, compared with HPLC
The effects of gender on carnitine concentrations were examined using the three analytical methods (Table 5). l-carnitine concentrations for the male subjects were shown to be significantly higher than those for females by all three analyses. Similarly, total carnitine concentrations were significantly higher in the males when compared with female subjects for both the HPLC and ESI MS/MS analyses, whereas no differences in acetyl-l-carnitine and acylcarnitine concentrations were found between the two genders. Average endogenous concentrations of l-carnitine and total carnitine were in the range of 35–40 μmol/L and 45–47 μmol/L for females and 41–47 μmol/L and 52–53 μmol/L for males.
Effect of gender: endogenous plasma l-carnitine, acetyl-l-carnitine, total acylcarnitine and total carnitine concentrations for females (n = 30) and males (n = 30) obtained by radioenzymatic assay (REA), high-performance liquid chromatography (HPLC) and electrospray ionisation-tandem mass spectrometry (ESI MS/MS)
Parameter
Gender
Female
Male
Radioenzymatic assay
l-Carnitine
35 ± 7.0 (32.6–37.8)
41 ± 7.9 (38.4–44.3)*
High-performance liquid chromatography
l-Carnitine
40.0 ± 7.70 (37.2–42.9)
46.6 ± 8.22 (43.5–49.7)*
Acetyl-l-carnitine
6.29 ± 2.21 (5.47–7.12)
7.00 ± 1.97 (6.27–7.74)
Total carnitine
45.9 ± 8.81 (42.6–49.2)
52.5 ± 8.79 (49.2–55.7)*
Electrospray ionisation-tandem mass spectrometry
l-Carnitine
38.2 ± 8.01 (35.2–41.2)
44.1 ± 11.3 (39.9–48.3)*
Acetyl-l-carnitine
6.29 ± 2.31 (5.43–7.16)
6.58 ± 1.67 (5.96–7.20)
Total acylcarnitine
8.21 ± 2.62 (7.41–9.47)
9.15 ± 2.03 (8.20–9.68)
Total carnitine
46.7 ± 9.45 (43.1–50.2)
53.1 ± 11.7 (48.7–57.4)*
*P < 0.05, compared with female group
Differences in carnitine concentrations between the two different age groups (18–40 and >40 years) were examined (Table 6) and age was found to have no impact on carnitine concentrations quantified by any of the analytical methods. No significant differences between the age groups were found within each gender group. Similarly, statistical correlations between age and carnitine concentrations resulted in no significant results (data not presented).
Effect of age: endogenous plasma l-carnitine, acetyl-l-carnitine, total acylcarnitine and total carnitine concentrations for subjects aged 18–40 years (n = 30) and >40 years (n = 30) obtained by radioenzymatic assay (REA), high-performance liquid chromatography (HPLC) and electrospray ionization-tandem mass spectrometry (ESI MS/MS)
Parameter
Age group
18–40
>40
Radioenzymatic assay
l-carnitine
All subjects
39 ± 7.3 (36–42)
38 ± 8.7 (34–41)
Female subjects
36 ± 6.8 (32–39)
35 ± 7.4 (31–39)
Male subjects
42 ± 6.2 (39–46)
40 ± 9.3 (35–45)
High-performance liquid chromatography
l-carnitine
All subjects
43.7 ± 8.29 (40.6–46.8)
43.0 ± 8.96 (39.6–46.3)
Female subjects
40.3 ± 8.08 (35.8–44.8)
39.8 ± 7.57 (35.6–44.0)
Male subjects
47.1 ± 7.24 (43.1–51.1)
46.1 ± 9.34 (41.0–51.3)
Acetyl-l-carnitine
All subjects
6.55 ± 2.14 (5.76–7.35)
6.74 ± 2.11 (5.95–7.53)
Female subjects
6.22 ± 1.80 (5.23–7.22)
6.36 ± 2.62 (4.91–7.81)
Male subjects
6.88 ± 2.45 (5.52–8.23)
7.12 ± 1.42 (6.33–7.91)
Total carnitine
All subjects
48.5 ± 8.91 (45.2–51.8)
49.9 ± 9.83 (46.2–53.5)
Female subjects
45.7 ± 8.41 (41.0–50.3)
46.1 ± 9.48 (40.9–51.4)
Male subjects
51.3 ± 8.75 (46.5–56.2)
53.6 ± 8.98 (48.6–58.5)
Electrospray ionisation-tandem mass spectrometry
l-carnitine
All subjects
42.1 ± 9.91 (38.4–45.8)
40.2 ± 10.4 (36.3–44.1)
Female subjects
38.8 ± 8.37 (34.1–43.4)
37.6 ± 7.88 (33.3–42.0)
Male subjects
45.4 ± 10.5 (39.6–51.2)
42.8 ± 12.2 (36.1–49.6)
Acetyl-l-carnitine
All subjects
6.30 ± 1.81 (5.62–6.98)
6.57 ± 2.21 (5.75–7.40)
Female subjects
6.11 ± 1.72 (5.15–7.06)
6.47 ± 2.83 (4.91–8.04)
Male subjects
6.49 ± 1.94 (5.42–7.56)
6.66 ± 1.42 (5.88–7.45)
Total acylcarnitine
All subjects
8.47 ± 2.16 (7.66–9.28)
8.90 ± 2.64 (7.92–9.89)
Female subjects
8.22 ± 2.14 (7.03–9.40)
8.66 ± 3.34 (6.81–10.5)
Male subjects
8.72 ± 2.21 (7.50–9.95)
9.16 ± 1.77 (8.18–10.1)
Total carnitine
All subjects
50.6 ± 10.4 (46.7–54.4)
49.1 ± 11.7 (44.8–53.5)
Female subjects
47.0 ± 9.47 (41.8–52.2)
46.3 ± 9.76 (40.9–51.7)
Male subjects
54.1 ± 10.4 (48.4–59.9)
52.0 ± 13.2 (44.7–59.3)
Data are expressed as mean ± standard deviation (95% confidence interval)
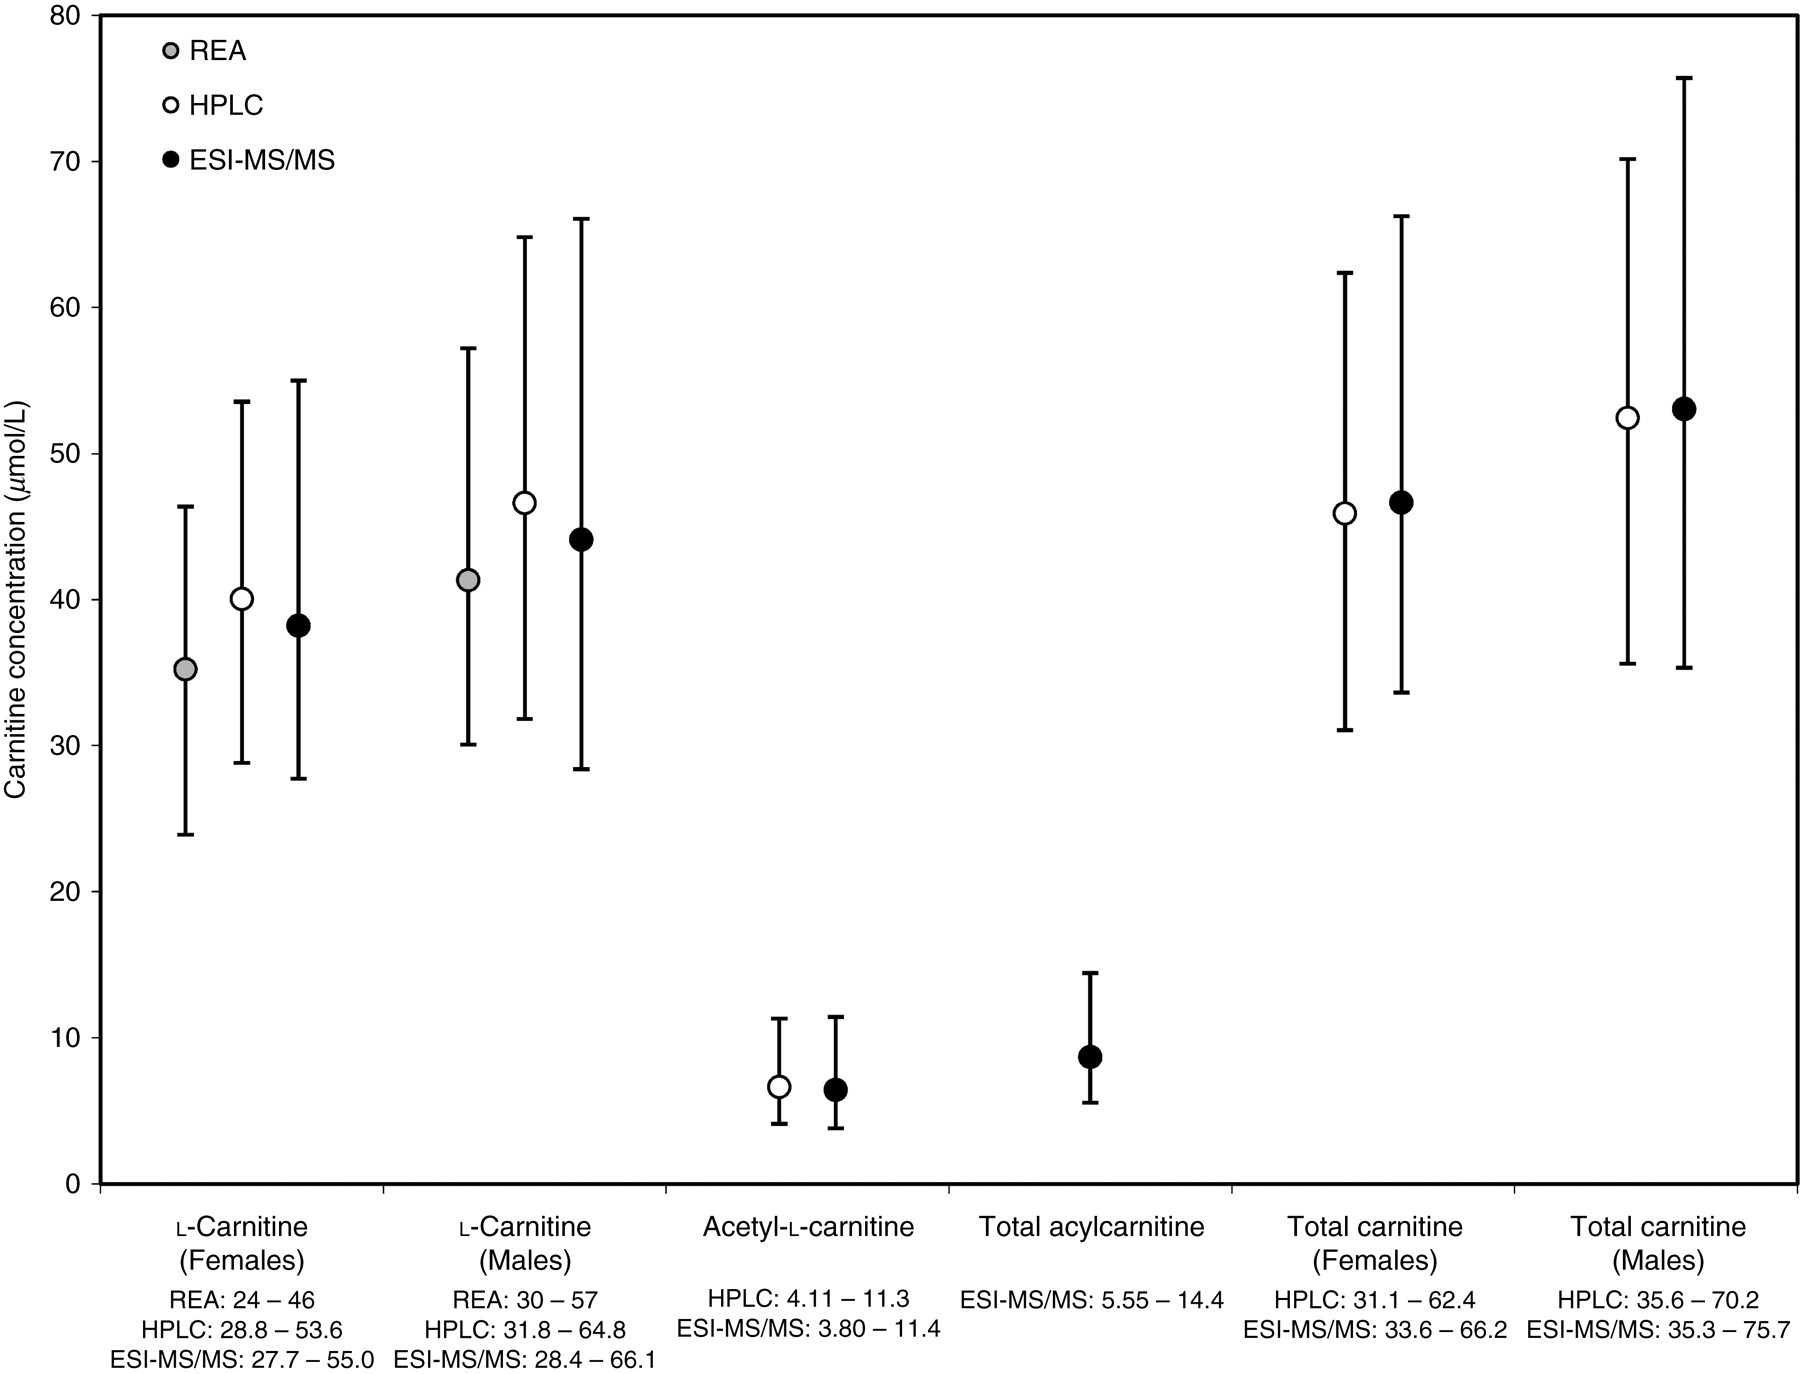
The reference intervals for l-carnitine (stratified into females and males), acetyl-l-carnitine, total acylcarnitine and total carnitine (stratified into females and males) for each analytical method are presented in Figure 1. The reference intervals show significant overlap between the analytical methods and are comparable in width for each analyte.
Reference intervals for endogenous l-carnitine, acetyl-l-carnitine, total acylcarnitine and total carnitine concentrations obtained by radioenzymatic assay, high-performance liquid chromatography and electrospray ionisation-tandem mass spectrometry. Data are expressed as mean within reference interval
Discussion
Numerous studies have reported plasma carnitine concentrations in healthy subjects with varying results 4,5,18–39 (Table 1). Mean ± SD values for l-carnitine in healthy adults have been reported as low as 20.7 ± 0.97 μmol/L28 and as high as 49.8 ± 2.0 μmol/L.25 Similar variations have been observed in the reporting of total carnitine (26.6 ± 1.18 to 57 ± 2.3 μmol/L), acetyl-l-carnitine (0.84 ± 0.20 to 10.2 ± 0.368 μmol/L) and other carnitine concentrations.19,22,28 The variability appears to be independent of the assay used, with the majority of studies reporting values obtained from REA analysis. These inconsistencies present complexities in defining normal endogenous concentrations for carnitines in healthy adults and consequently the diagnosis of carnitine deficiency disorders becomes difficult. This study has therefore been designed to determine normal concentrations and reference intervals for endogenous l-carnitine, total carnitine and acetyl-l-carnitine in healthy adults using three different analytical methods.
The analytical methods employed in this study are validated techniques and are commonly used for diagnostic and/or research purposes. The precision and accuracy results obtained in this study for each of the assays were well within acceptable limits.
Comparison of carnitine concentrations obtained from each analytical method indicated that there were significant differences in the concentrations of l-carnitine and acetyl-l-carnitine quantified. However, examination of the data reveals that the average plasma concentrations are similar and in the range of 38–44 μmol/L. Analysis of samples by HPLC and ESI MS/MS resulted in average plasma concentrations which differed by only 4.8%, whereas assay by REA produced lower average concentrations than the other analytical methods (7.8% lower than ESI MS/MS and 12.2% lower than HPLC). Endogenous acetyl-l-carnitine concentrations quantified by HPLC and ESI MS/MS were approximately 6–7 μmol/L, with 3.3% difference in average concentrations between the assays. There were no significant differences in total carnitine concentrations between the methods (49–50 μmol/L, 1.4% difference). The concentrations of carnitines obtained in the present study are comparable with those previously reported in healthy adult subjects in several studies.5,18,23,26,29–31,35,36
Examination of the effect of gender on plasma carnitine concentrations indicated that concentrations of l-carnitine and total carnitine are significantly higher in adult males than females in each of the analytical methods utilized. In this study, average l-carnitine concentrations were in the range of 35–40 μmol/L for females and 41–47 μmol/L for males, whereas total carnitine concentrations were in the range of 45–47 μmol/L for females and 52–54 μmol/L for males. Similarly, Lombard et al.27 has previously demonstrated significantly higher plasma l-carnitine and total carnitine concentrations in males than in females with l-carnitine concentrations of 39.9 ± 4.9 μmol/L and 32.5 ± 5.3 μmol/L and total carnitine concentrations of 49.4 ± 7.3 μmol/L and 43.3 ± 5.5 μmol/L in males and females, respectively. Niu et al.30 also reported significantly higher concentrations of l-carnitine and total carnitine in plasma of healthy male subjects than females; however, it was also noted that acetyl-l-carnitine concentrations were significantly different between genders, a result which was not demonstrated in the present study. Differences between the genders in plasma total carnitine concentrations were also noted by Borum et al.20 Harper et al.23 also examined the effect of gender on plasma carnitine concentrations and although a significant difference was observed in l-carnitine concentrations, no differences between males and females were noted for total carnitine. The average plasma carnitine concentrations for males and females calculated in the present study are similar to those reported in the above studies.
A limited number of studies have examined the effect of age on plasma carnitine concentrations in healthy subjects. Age was found to have no impact on any of the analytes quantified in the present study, neither with significant differences between the two age groups examined, nor differences between the age groups within the genders. Similarly, no significant correlations between age and carnitine concentrations were observed. Borum et al.20 previously demonstrated a significant correlation between age and endogenous plasma total carnitine concentrations in healthy females (but not males), a result which could not be replicated in the present study.
The reference intervals calculated from the three analytical methods in this study are very similar, with significant overlap in the intervals for each of the analytes and similar interval widths (Figure 1). However, there were slight differences in the upper and lower limits of the reference intervals obtained in this study, illustrating the importance of the development of laboratory-specific reference intervals for use in the diagnosis of primary and secondary carnitine deficiencies. In doing so, gender should be taken into consideration in the determination of reference intervals for l-carnitine and total carnitine; however, age is shown to have no impact. Laboratory-specific reference intervals are expected to be similar to those obtained from our laboratories.
Footnotes
ACKNOWLEDGEMENT
This project was supported by an unrestricted research grant from Sigma-Tau Pharmaceuticals Inc.
References
1.
BremerJ. Carnitine: metabolism and functions. Physiol Rev1983;63:1420–80
2.
BrassEP. Pharmacokinetic considerations for the therapeutic use of carnitine in hemodialysis patients. Clin Ther1995;17:176–85
3.
EvansAM, FornasiniG. Pharmacokinetics of L-carnitine. Clin Pharmacokinet2003;42:941–67
4.
Debska-SlizienA, KaweckaA, WojnarowskiK, Correlation between plasma carnitine, muscle carnitine and glycogen levels in maintenance hemodialysis patients. Int J Artif Organs2000;23:90–6
5.
SavicaV, BellinghieriG, Di StefanoC, Plasma and muscle carnitine levels in haemodialysis patients with morphological–ultrastructural examination of muscle samples. Nephron1983;35:232–6
6.
PonsR, De VivoDC. Primary and secondary carnitine deficiency syndromes. J Child Neurol1995;10(Suppl. 2):S8–S24
FamularoG, MatricardiF, NuceraE, SantiniG, De SimoneC. Carnitine deficiency: primary and secondary syndromes. In: De SimoneC, FamularoG eds. Carnitine Today. Austin, TX: RG Landes Company, 1997: 119–61
10.
FornasiniG, EvansAM. Analysis of free carnitine in plasma of ESRD patients undergoing chronic dialysis: what is the best assay?Dial Transplant2003;32:S2–S11
11.
BohmerT, RydningA, SolbergHE. Carnitine levels in human serum in health and disease. Clin Chim Acta1974;57:55–61
12.
De SousaC, EnglishNR, StaceyTE, ChalmersRA. Measurement of L-carnitine and acylcarnitines in body fluids and tissues in children and in adults. Clin Chim Acta1990;187:317–28
13.
McGarryJD, FosterDW. An improved and simplified radioisotopic assay for the determination of free and esterified carnitine. J Lipid Res1976;17:277–81
14.
ParvinR, PandeSV. Microdetermination of (−)carnitine and carnitine acetyltransferase activity. Anal Biochem1977;79:190–201
15.
CederbladG, LindstedtS. A method for the determination of carnitine in the picomole range. Clin Chim Acta1972;37:235–43
16.
LongoA, BrunoG, CurtiS, MancinelliA, MiottoG. Determination of L-carnitine, acetyl-L-carnitine and propionyl-L-carnitine in human plasma by high-performance liquid chromatography after pre-column derivatization with 1-aminoanthracene. J Chromatogr B Biomed Appl1996;686:129–39
17.
ChaceDH, HillmanSL, Van HoveJL, NaylorEW. Rapid diagnosis of MCAD deficiency: Quantitative analysis of octanoylcarnitine and other acylcarnitines in newborn blood spots by tandem mass spectrometry. Clin Chem1997;43:2106–13
18.
BellinghieriG, SavicaV, MallamaceA, Correlation between increased serum and tissue L-carnitine levels and improved muscle symptoms in hemodialyzed patients. Am J Clin Nutr1983;38:523–31
19.
BeneJ, KomlosiK, GasztonyiB, JuhaszM, TulassayZ, MeleghB. Plasma carnitine ester profile in adult celiac disease patients maintained on long-term gluten free diet. World J Gastroenterol2005;11:6671–5
20.
BorumPR. Plasma carnitine compartment and red blood cell carnitine compartment of healthy adults. Am J Clin Nutr1987;46:437–41
21.
FurstP, GlogglerA. Reappraisal of carnitine concentrations in blood. Clin Chem1987;33:1956–7
22.
GolperTA, WolfsonM, AhmadS, Multicenter trial of L-carnitine in maintenance hemodialysis patients. I. Carnitine concentrations and lipid effects. Kidney Int1990;38:904–11
23.
HarperP, WadströmC, CederbladG. Carnitine measurements in liver, muscle tissue, and blood in normal subjects. Clin Chem1993;39:592–9
24.
JonesMG, GoodwinCS, AmjadS, ChalmersRA. Plasma and urinary carnitine and acylcarnitines in chronic fatigue syndrome. Clin Chim Acta2005;360:173–7
25.
LeschkeM, RumpfKW, EisenhauerT, Quantitative assessment of carnitine loss during hemodialysis and hemofiltration. Kidney Int1983;24(Suppl. 16):S143–6
26.
LohningerA, SendicA, StaniekH, Endurance exercise training and L-carnitine supplementation stimulates gene expression in the blood and muscle cells in young athletes and middle aged subjects. Monatsh Chem2005;136:1425–42
27.
LombardKA, OlsonAL, NelsonSE, ReboucheCJ. Carnitine status of lactoovovegetarians and strict vegetarian adults and children. Am J Clin Nutr1989;50:301–6
28.
MaccariF, HülsmannWC. (Acyl)carnitine distribution between plasma, erythrocytes, and leukocytes in human blood. Clin Chem1989;35:711
29.
MayerG, GrafH, LegensteinE, LinhartL, AuerB, LohningerA. L-carnitine substitution in patients on chronic hemodialysis. Nephron1989;52:295–9
30.
NiuYJ, JiangZM, ShuH, [Assay of carnitine in plasma urine of healthy adults] (abstract). Zhongguo Yi Xue Ke Xue Yuan Xue Bao2002;24:185–7
31.
PennD, Schmidt-SommerfeldE. Carnitine and carnitine esters in plasma and adipose tissue of chronic uremic patients undergoing hemodialysis. Metabolism1983;32:806–9
32.
Rodriguez-SegadeS, Alonso de la PenaC, PazJM, Carnitine deficiency in haemodialysed patients. Clin Chim Acta1986;159:249–56
33.
Rodriguez-SegadeS, Alonso de la PenaC, PazM, Carnitine concentrations in dialysed and undialysed patients with chronic renal insufficiency. Ann Clin Biochem1986;23:671–5
34.
SegreG, BianchiE, CorsiM, D'IddioS, GhirardiO, MaccariF. Plasma and urine pharmacokinetics of free and of short-chain carnitine after administration of carnitine in man. Arzneimittelforschung1988;38:1830–4
35.
Van EsA, HennyFC, KooistraMP, LobattoS, ScholteHR. Amelioration of cardiac function by L-carnitine administration in patients on haemodialysis. Contrib Nephrol1992;98:28–35
36.
VinciE, RampelloE, ZanoliL, OresteG, PistoneG, MalaguarneraM. Serum carnitine levels in patients with tumoral cachexia. Eur J Intern Med2005;16:419–23
37.
WannerC, Förstner-WannerS, RössleC, FürstP, SchollmeyerP, HörlWH. Carnitine metabolism in patients with chronic renal failure: effect of L-carnitine supplementation. Kidney Int1987;32(Suppl. 22):S132–5
38.
WannerC, Förstner-WannerS, SchaefferG, SchollmeyerP, HörlWH. Serum free carnitine, carnitine esters and lipids in patients on peritoneal dialysis and hemodialysis. Am J Nephrol1986;6:206–11
39.
WannerC, WäckerleB, BoeckleH, SchollmeyerP, HörlWH. Plasma and red blood cell carnitine and carnitine esters during L-carnitine therapy in hemodialysis patients. Am J Clin Nutr1990;51:407–10