
Abstract
Background
Creatine plays an important role in the storage and transmission of phosphate-bound energy. The cerebral creatine deficiency syndromes (CCDS) comprise three inherited defects in creatine biosynthesis and transport. They are characterized by mental retardation, speech and language delay and epilepsy. All three disorders cause low-creatine signal on brain magnetic resonance spectroscopy (MRS); however, MRS may not be readily available and even when it is, biochemical tests are required to determine the underlying disorder.
Methods
Analysis was performed by liquid chromatography-tandem mass spectrometry in positive ionization mode. Samples were analysed underivatized using a rapid ‘dilute and shoot’ approach. Chromatographic separation of the three compounds was achieved. Stable isotope internal standards were used for quantification.
Results
Creatine, creatinine and guanidinoacetate were measured with a 2.5 minute run time. For guanidinoacetate, the standard curve was linear to at least 5000 μmol/L and for creatine and creatinine it was linear to at least 25 mmol/L. The lower limit of quantitation was 0.4 μmol/L for creatine and guanidinoacetate and 0.8 μmol/L for creatinine. Recoveries ranged from 86% to 106% for the three analytes. Intra- and inter-assay variation for each analyte was <10% in both urine and plasma.
Conclusion
A tandem mass spectrometric method has been developed and validated for the underivatized determination of guanidinoacetate, creatine and creatinine in human urine and plasma. Minimal sample preparation coupled with a rapid run time make the method applicable to the routine screening of patients with suspected CCDS.
Introduction
Creatine is predominantly synthesized in the liver and kidney with a small amount produced in the pancreas. Approximately 1 g of creatine is produced endogenously per day 1 with a similar amount originating from the diet (meat, oily fish). If the diet is supplemented with creatine, endogenous production is reduced. The creatine biosynthetic pathway is shown in Figure 1. The first, and rate-limiting step in creatine biosynthesis is the formation of ornithine and guanidinoacetate from glycine and arginine by arginine:glycine amidinotransferase (AGAT) in the kidney. 2 Guanidinoacetate is then transferred to the liver where it receives the methyl group from S-adenosylmethionine. This step is catalyzed by guanidinoacetate methyltransferase (GAMT) and results in the formation of creatine. Creatine inhibits AGAT, possibly at the level of mRNA translation, creating a negative feedback loop. 3 Creatine is taken up into the tissues, against a concentration gradient, through the creatine transporter (CRTR) where it is non-enzymatically converted to creatinine. 4 The expression of the transporter in particular tissues parallels that of the creatine kinase expression so that creatine can be transported into tissues with high adenosine triphosphate requirements. Although creatine plays an integral role in the function of muscle, skeletal myopathy is not a prominent feature in patients with creatine deficiency, neither is cardiomyopathy. Esenauer et al. 5 investigated skeletal muscle by magnetic resonance spectroscopy (MRS) in a patient with GAMT deficiency and demonstrated the presence of significant amounts of creatine, phosphocreatine and phosphorylated guanidinoacetate and postulated that separate mechanisms exist for the uptake and synthesis of creatine in brain and muscle, respectively.
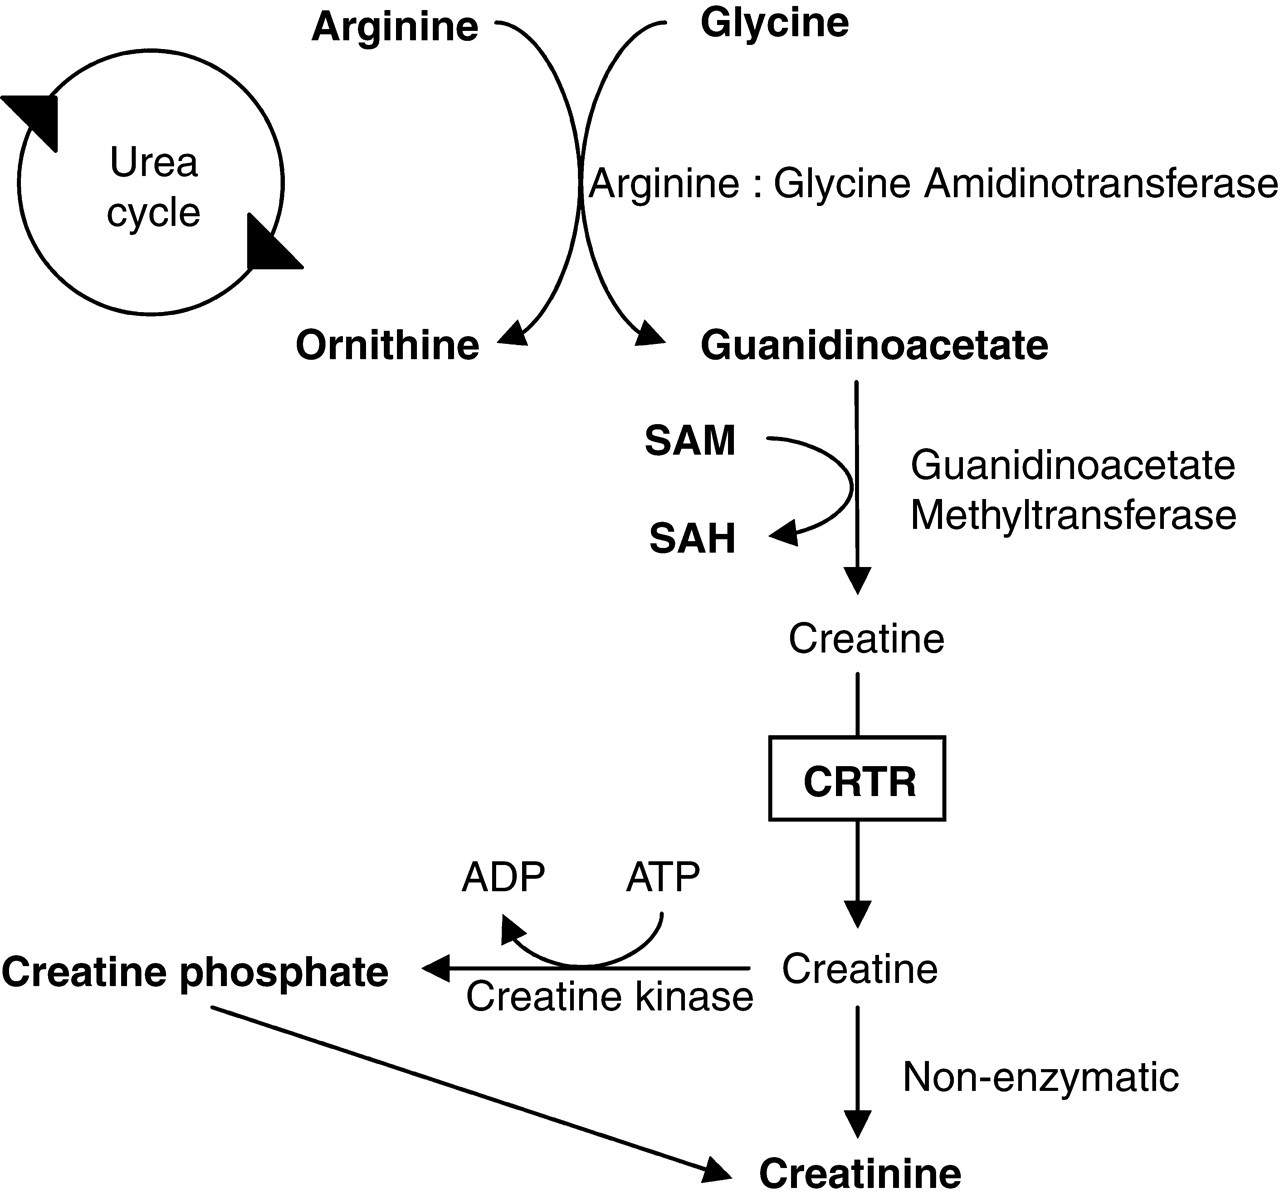
Creatine biosynthetic pathway. CRTR, creatine transporter; SAH, S-adenosylhomocysteine; SAM, S-adenosylmethionine
Since 1994, three cerebral creatine deficiency syndromes (CCDS) have been described; GAMT deficiency, 6 AGAT deficiency 7 and CRTR deficiency. 8 The common features of the CCDS are mental retardation (MR), speech delay, epilepsy and cerebral creatine deficiency as measured by in vivo proton MRS. 9,10 However, this is an expensive investigation not offered in all centres and even when it is, determination of creatine and guanidinoacetate in body fluids is still required to elucidate the cause of the cerebral creatine deficiency. While CRTR and AGAT patients usually respond well to conventional antiepileptics, some patients with AGAT and GAMT deficiency will respond to treatment with oral creatine monohydrate, 11,12 so the diagnosis of the CCDS is important.
The most common of the CCDS is CRTR deficiency which is an X-linked disorder resulting from mutations in the SLC6A8 gene and causes mild to severe MR, absent or delayed speech and epilepsy. Biochemically, these patients have increased urinary creatine:creatinine ratios and plasma creatine is usually within the reference range. Diagnosis can be confirmed using mutation analysis and creatine uptake in fibroblasts. 8 CRTR deficiency is thought to be a relatively common cause of X-linked MR (XLMR) and its prevalence in this population has been investigated by several authors. Rosenberg et al. 13 investigated 290 patients with XLMR and found that the prevalence of CRTR deficiency, as demonstrated by SLC6A8 mutation analysis, to be 2.1% which is similar to that of fragile-X syndrome. A similar study of 114 boys with MR reported an even higher prevalence of 3.5%, 14 whereas two other studies reported slightly lower prevalences of 1% and 0.25% in populations of 478 males with MR 15 and 1600 males with MR and/or autism, 16 respectively. These studies demonstrate the importance of screening for CRTR in patients with XLMR.
GAMT deficiency is an autosomal recessive disorder with a more complex phenotype than CRTR deficiency. It is associated with MR, epileptic seizures, speech delay, autism and extrapyramidal movement disorder. 17 The pathogenesis of GAMT deficiency is thought to involve the toxicity of guanidinoacetate as well as the deficiency of creatine. In GAMT deficiency, there are increased concentrations of guanidinoacetate in urine, plasma and cerebrospinal fluid (CSF) with low concentrations of creatine in urine and plasma. The diagnosis can be confirmed using mutation analysis 15 or enzyme analysis in lymphocytes or cultured amniocytes. 16,17 The prevalence of GAMT deficiency is not yet known but in the region of 30 patients had been reported by 2005. 17–21
AGAT deficiency is an autosomal recessive disorder characterized by mild MR and autistic behaviour. It is the least common of the CCDS with only four cases, from two unrelated families, being reported to date. 7,22,23 Biochemically, these patients have decreased concentrations of guanidinoacetate and creatine in both urine and plasma. Mutation and enzyme analysis are available for confirmation of the diagnosis. 7
Several analytical methods for the determination of guanidinoacetate and creatine in biological samples have been validated, including gas chromatography-mass spectrometry (GCMS), 24,25 liquid chromatography (LC)/atmospheric pressure chemical ionization-MS 26 and LC tandem MS (LC-MSMS). 27–29 However, without exception these methods require some form of sample pretreatment such as solid-phase extraction or derivatization that makes sample preparation time-consuming, labour-intensive and more expensive. Furthermore, the GCMS assay does not allow the simultaneous determination of creatinine so a separate assay is required. High-performance LC (HPLC) with fluorescence detection has also been used, 30 but the inability to separate creatine from creatinine is a major limitation. 31 We have developed and validated a rapid, robust method for the determination of creatine and guanidinoacetate in urine and plasma, suitable for the routine investigation of patients with suspected CCDS. The LC-MSMS assay described here does not require sample derivatization or clean up but still provides adequate sensitivity for the analysis of patient samples. One other method employing a similar ‘dilute and shoot’ approach has been reported 32 but exists only in abstract form with no published method validation. Although to date relatively few patients with CCDS have been reported this is likely to be a reflection of the limited availability of quantitative assays, resulting in significant under diagnosis.
Materials and methods
Reagents
Creatine, creatinine, guanidinoacetate, bovine serum albumin (BSA) and formic acid were supplied by Sigma Chemicals (Poole, Dorset, UK). HPLC grade methanol (AnalaR) was purchased from BDH (Poole, England). [2H3]-creatine (99.0% isotopic purity) and [2H3]-creatinine (99.8% isotopic purity) were obtained from CDN isotopes (Quebec, Canada) and [13C2]-guanidinoacetate was supplied by Dr HJ Ten Brink (VU University Medical Centre, Amsterdam, the Netherlands).
Standards, internal standards and quality control
Aqueous stock standards of each analyte (5, 50 and 100 mmol/L for guanidinoacetate, creatine and creatinine, respectively) and internal standard (4, 10 and 25 mmol/L for [13C2]-guanidinoacetate, [2H3]-creatine and [2H3]-creatinine, respectively) were prepared. Formic acid (50 μL 98%/50 mL) was added to aid dissolution of guanidinoacetate. Mixed working standards were prepared by further dilution of the stock standards to produce a series of calibrators. A set of mixed working standards were also prepared in phosphate-buffered saline (PBS), pH 7.4 containing 4.5% BSA, for the determination of the LOQ. Combined working internal standard solution was prepared by further dilution of the stock internal standards to give concentrations of 100 μmol/L for [13C2]-guanidinoacetate and [2H3]-creatine and 1 mmol/L for [2H3]-creatinine for analysis of urine and concentrations of 5 μmol/L [13C2]-guanidinoacetate and [2H3]-creatine for analysis of plasma. All calibrators and internal standards were stored at −80°C.
Urine and plasma samples were aliquoted and stored in polypropylene microfuge tubes at −80°C for use as quality control (QC) material.
Sample preparation
Urine
Samples, standards or QC (50 μL) were added to polypropylene microfuge tubes (1.5 mL). Internal standard (50 μL) was added and the sample vortex mixed. Distilled water was added (500 μL), the sample vortex mixed and then microfuged at 13,000 rpm for 10 minutes. Two hundred microlitres were transferred to a 96-well microtitre plate for analysis.
Plasma
Samples or QC samples (50 μL) were added to polypropylene microfuge tubes (1.5 mL). Internal standard (50 μL) was added and the sample vortex mixed. Methanol was added (500 μL), the sample vortex mixed and then microfuged at 13,000 rpm for 10 minutes. Two hundred microlitres of supernatant were transferred to a 96-well microtitre plate for analysis.
High-performance liquid chromatography
Chromatography was performed on a Perkin Elmer Series 200 pump and autosampler. Creatine, creatinine and guanidinoacetate were separated isocratically by injecting sample extract (5 μL) onto a C18 Synergi Fusion RP column (4 μm 150 × 3.0 mm) fitted with a Security Guard C18 column (4.0 × 3.0 mm), both from Phenomonex (Macclesfield, UK). The column assembly was at ambient temperature. The mobile phase was composed of methanol and 0.025% formic acid (5:95 v/v) and delivered at a flow rate of 500 μL/minute. The total run time was 2.5 minutes.
Mass spectrometry
A triple quadrupole mass spectrometer, Sciex API 2000 (Applied Biosystems) was used for analysis. The instrument was operated in positive ionization mode and sample introduction was via the HPLC system described above. To tune the mass spectrometer, 10 μmol/L solutions of creatinine, creatine and guanidinoacetate in mobile phase were infused directly into the ion source. For each analyte, the source conditions were optimized to maximize the intensity of the MH+ precursor ions for the analytes and internal standards (m/z 114, 117, 118, 120, 132 and 135). The optimized settings are summarized in Table 1. The collision energy was then adjusted to optimize the signal for the most abundant product ions (m/z 44, 47, 76, 78, 90 and 93). The common instrument settings were as follows: capillary voltage, 5.5 kV; source temperature 400°C; curtain gas 20 pounds per square inch (psi); collision-activated dissociation gas 3; nebulizing gas 50 psi; heater gas 50 psi; interface heater on.
Optimized settings for mass spectrometer
All data were acquired in multiple reaction monitoring mode with a dwell time of 100 ms per channel. The transitions monitored were 114 > 44, 117 > 47, 118 > 76, 120 > 78, 132 > 90, 135 > 92 for creatinine, [2H3]-creatinine, guanidinoacetate, [13C2]-guanidinoacetate, creatine and [2H3]-creatine, respectively. Data acquisition and processing were performed with Analyst™ version 1.4.1 software (Applied Biosystems). Calibration curves were constructed using least squares regression with 1/x weighting and were analysed with each batch of samples.
Assay performance
Linearity
Standard curves were prepared in triplicate and analysed in a single batch. Analyte to internal standard peak area ratio was plotted against analyte concentration. All calibration curves were linear (correlation coefficient, r 2 > 0.99).
Ion suppression
Ion suppression was investigated by direct infusion of internal standard solution into the mass spectrometer while an extracted urine sample was simultaneously injected via the autosampler. This process was repeated with a plasma extract.
Precision
Intra-batch precision was determined at various concentrations by randomized analysis of patient samples, 10 times within one batch. Inter-batch precision was determined using the analysis of the same patient sample, 10 times, over a four-week period. A coefficient of variation (CV) of <10% was considered acceptable.
Sensitivity
Lower limit of quantitation (LOQ) was determined by serial dilutions of matrix-matched standards (PBS containing 4.5% BSA). Samples were analysed 10 times within a batch and the LOQ was taken to be the lowest concentration of each analyte that was measurable with a %CV < 20, bias < 20% and a signal-to-noise ratio > 10. The limit of detection (LOD) was determined using the same set of samples and was defined as the analyte concentration that gives a 3:1 signal-to-noise ratio.
Recovery
Recovery was determined by comparison of each analyte in patient samples, before and after the addition of a known amount of each analyte. Urine samples (n = 6) were spiked to give additional concentrations of guanidinoacetate, creatine and creatinine of 0, 250, 1000 and 5000 μmol/L, 0, 2500, 10,000 and 20,000 μmol/L and 0, 5 and 20 mmol/L, respectively. Plasma samples (n = 6) were spiked to give additional concentrations of guanidinoacetate and creatine of 0, 2,10 and 40 μmol/L, and 0, 10, 50 and 200 μmol/L respectively.
Stability
The effect of storage temperature on the stability of the three analytes was investigated. Six urine samples were aliquoted. One aliquot of each was immediately frozen while the others were left at room temperature and 4°C for 1, 2, 3, 4, 5, 6, 8 and 12 hours. Stability was also assessed by analysis of urine samples after one to seven freeze thaw cycles. The stability in lithium heparin plasma, blood and serum was investigated. Six plasma samples were aliquoted and left at room temperature. One aliquot of each was immediately frozen while others were left at room temperature for 3, 6, and 24 hours. This was repeated for serum except with the serum left in the gel tube and an aliquot was removed at the appropriate time. Six blood samples were aliquoted and left at room temperature for 1, 2, 3, 4, 5 and 6 hours prior to separation and freezing. In each case, samples were judged to be stable if the variation in results was less than the within-batch CV. For samples where the variation was greater than the within-batch CV, an F test was performed and P < 0.05 was considered to indicate a significant difference.
Accuracy
The accuracy of the method was assessed by the comparison of urine and plasma assays with the all-laboratory trimmed mean (ALTM) of the European Research Network Inherited Disorders of Metabolism (ERNDIM) quality assurance samples.
Method comparison
Method comparison was performed on patient samples that had previously been analysed by an established GCMS method at VU University Medical Center, Amsterdam, Netherlands (urine, n = 22, plasma n = 44) or LC-MSMS method at Greenwood Genetics Centre, SC, USA (urine, n = 93). The results were compared using the Bland–Altman plots.
Patient samples
Samples from four patients with CCDS confirmed by mutation analysis were analysed.
Results
Under the conditions described above, creatinine, guanidinoacetate and creatine eluted with their respective internal standards and had retention times of 1.24, 1.47 and 1.60 minutes, respectively (Figure 2).
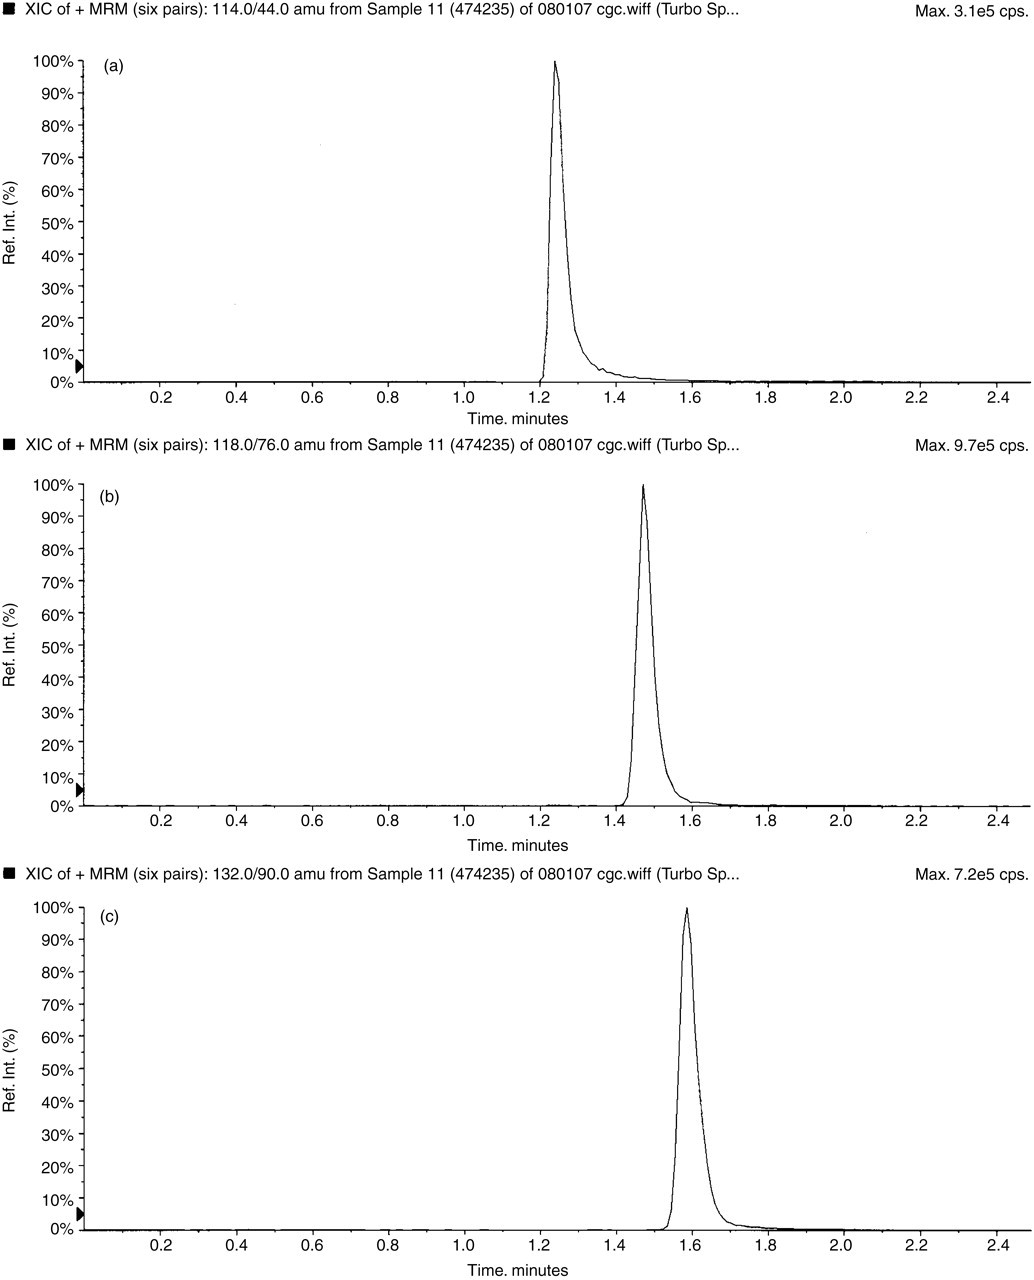
Typical chromatogram of a urine sample (a) creatinine, (b) guanidinoacetate and (c) creatine
All calibration curves were reproducible with %CV for the slopes of 3.5, 3.8 and 4.4 for creatinine, guanidinoacetate and creatine, respectively (n = 10). Correlation coefficients (r 2) of the curves were consistently >0.98 for all three analytes. The standard curves were linear to at least 5000 μmol/L for guanidinoacetate, and at least 25 mmol/L for creatine and creatinine.
Ion suppression experiments demonstrated that in plasma the main area of ion suppression occurs between 1.1 and 1.3 minutes, with no significant ion suppression occurring when the creatine and guanidinoacetate elute (Figure 3). In urine ion suppression experiments demonstrated that while creatine and guanidinoacetate were separated from the main area of ion suppression, creatinine partially co-eluted. However, sensitivity is not an issue with the analysis of creatinine and it was considered more important to maintain its separation from guanidinoacetate and creatine, which may be present in concentrations up to two orders of magnitude lower.
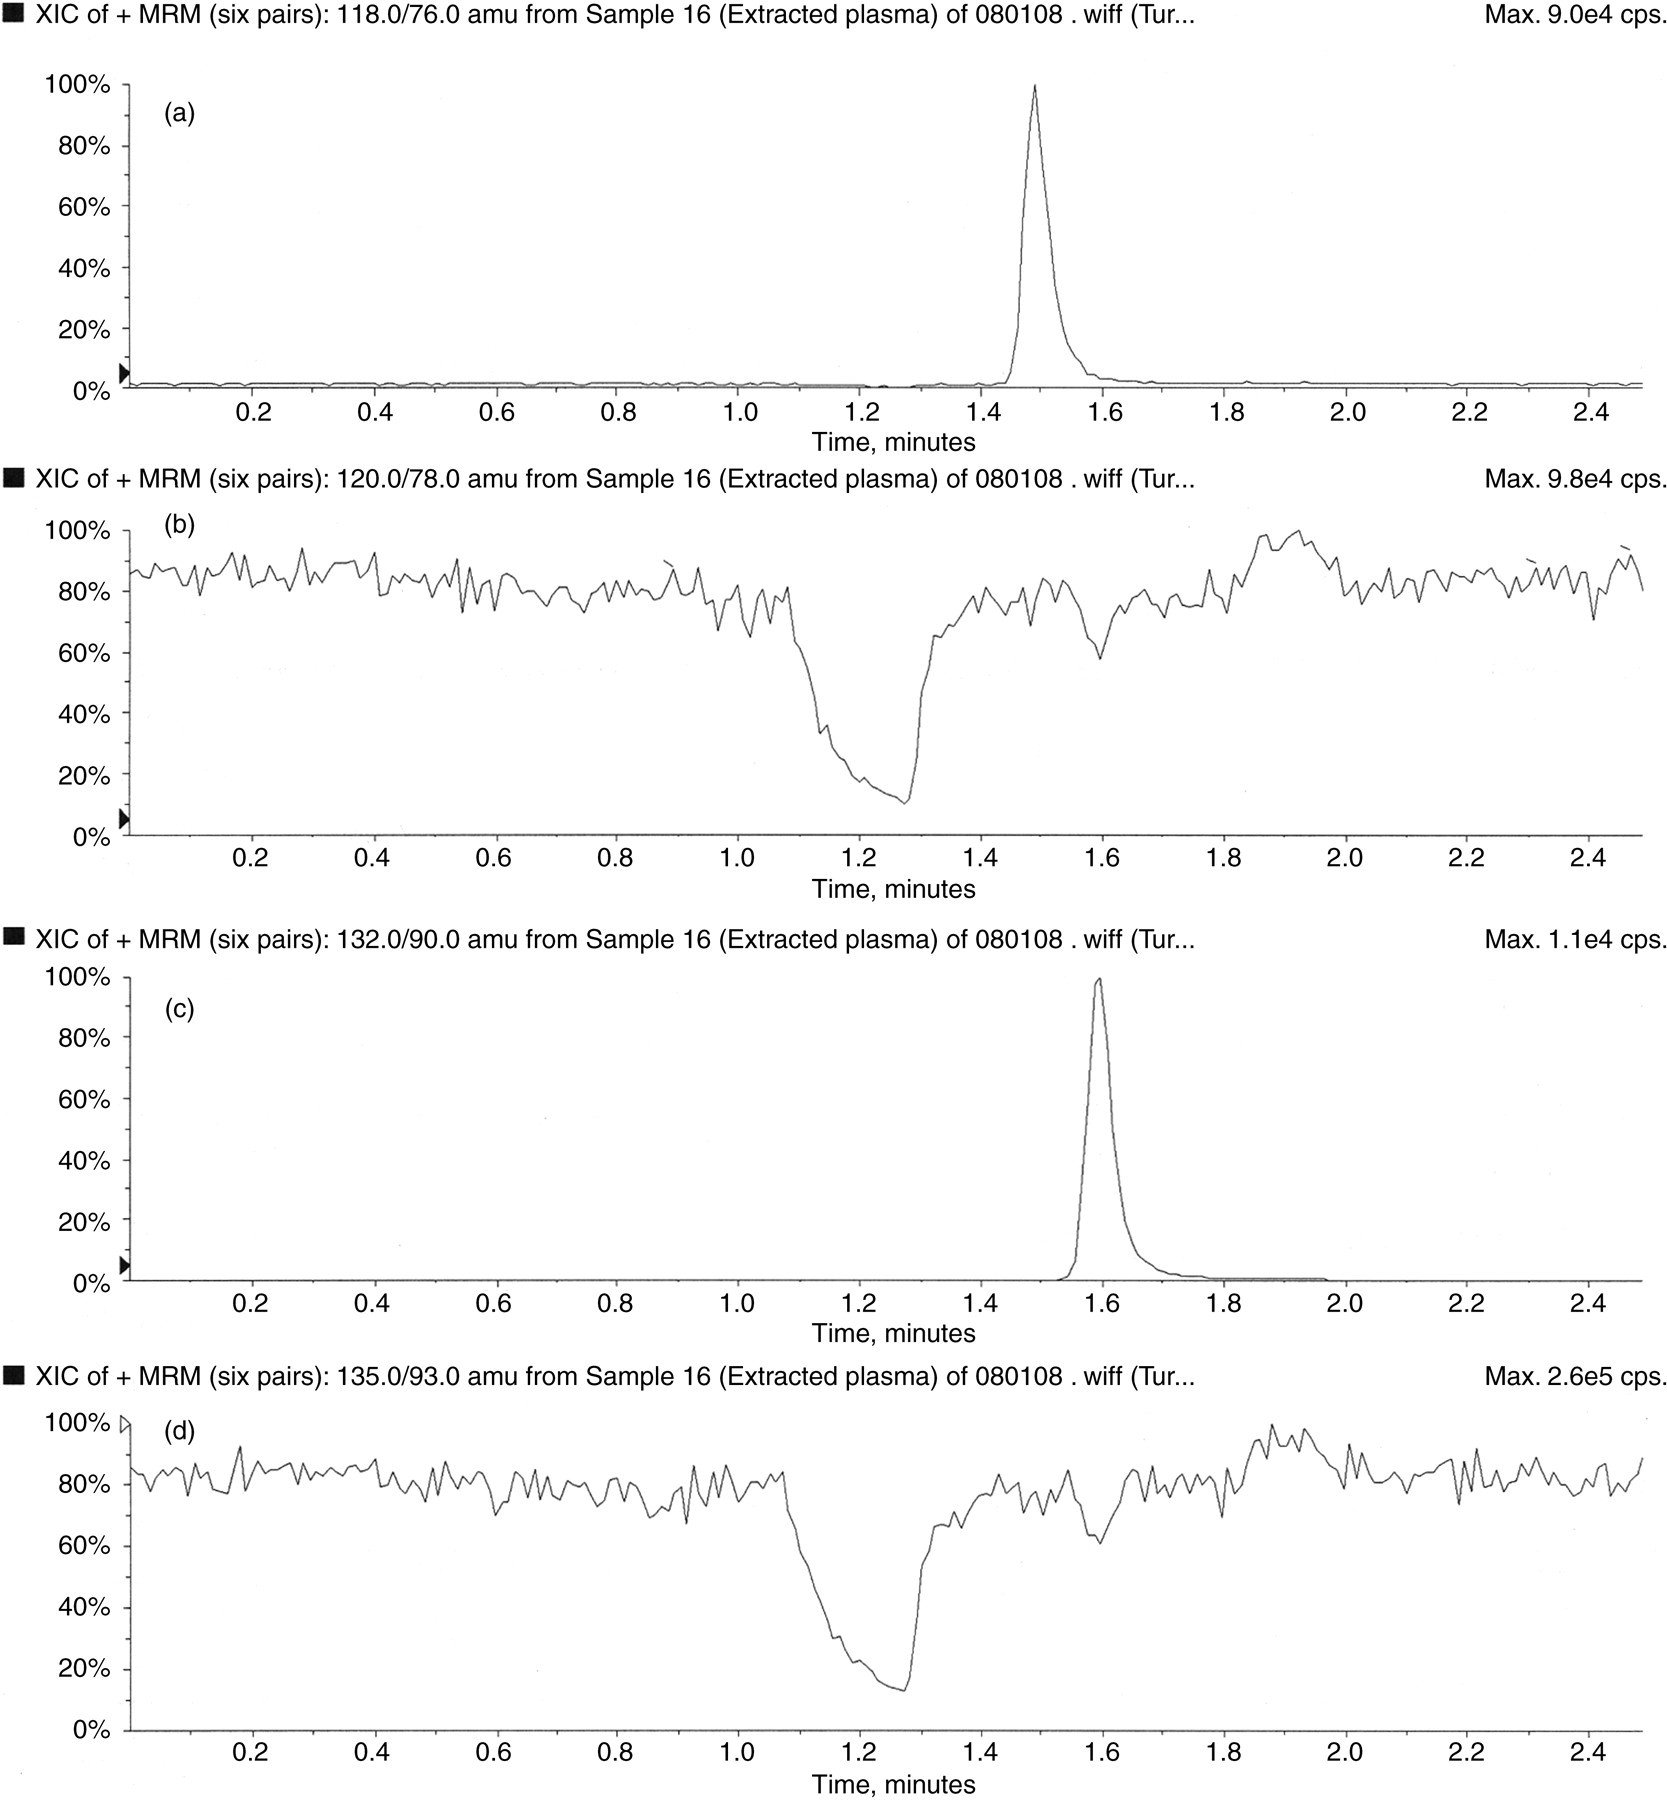
Ion suppression (a) represents the constant infusion of labelled guanidinoacetate, (b) represents the injection of an extracted plasma sample containing guanidinoacetate eluting away from the region of ion suppression, (c) represents the constant infusion of labelled creatine and (d) represents the injection of an extracted plasma sample containing creatine eluting away from the region of ion suppression
Intra- and inter-batch CV for the three analytes in plasma and urine are summarized in Tables 2 and 3. Acceptable precision was achieved at all concentrations, in both matrices.
Intra-batch precision (n = 10)
CV, coefficient of variation
Inter-batch precision (n = 10)
CV, coefficient of variation
The LOQ for creatine and guanidinoacetate was 0.4 μmol/L. At this concentration, creatine had a %CV = 10.1, bias < 20% and average signal-to-noise ratio = 48:1 while guanidinoacetate has %CV = 15.2, bias < 20% and average signal-to-noise ratio = 18:1. The LOQ for creatinine was 0.8 μmol/L. At this concentration creatinine had a %CV = 15.6, bias < 20% and average signal-to-noise ratio = 13:1. The LOD for creatine and guanidinoacetate was 0.1 μmol/L and for creatinine it was 0.4 μmol/L.
In plasma, the mean recoveries for guanidinoacetate and creatine were 99.9% (range 89.4–107.2) and 101.6% (range 89.8–104.6), respectively. In urine, the mean recoveries for guanidinoacetate, creatine and creatinine were 98.5% (range 93.7–106.0), 89.4% (range 85.5–96.3) and 87.7% (range 82.5–90.8), respectively.
F tests demonstrated that creatinine and guanidinoacetate were stable in urine for up to 12 hours at room temperature. For creatinine, the average variation was 2.2% (range 1.0–4.2) and for guanidinoacetate the average variation was 2.5% (range 1.7–4.1). However, at room temperature urinary creatine was found to be unstable exhibiting an average increase of 27.1% over 12 hours (range 3.4–66.5, n = 6) as shown in Figure 4. F tests showed the increases in creatine to be significant in four of the six samples (P < 0.05) and they also demonstrated that although creatinine and guanidinoacetate were stable in urine for up to seven freeze thaw cycles, creatine was not. The %CVs for the seven cycles were 3.9 and 2.7 for creatinine and guanidinoacetate, respectively, whereas creatine had increased by 22.4% after only two freeze thaw cycles and by 152.4% after seven cycles which was significant (P < 0.05).
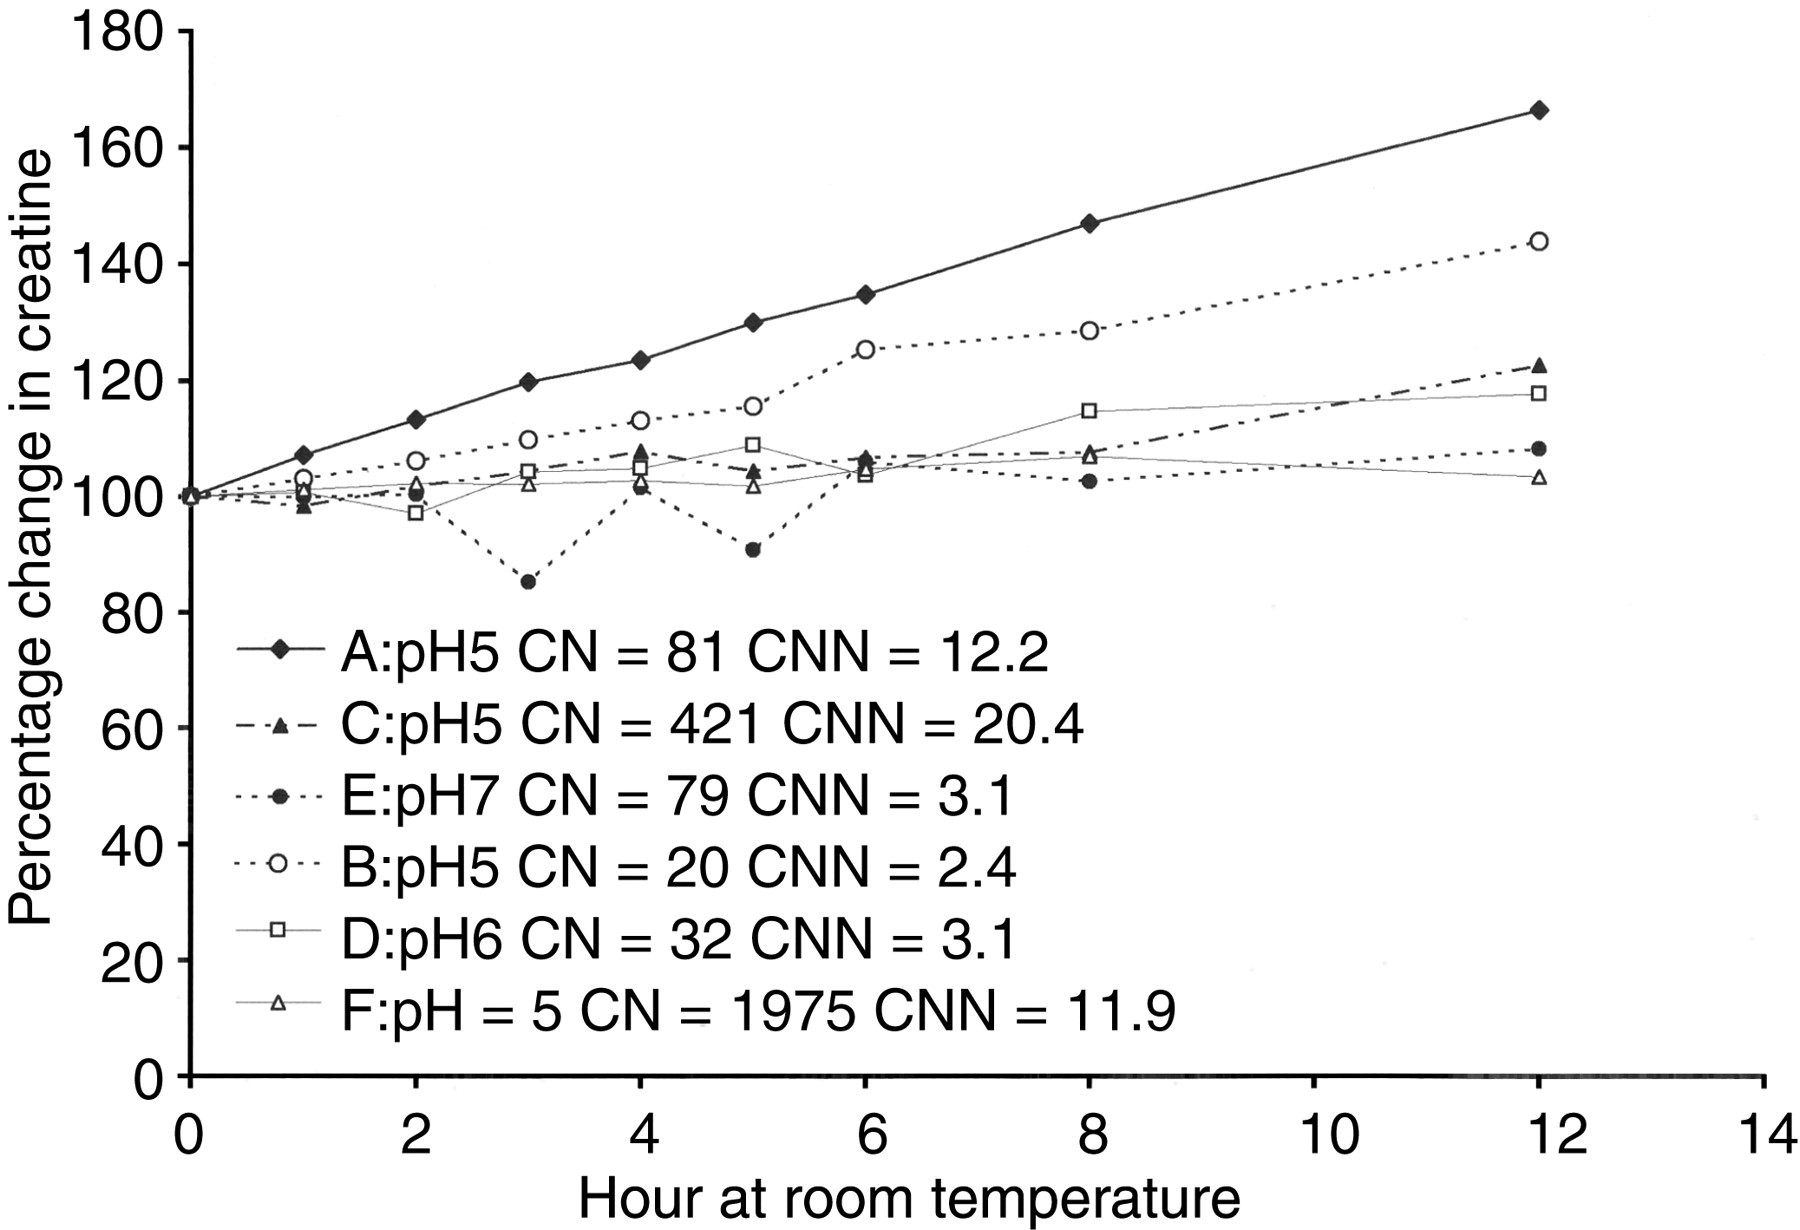
Increase in concentration of urinary creatine with time when stored at room temperature (n = 6). CN, creatine (μmol/L); CNN, creatinine (mmol/L)
F tests demonstrated that guanidinoacetate and creatine were stable in plasma and serum for at least 24 hours at room temperature. For creatine, the average variation was 2.9% (range 2.2–3.5) and 4.6% (range 3.0–7.5) for plasma and serum, respectively. For guanidinoacetate, the average variation was 7.0% (range 3.8–10.0), and 4.5% (range 2.6–9.2) for plasma and serum, respectively. Likewise, F tests showed that both analytes were stable in whole blood for at least six hours showing average variations of 2.8% (range 0.8–4.8) and 3.7% (range 2.8–4.6) for creatine and guanidinoacetate, respectively.
For both plasma and urine, all analytes were within standard deviation (2SD) of the ERNDIM ALTM (n = 10), as shown in Figure 5. In urine, the average SDs from the ERNDIM mean were 0.20, 0.05 and −0.07 for creatinine, guanidinoacetate and creatine, respectively. In plasma, the average SDs from the ERNDIM mean were 0.23 and 0.97 for guanidinoacetate and creatine, respectively.
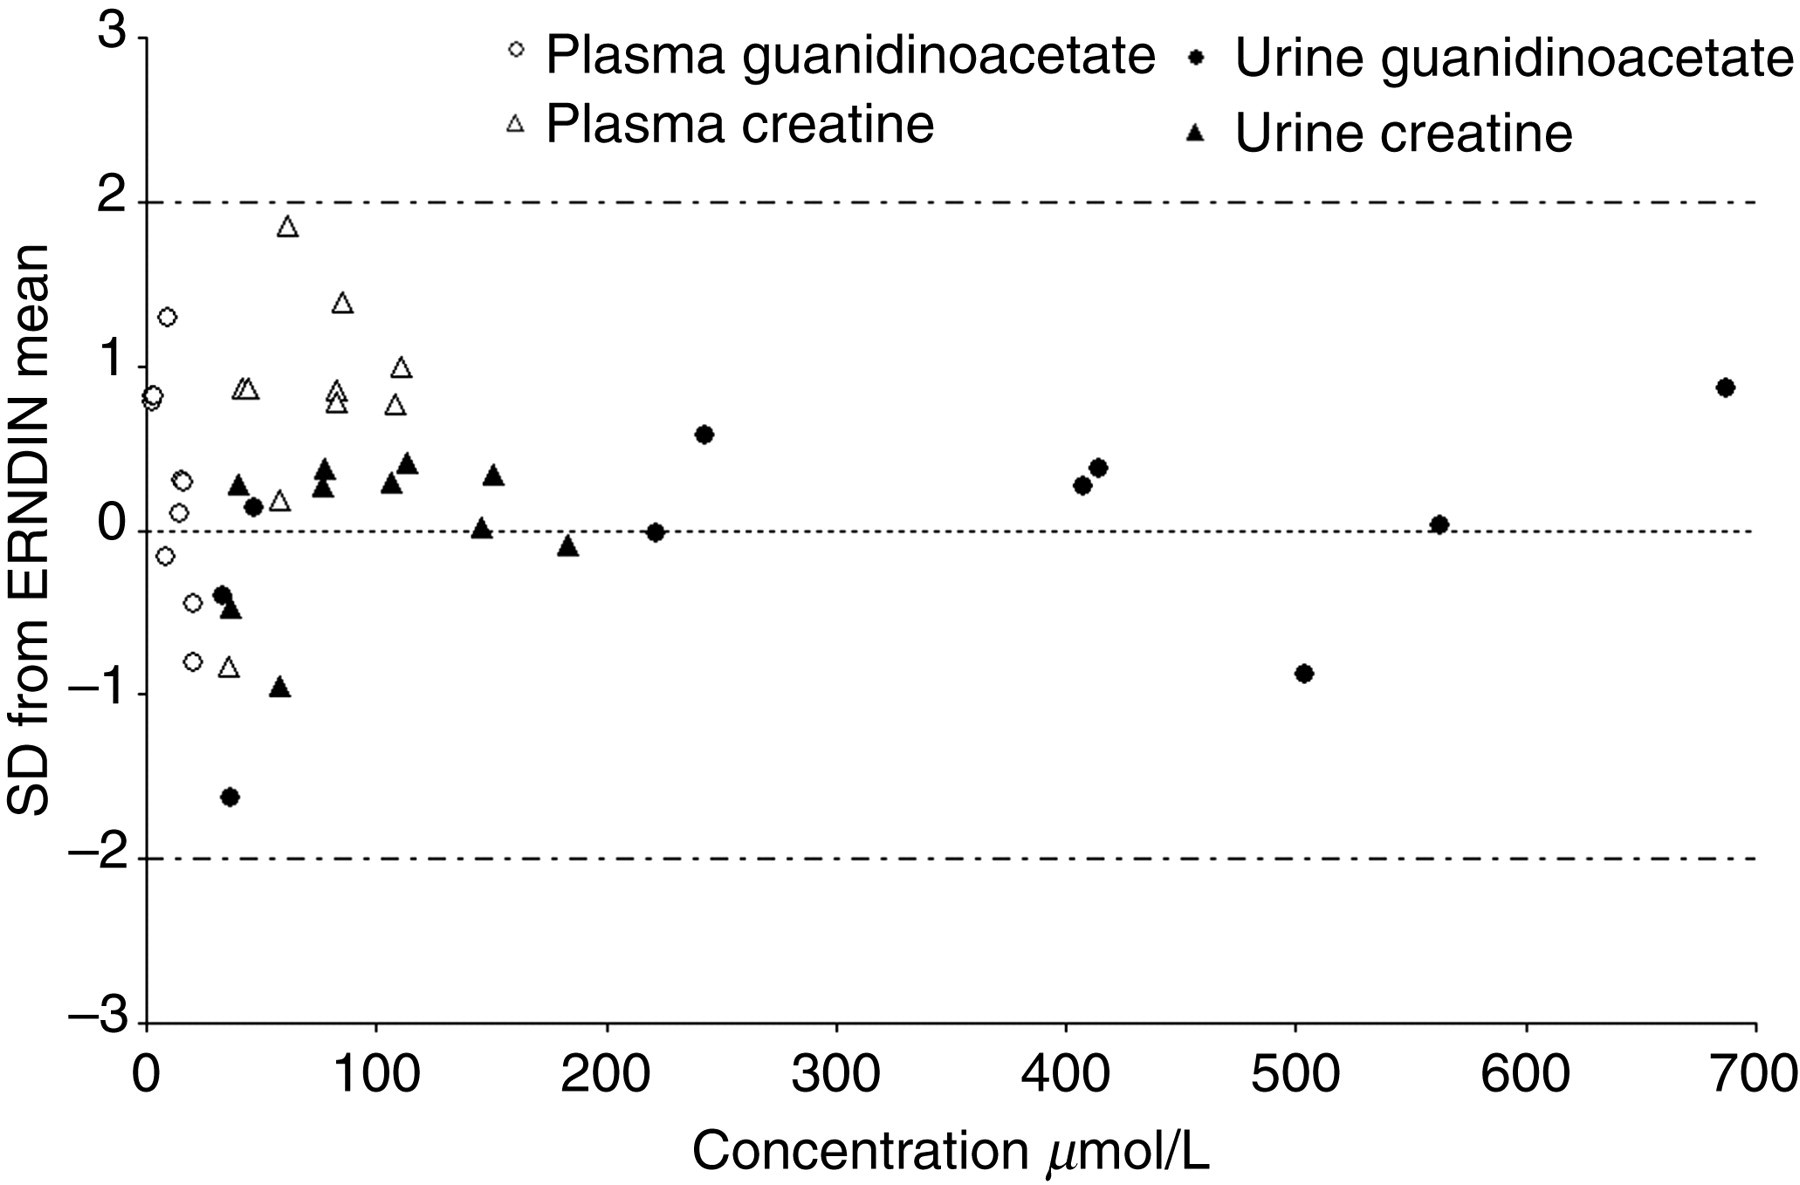
Average standard deviation from the European Research Network Inherited Disorders of Metabolism all-laboratory trimmed mean for creatine and guanidinoacetate in plasma and urine
Bland–Altman plots for the results of the correlation studies with established GCMS and LC-MSMS methods are shown in Figures 6– 9 and demonstrate reasonable agreement for each analyte in both urine and plasma. The correlation coefficient, regression equations and mean bias for the GCMS comparison were y = 0.9867x – 35.786 (r 2 = 0.9869), −56 μmol/L for urinary creatine, y = 0.9205x + 15.711 (r 2 = 0.9890), −9 μmol/L for urinary guanidinoacetate, y = 0.9769x – 1.8858 (r 2 = 0.9690), −4 μmol/L for plasma creatine and y = 0.9318x + 0.4779 (r 2 = 0.9604), 0.4 μmol/L for plasma guanidinoacetate. The correlation coefficient, regression equations and mean bias for the LC-MSMS comparison were y = 0.9575x + 135.2 (r 2 = 0.9893), 58 μmol/L for creatine, y = 0.9325x + 9.5127 (r 2 = 0.9793), −17 μmol/L for guanidinoacetate and y = 0.8616x + 408.4 (r 2 = 0.9624), 0.5 mmol/L for creatinine.
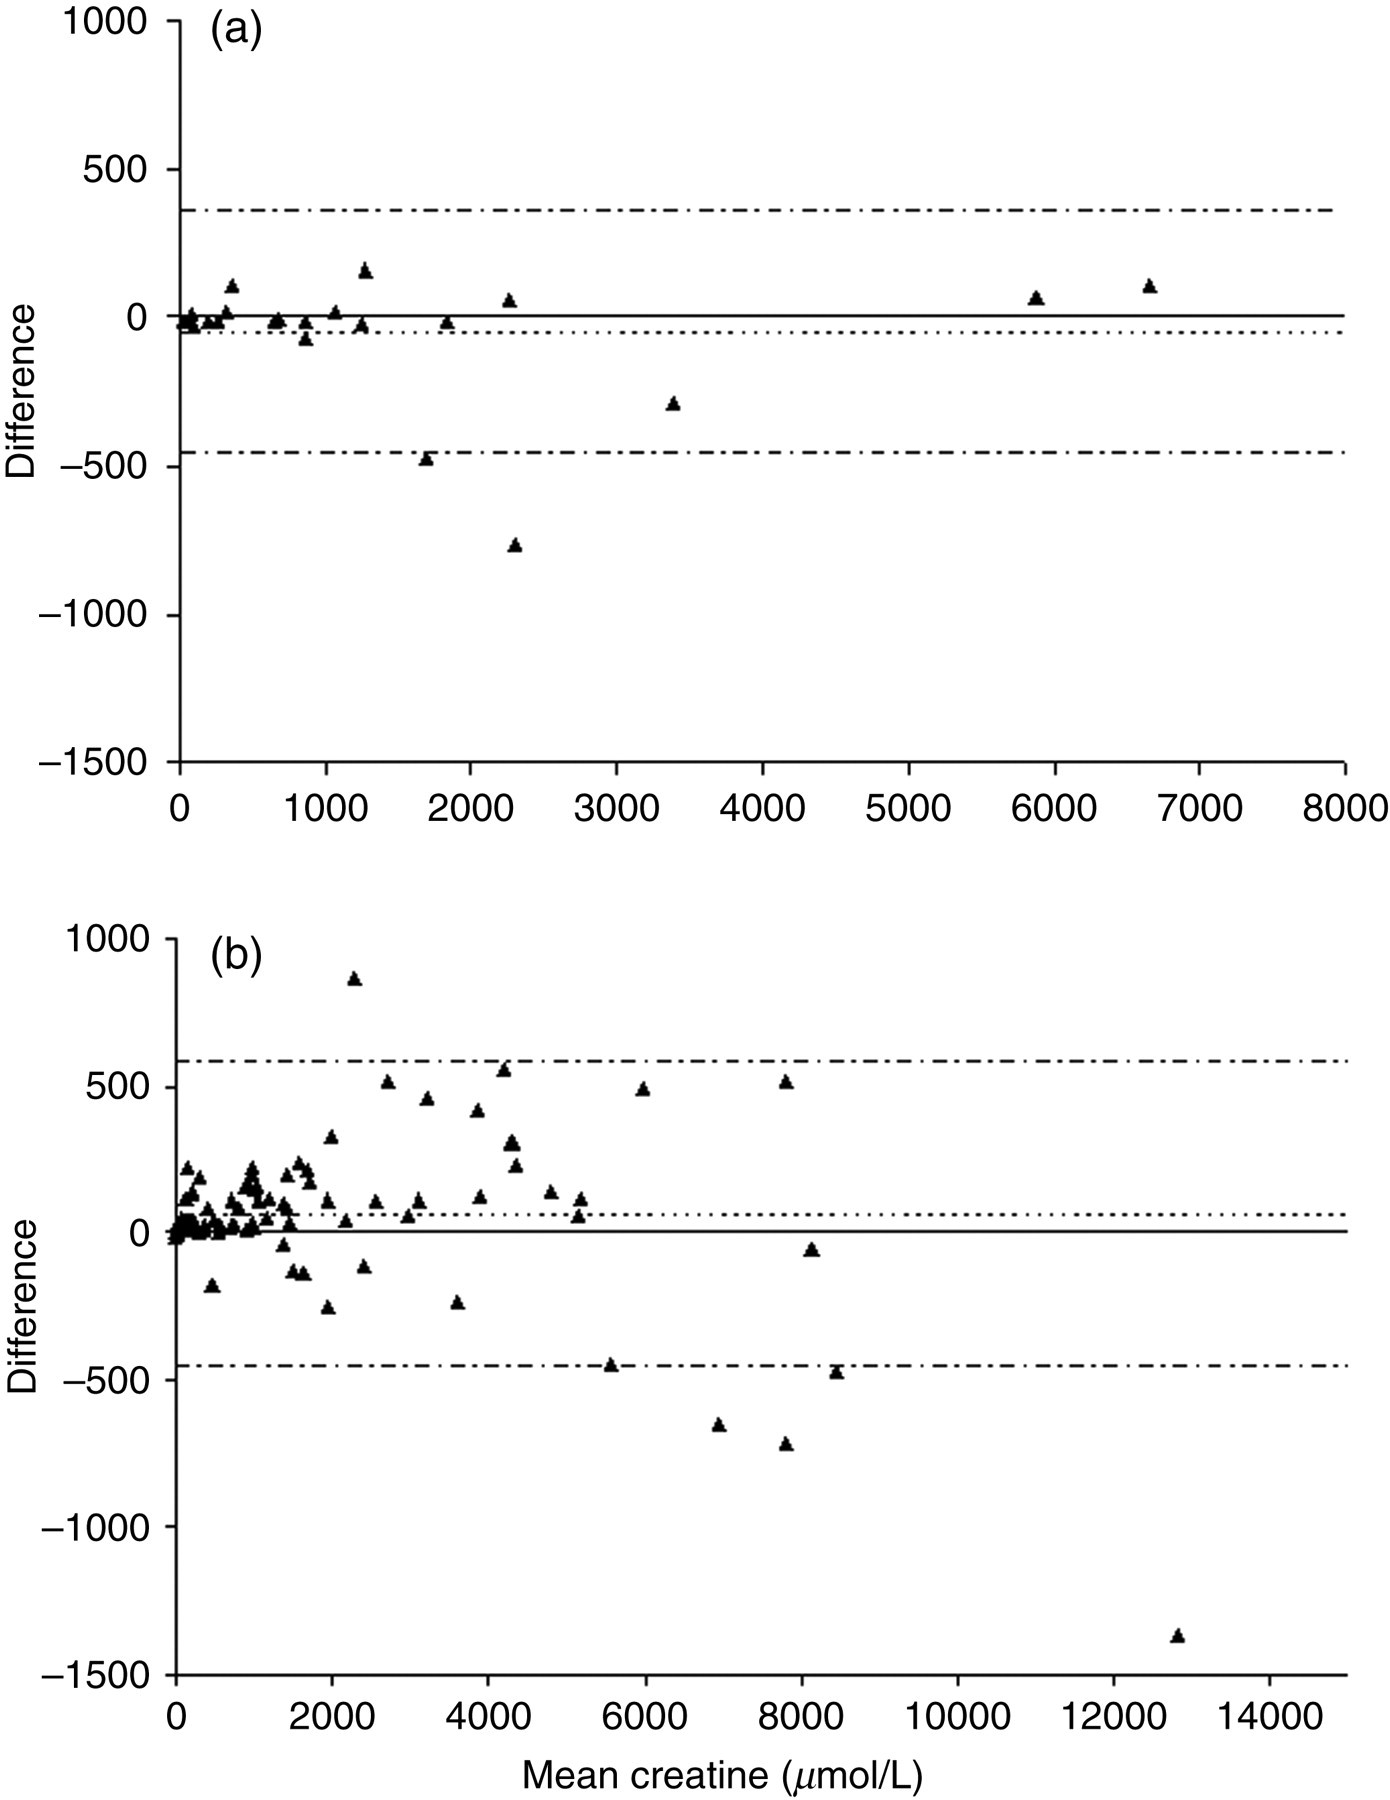
Bland–Altman plot for urinary creatine (a) represents the comparison with the gas chromatography-mass spectrometry method while (b) represents the comparison with the liquid chromatography-tandem mass spectrometry method
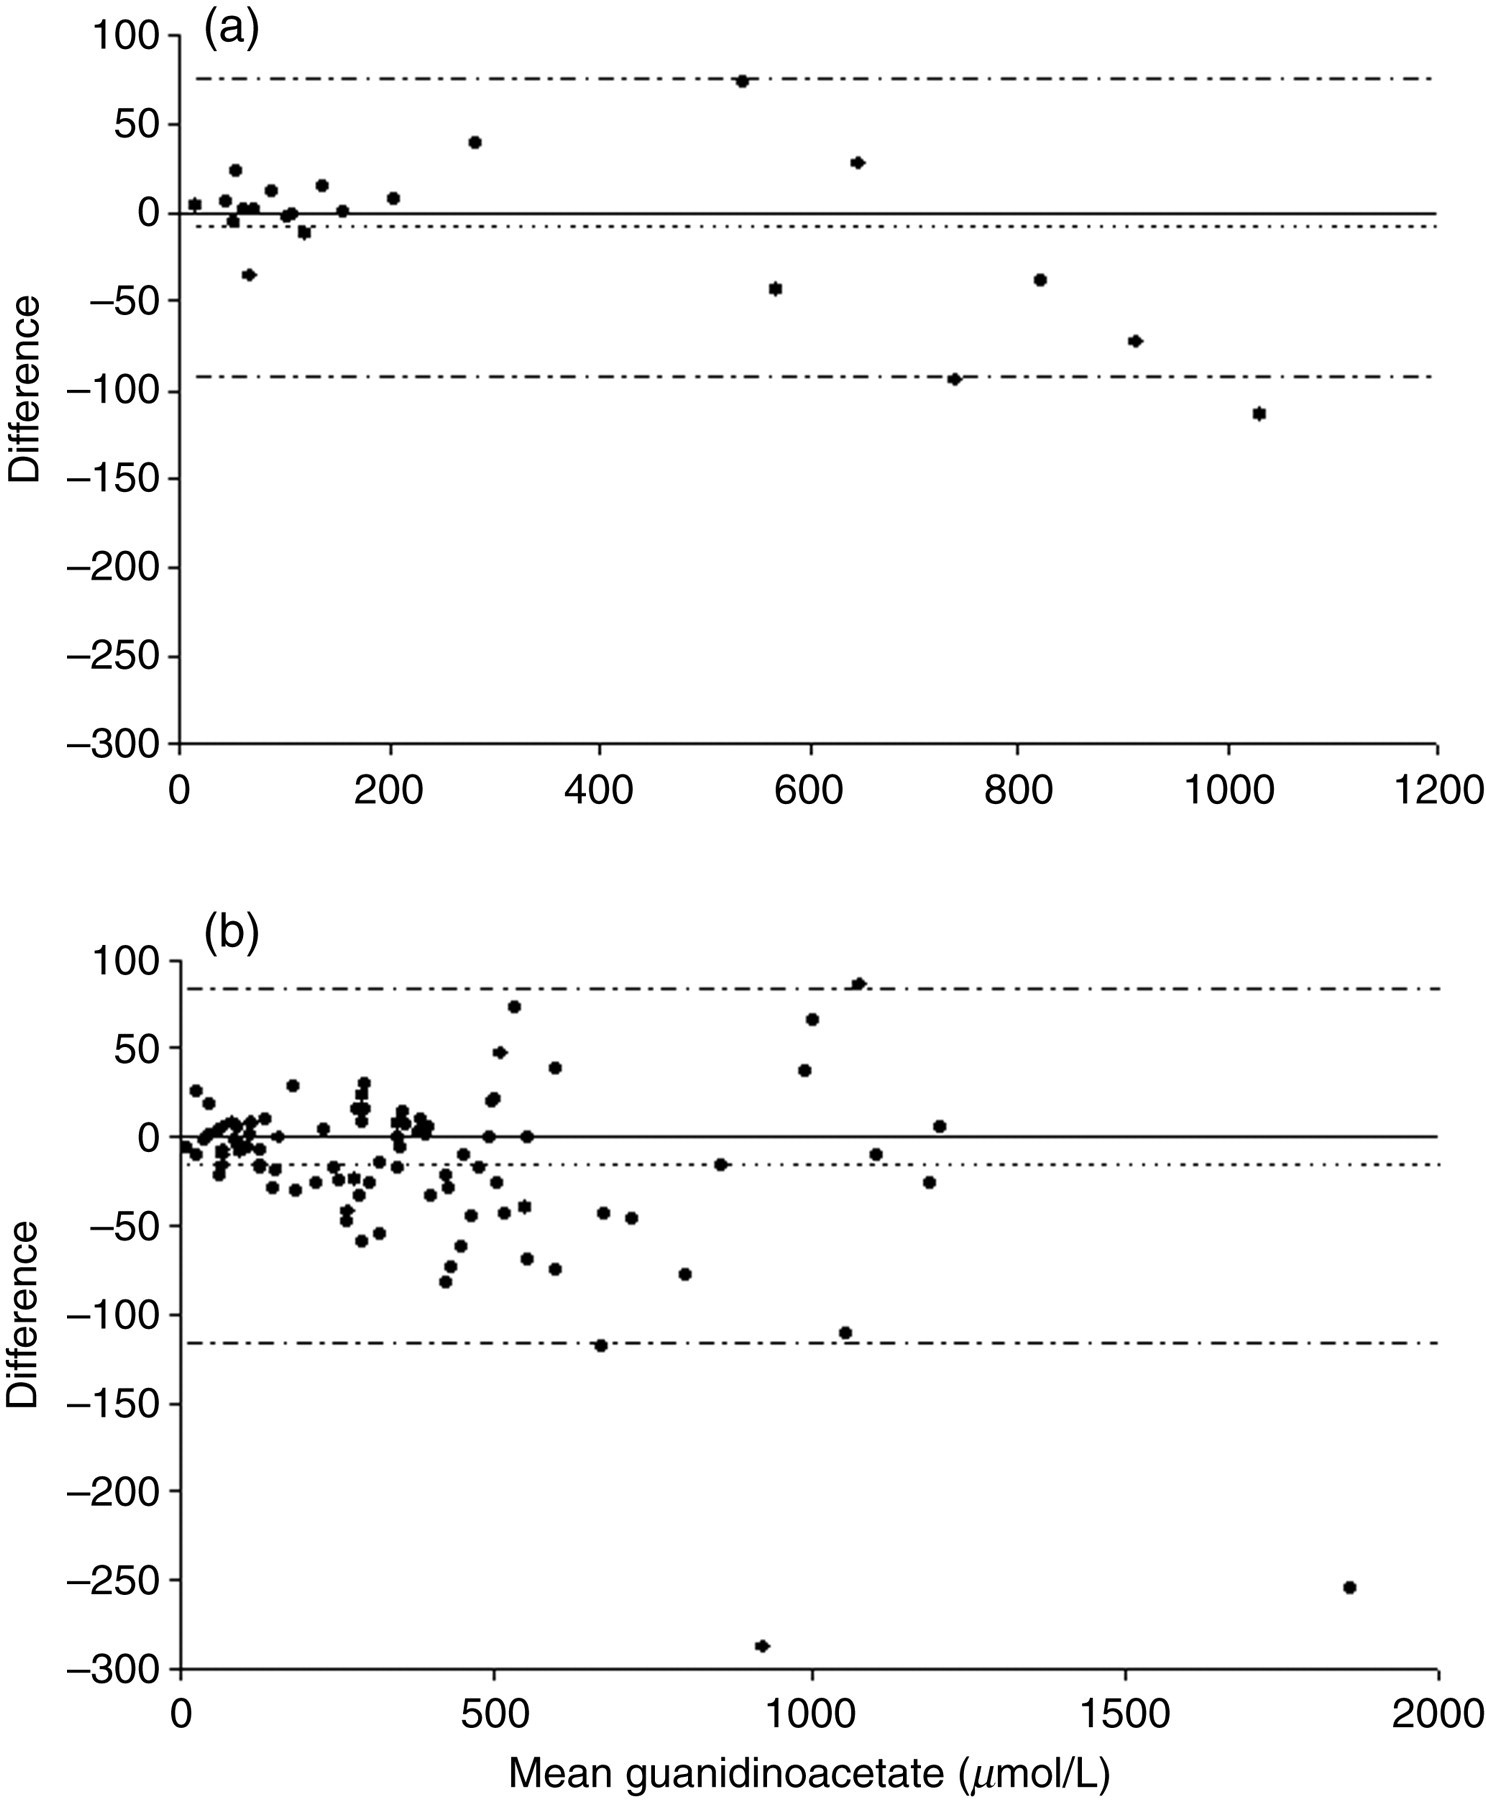
Bland–Altman plot for urinary guanidinoacetate (a) represents the comparison with the gas chromatography-mass spectrometry method while (b) represents the comparison with the liquid chromatography-tandem mass spectrometry method
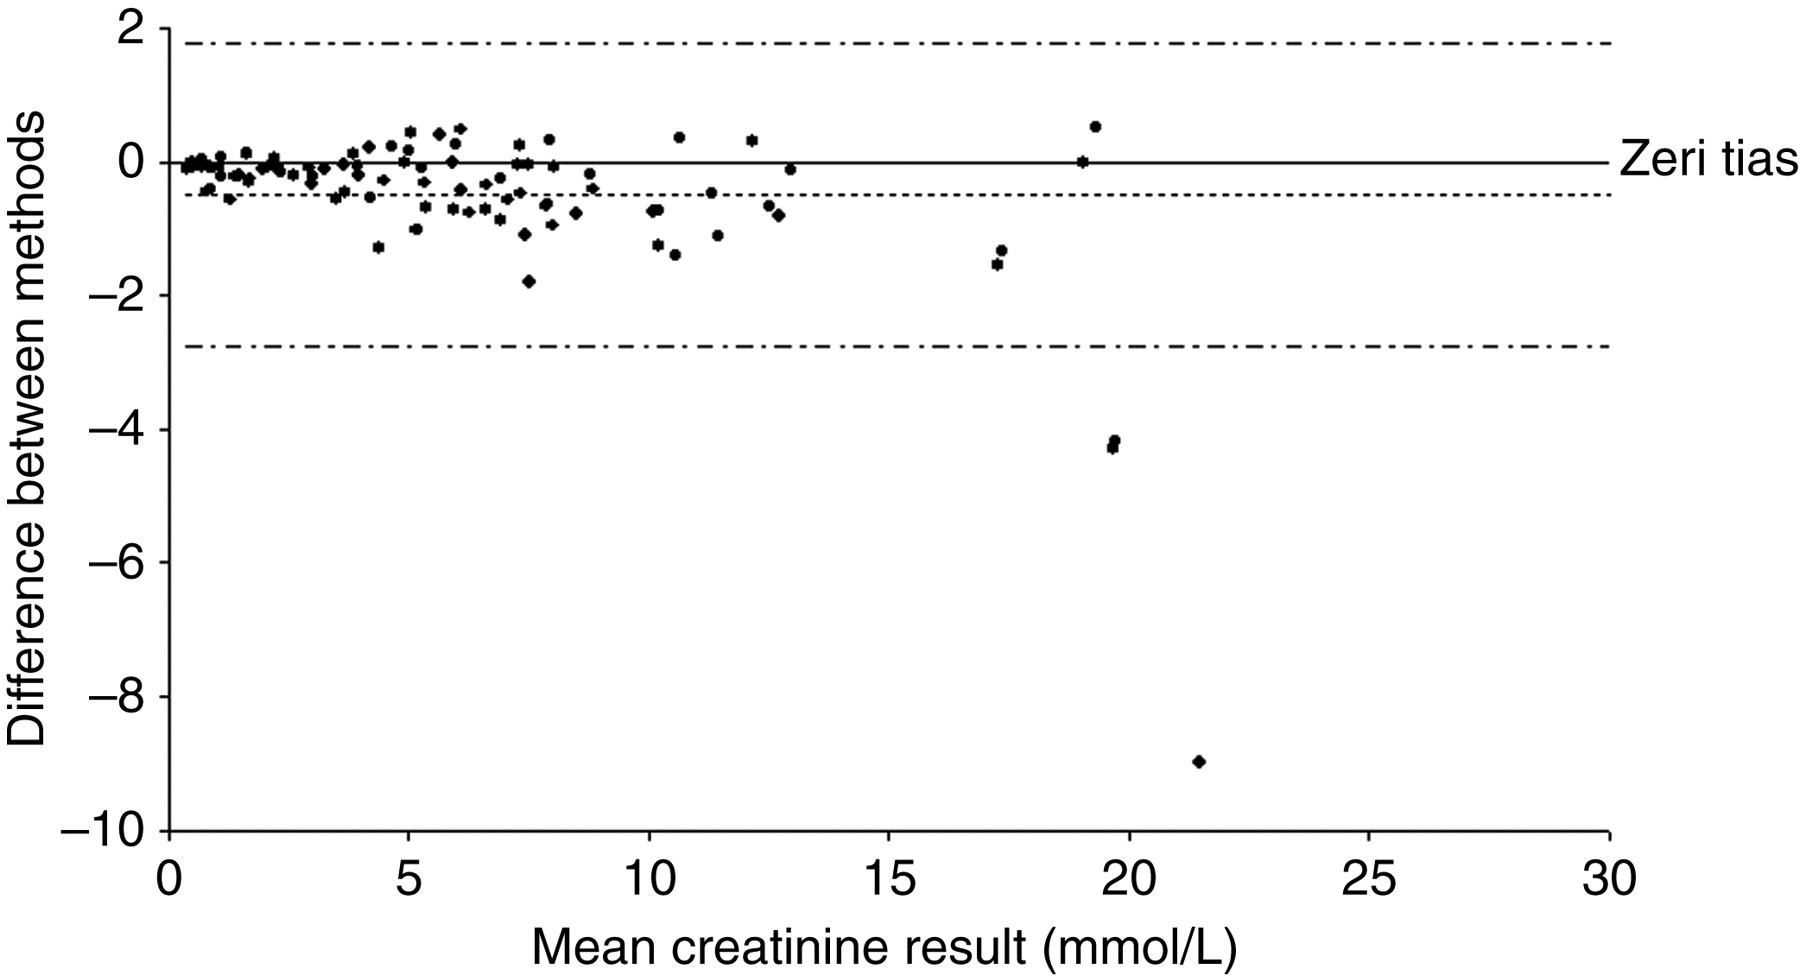
Bland–Altman plot for the comparison of urinary creatinine with the liquid chromatography-tandem mass spectrometry method
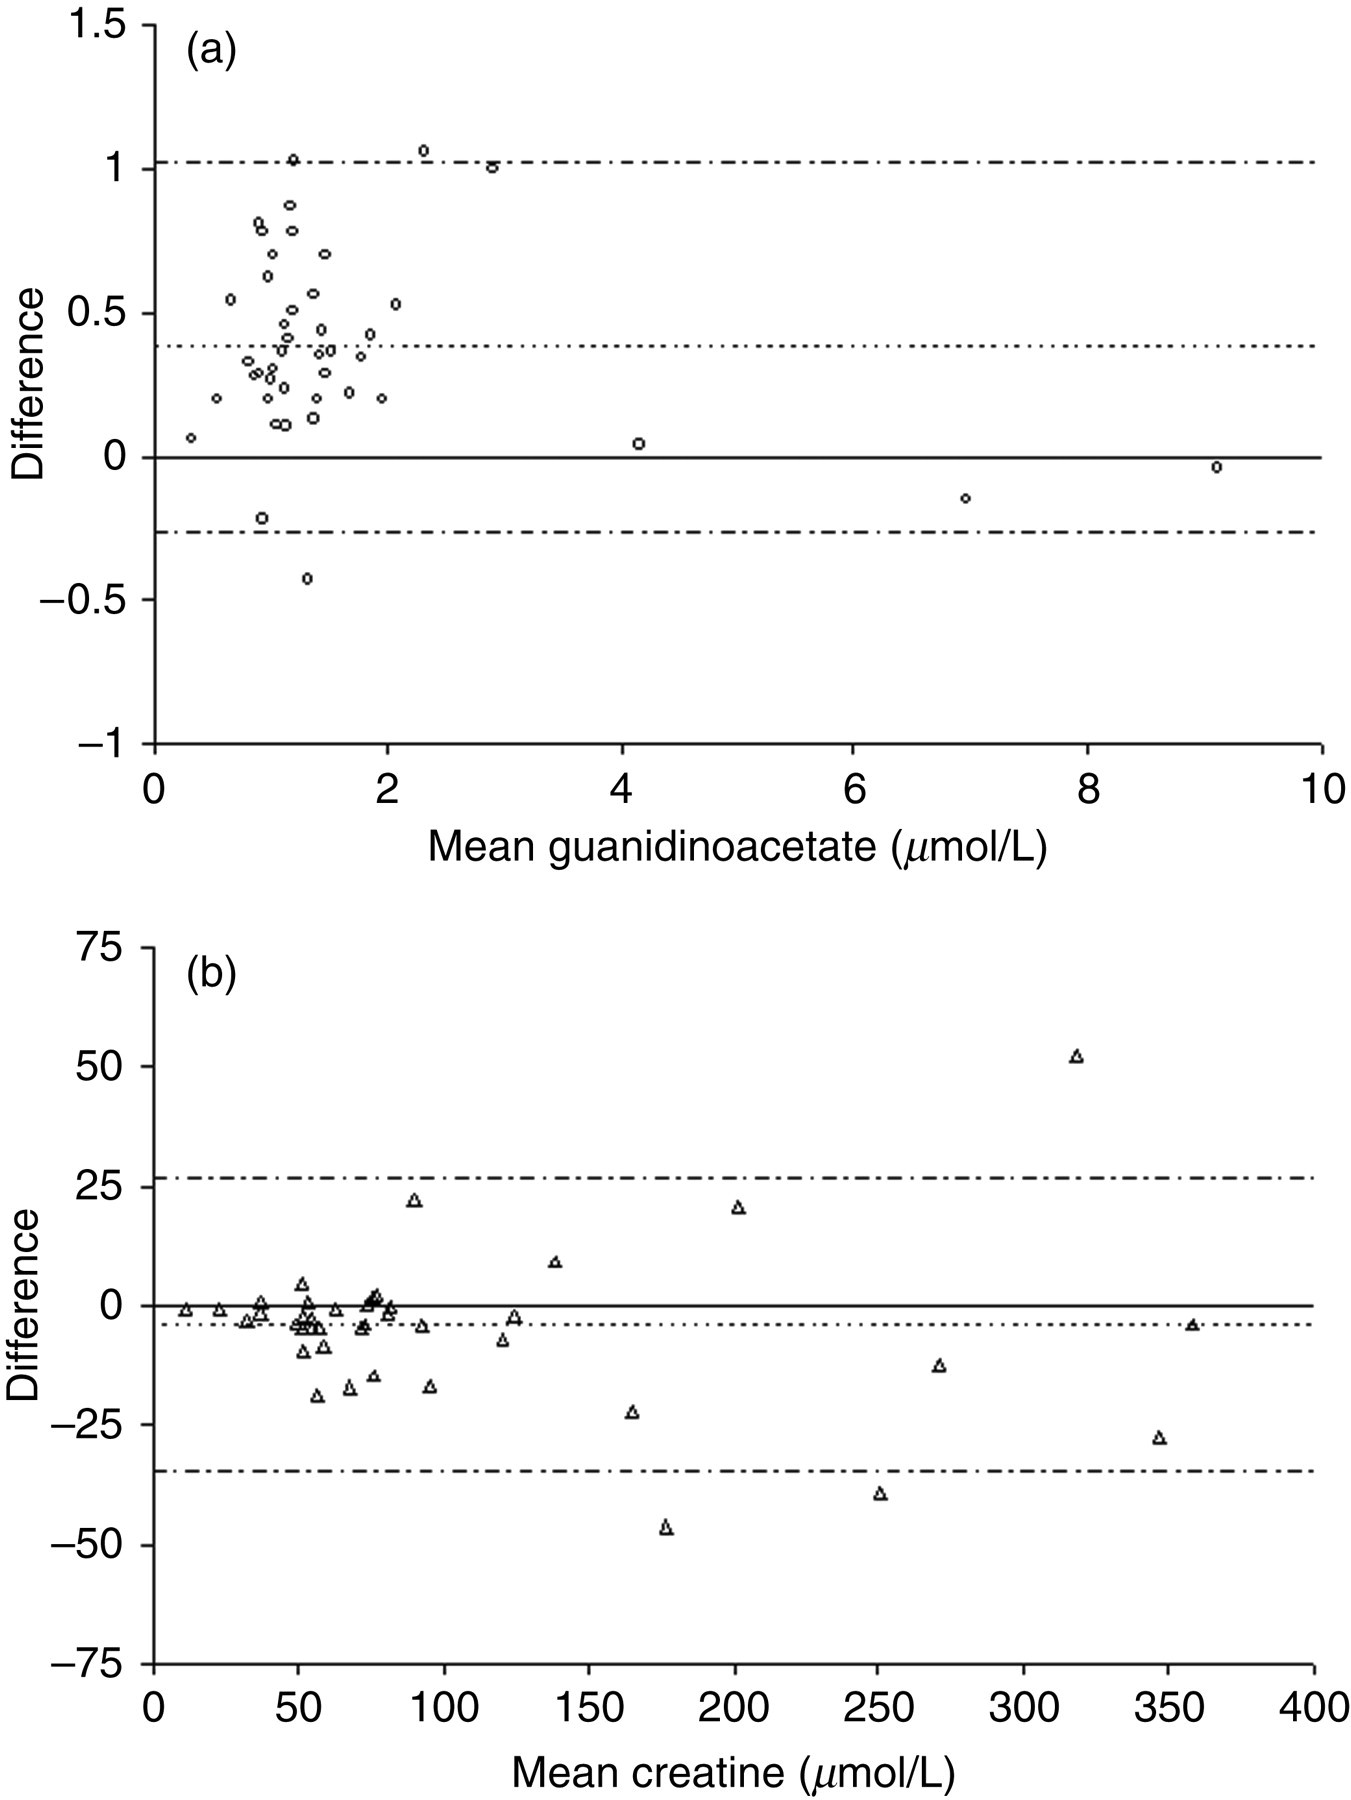
Bland–Altman plot for the comparison of (a) plasma guanidinoacetate and (b) plasma creatine with the gas chromatography-mass spectrometry method
Analysis of four samples from patients with confirmed CCDS demonstrated the ability of this method to differentiate them from controls. Urine from two patients with CRTR deficiency gave creatine:creatinine ratios of 1907 μmol/mmol and 5074 μmol/mmol (10 and two-year-old, respectively). Urine from a 20-year-old patient with GAMT deficiency gave a guanidinoacetate:creatinine ratio of 316 μmol/mmol and plasma from a 9-year-old GAMT deficient patient gave a concentration of 9.1 μmol/L. Age-related reference ranges determined by the Greenwood Genetics Center are shown in Table 4.
The Greenwood Genetics Centre age-related reference ranges for urine and plasma
Discussion
The stability studies showed that urinary creatinine and guanidinoacetate are stable for at least 12 hours at room temperature, whereas creatine is not. The behaviour exhibited by urinary creatine is inconsistent and does not appear to correlate with either urine pH or the concentration of creatine or creatinine. Of the six urine samples investigated (Figure 4) creatine remained stable in samples E and F, yet increased by 66.5% in sample A. It is possible that the increase in creatine is the result of simple chemical or enzymatic conversion of creatinine to creatine; although the creatinine appeared to be stable it is unlikely that we would detect micromolar changes in its concentration. Further work is required to elucidate the cause. Regardless of the explanation, the lack of stability of creatine means there is the potential to generate falsely increased creatine results if samples are not frozen promptly. In view of this, we recommend that all urine samples for analysis are frozen immediately after collection and transported on dry ice to the laboratory. A second urine sample is routinely requested on all positive results.
In the study by Arias et al. 16 investigating the prevalence of CRTR deficiency in a population of 1600 males with MR and/or autism, 29 false-positive creatine:creatinine ratios were obtained. The authors postulated that this was a dietary effect and subsequently investigated 13 adult volunteers, analysing urinary creatine:creatinine ratios in first morning urine samples collected after low protein (salad, pasta) and protein-rich (beef and oily fish) meals. While this appeared to show a protein-rich diet resulted in a creatine:creatinine ratio above the reference range (460 μmol/mmol) in four of the 13 volunteers, the paper did not indicate how promptly the urine samples were frozen so it is possible that the lack of stability of creatine also contributed to the false-positive rate.
The lack of stability of creatine may also bring into question the validity of existing reference ranges quoted in the literature. However, any discrepancies are almost certainly compounded by the relatively small numbers of subjects used to determine the reference ranges. Almeida et al. 33 reported the following age-related reference ranges for urinary creatine:creatinine ratios: <4 years: 6–1200 μmol/mmol, 4–12 years: 17–720 μmol/mmol and >12 years: 11–240 μmol/mmol. Although the total number of subjects is stated to be 140, the number in each age group is not specified and while the paper does state that the samples were stored frozen, it does not specify how promptly. Likewise, Valongo 34 determined age-related urinary creatine:creatinine reference ranges which are similar but perhaps somewhat broader: <4 years: 40–1510 μmol/mmol (n = 70), 5–11 years: 40–1070 μmol/mmol (n = 71) and 12–16 years: 40–560 μmol/mmol (n = 28), whereas Cognat 28 quotes a narrower reference range of 12–585 μmol/mmol, although this is based only on 47 subjects with an age range of 5–23 years. We are in the process of collecting reference range data but as yet have insufficient samples to produce age-related reference ranges, given the potential problem of stability. Preliminary data gives urine reference ranges (non-parametric, n = 152) of 5−1645 μmol/mmol for creatine and 9–175 μmol/mmol for guanidinoacetate and plasma reference ranges (non-parametric, n = 72) of 10–154 μmol/L for creatine and 0.7–3.9 μmol/L for guanidinoacetate. However, pending collection of sufficient in-house data, we have provisionally adopted the plasma and urine reference ranges determined by the Greenwood Genetics Centre (Table 4). For CSF the only available data is that of Almeida et al. 33 which is based only on 25 subjects: 0.02–0.56 μmol/L guanidinoacetate and 17–87 μmol/L creatine. Evidently, there is a need to establish further reference range data for urine, plasma and CSF, based on a greater number of subjects and with clearly defined preanalytical requirements.
Preliminary investigations of CSF guanidinoacetate have been performed using the LC-MSMS method described here with sample preparation identical to that of plasma. Ion suppression studies demonstrated that in CSF, guanidinoacetate elution is well removed from the region of ion suppression. Recovery experiments (n = 6) showed mean recoveries of 97.6% (range 77.0–112.4%). However, analysis of CSF guanidinoacetate lacked sensitivity at normal concentrations with intra- and inter-assay CVs of 17.7 and 20.1%, respectively (n = 10). While normal CSF contains negligible quantities of guanidinoacetate, 27 at the concentrations seen in GAMT deficiency, which are one to two orders of magnitude higher, the intra- and inter-assay CVs were <10% indicating that potentially the method can differentiate GAMT patients from controls.
The method described here is clearly capable of differentiating CRTR and GAMT patients from controls but the diagnostic sensitivity of this assay with respect to AGAT deficiency is not known. However, AGAT deficiency is extremely rare (four cases reported to date) and accounts for a very small minority of the known CCDS patients so we believe that the speed and simplicity of this method make it worthwhile for screening large numbers of patients for CRTR and GAMT deficiencies, for which it has adequate sensitivity.
In summary, we have developed and validated a rapid, simple and inexpensive LC-MSMS method for the determination of guanidinoacetate, creatine and creatinine in urine and plasma. Samples from the four patients with confirmed CCDS demonstrate the ability of this method to differentiate them from controls and the method comparisons, and ERNDIM results give us confidence in the accuracy of our results.
This method has the advantages of speed, simplicity, linearity and accuracy over a wide analytical range and has now been offered as a routine service for over a year.
Footnotes
ACKNOWLEDGEMENTS
We would like to acknowledge Cornelius Jakobs and Mirjam Wamelink, VU University Medical Center, Amsterdam for kindly providing samples for the comparison and Katherine Wright and Andrew Morris, Royal Liverpool Children’s NHS Trust for kindly providing one of the patient samples.