
Abstract
We read with interest the recently published article from Ricos et al. 1 The study systematically reviewed for the first time the important issue of the biological variation of laboratory tests drawn from patients and the differences toward the commonly available data obtained from healthy subjects. The authors collated a considerable amount of data and provided an important starting point for following investigations. We concord with the author's conclusions, in particular with regard to the statement that the biological variation of the most commonly used tumour markers shows significant differences if evaluated from healthy subjects or from patients.
In the framework of a study about tumour markers biological variation, we produced data also for CEA and CA 15.3. The study details were previously described. 2 Briefly, venous blood was obtained from 12 healthy female and 10 male subjects (only the 12 female subjects for CA15.3) once a month for four months (five specimens per subject), stored at −80°C and assayed on automatic platform ADVIA Centaur (Siemens Medical Solutions Diagnostics). In parallel, we selected 21 patients from a prospective study about the decision criteria of tumour markers in the follow-up of breast cancer, 3 in which six specimens for six month, (one specimen per month) were obtained, and that subsequently showed no evidence of disease for at least three years of follow-up.
Both the group of data were analysed with the nested ANOVA, and evaluated for possible outliers. 4
The results (Table 1) confirmed the data collected from Ricos et al. with within-subjects biological variation from healthy subjects in accord with the literature and the corresponding data from patients about 2.5 time higher. It is worth noting that the different variability should not be due to different monitoring period, since both the studies are comparable from this point of view.
Biological variation of CEA and CA 15.3 in both healthy and pathological subjects
%CV denotes % coefficient of variation
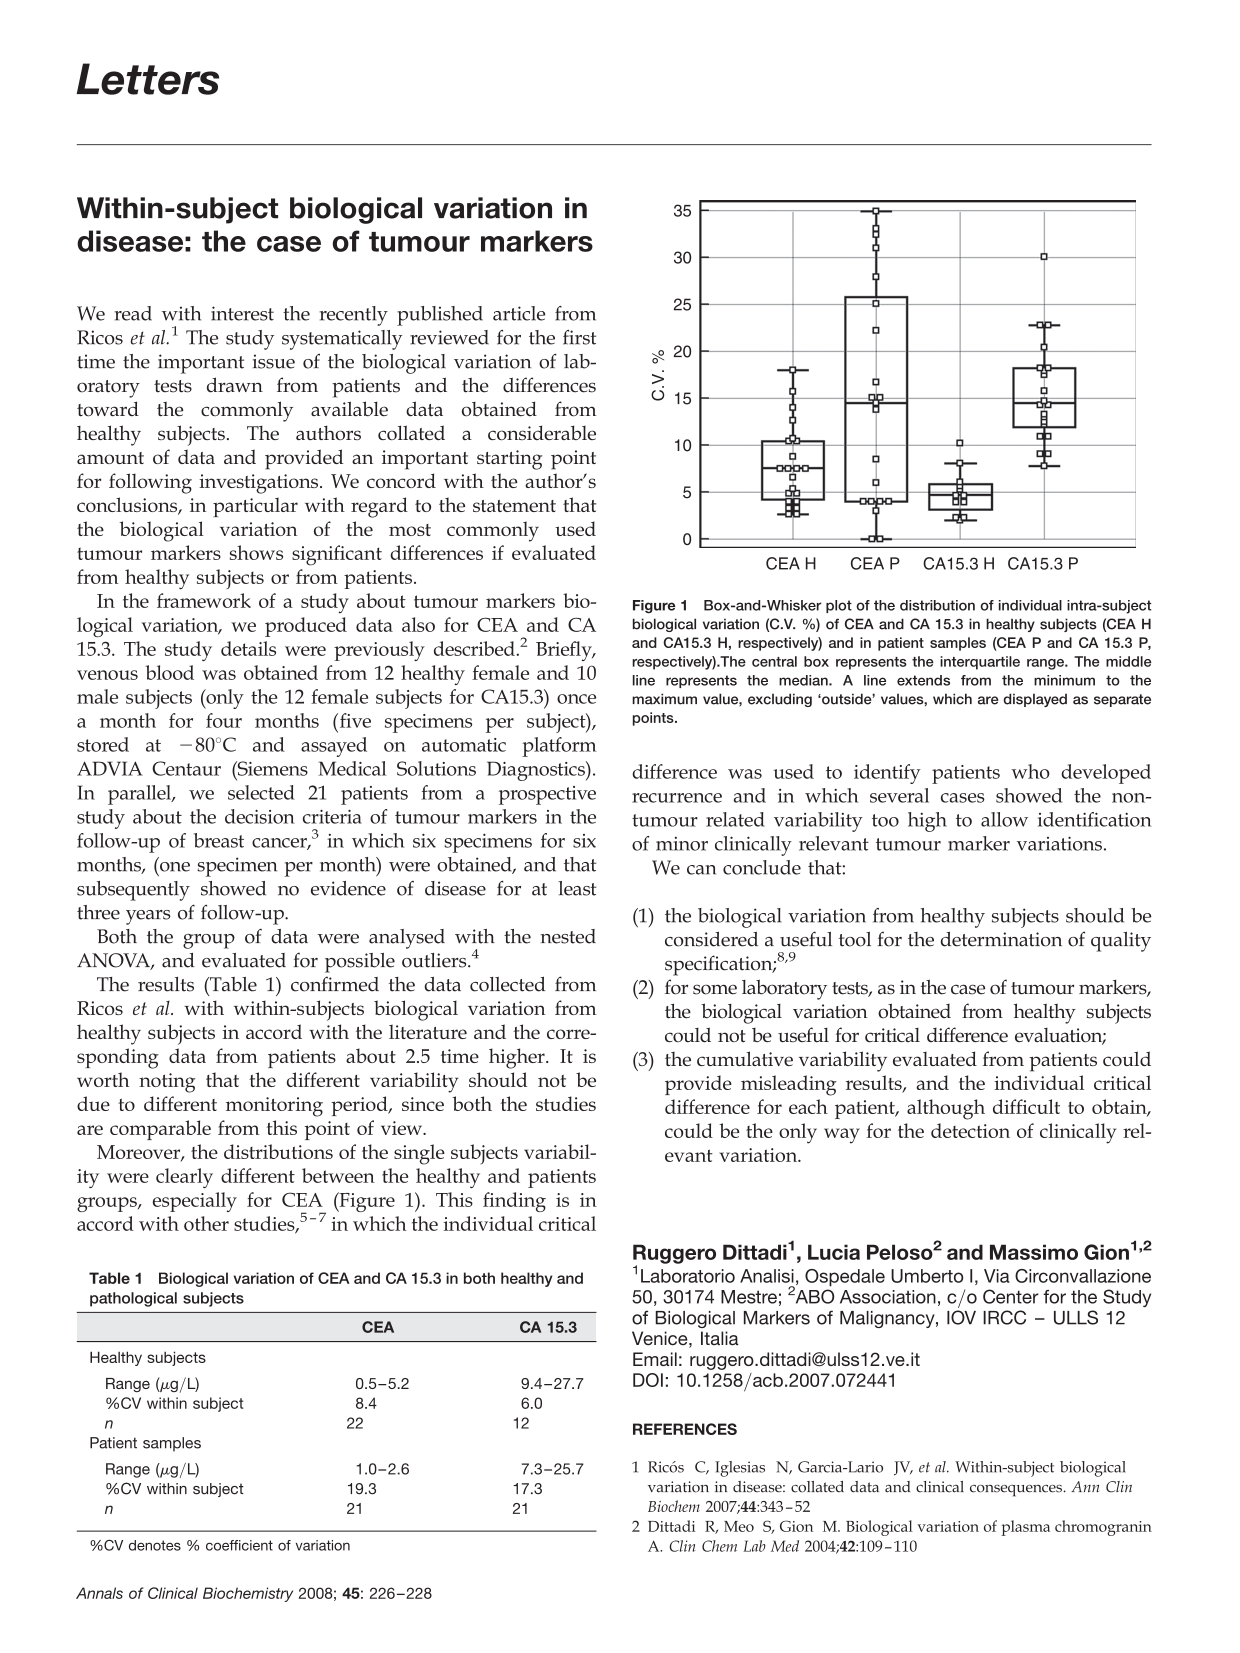
Moreover, the distributions of the single subjects variability were clearly different between the healthy and patients groups, especially for CEA (Figure 1). This finding is in accord with other studies, 5–7 in which the individual critical difference was used to identify patients who developed recurrence and in which several cases showed the non-tumour related variability too high to allow identification of minor clinically relevant tumour marker variations.
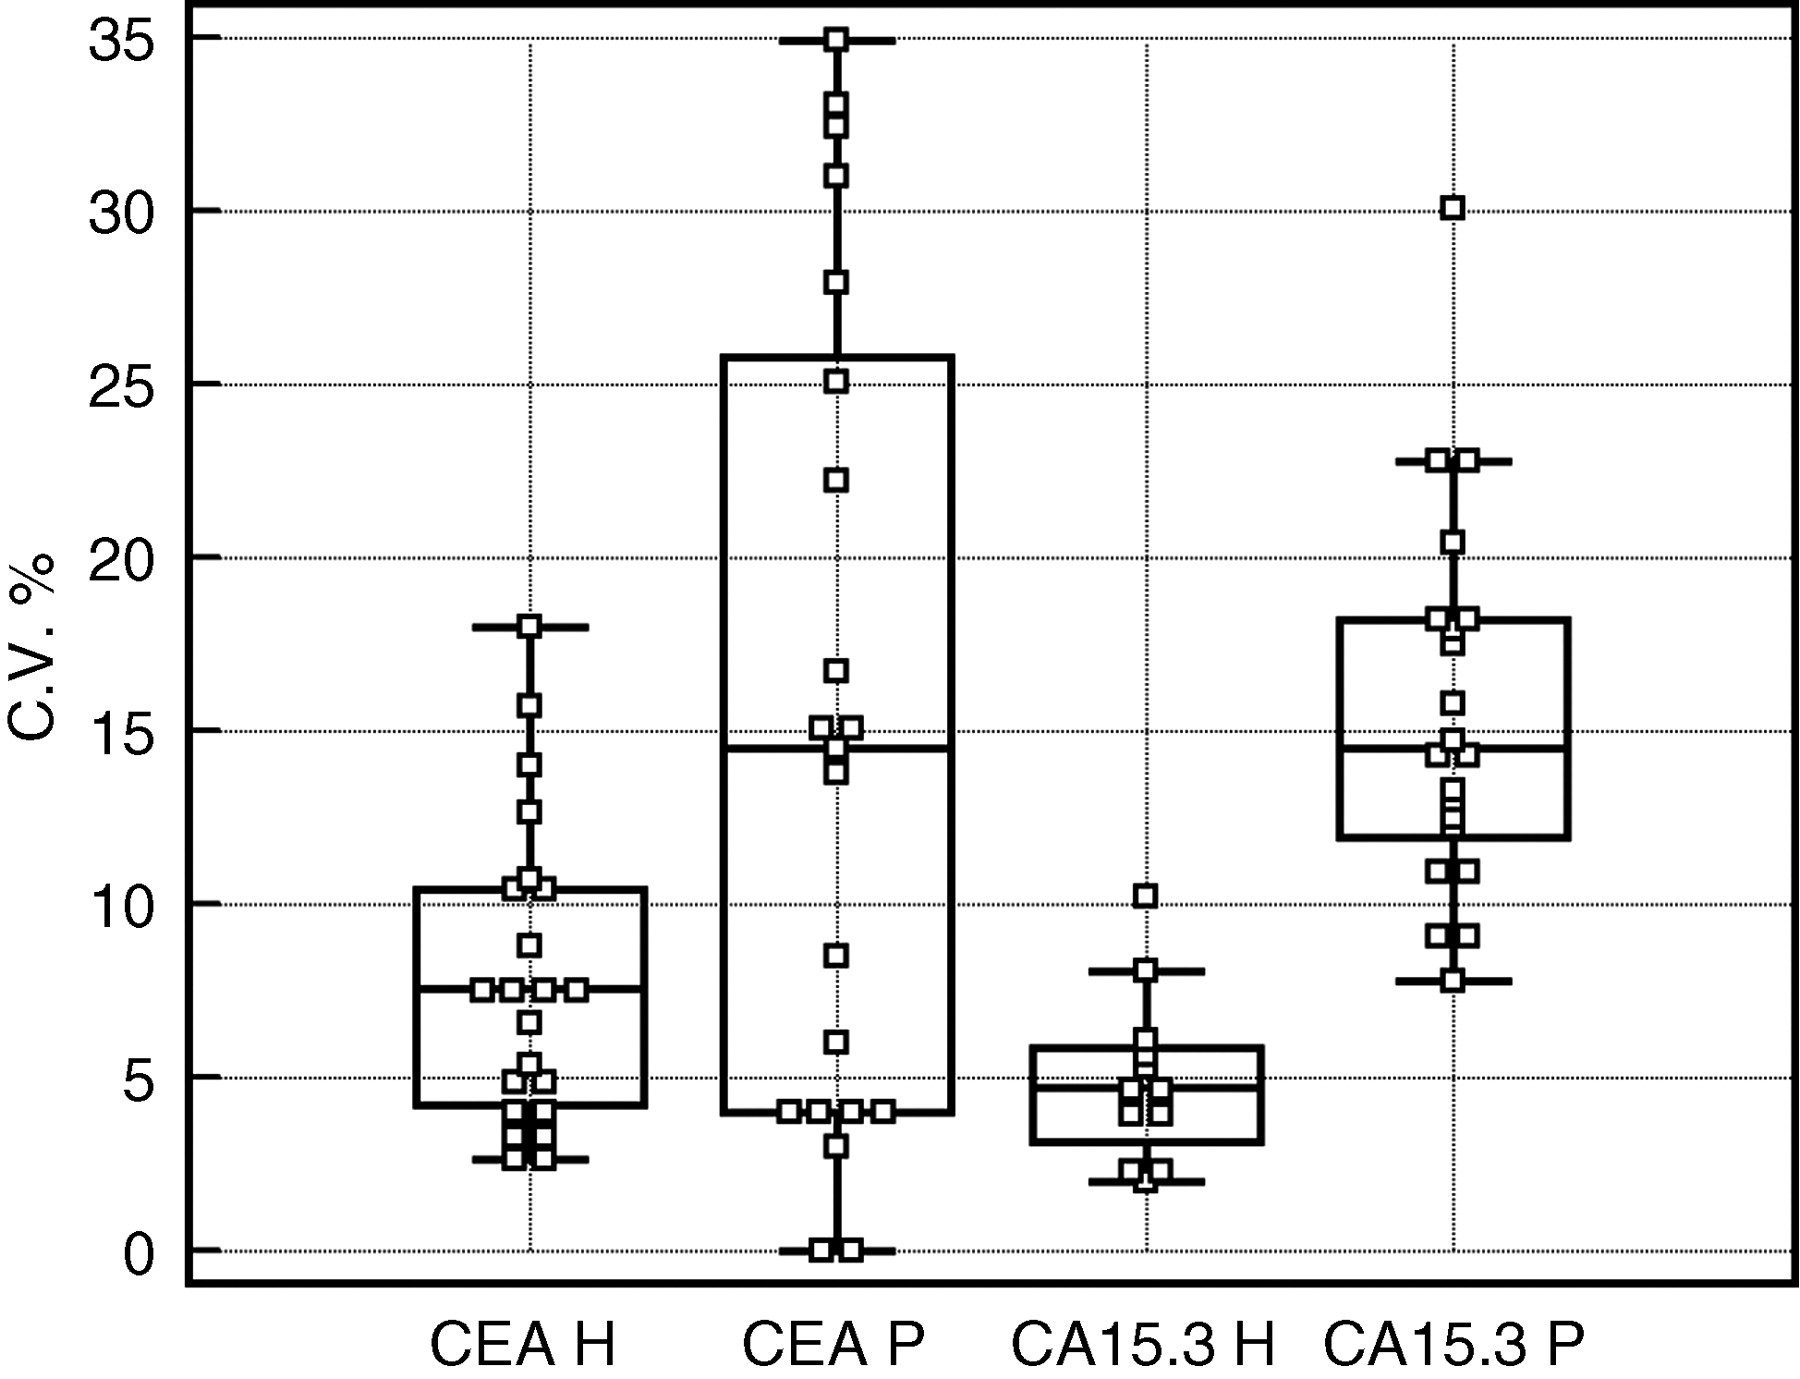
Box-and-Whisker plot of the distribution of individual intra-subject biological variation (C.V. %) of CEA and CA 15.3 in healthy subjects (CEA H and CA15.3 H, respectively) and in patient samples (CEA P and CA 15.3 P, respectively). The central box represents the interquartile range. The middle line represents the median. A line extends from the minimum to the maximum value, excluding ‘outside’ values, which are displayed as separate points.
We can conclude that:
the biological variation from healthy subjects should be considered a useful tool for the determination of quality specification;
8,9
for some laboratory tests, as in the case of tumour markers, the biological variation obtained from healthy subjects could not be useful for critical difference evaluation; the cumulative variability evaluated from patients could provide misleading results, and the individual critical difference for each patient, although difficult to obtain, could be the only way for the detection of clinically relevant variation.