
Abstract
Abstract
Iron status is influenced by inflammation when the normal control of iron metabolism is reorganized by the primary mediators of the acute phase response, tumour necrosis factor-α and interleukin-1. The objective of this review is to show how indices of iron status, particularly haemoglobin, serum ferritin and soluble transferrin receptor concentrations relate to changes in the acute phase proteins during inflammation. The pattern of acute phase response after elective surgery, not preceded by infection, is used to demonstrate the time course of stimulation of the acute phase proteins. The changes in the concentrations of serum acute phase protein and markers of iron status during treatment for infection are used to demonstrate inter-relationships between the indicators. In many developing countries, asymptomatic malaria and human immunodeficiency virus (HIV) are common and may affect the interpretation of iron indicators during population assessments. Malaria produces an acute phase response and relationships between acute phase protein and indices of iron status indicate an influence of inflammation in both symptomatic and asymptomatic malaria, except when the parasitaemia is less than 1000/μL of blood when ferritin appears to be unaffected. HIV-1 impacts on haemopoiesis and anaemia. Anaemia increases in severity as the disease progresses and it is often a negative prognostic indicator. However, in individuals infected with HIV there may be an atypical acute phase response in the absence of opportunistic infections. Tentative conclusions are drawn concerning the inter-relationships between ferritin and the acute phase proteins, C-reactive protein and α-1-acid glycoprotein during an acute phase response.
Introduction
Iron deficiency is the most common micronutrient deficiency in the world, but its detection is often obscured by infections. Iron deficiency affects all populations, but the most vulnerable are women and children. Anaemia is commonly used as an indicator of iron deficiency in population-based surveys, although iron deficiency is not the only cause of anaemia. Infections, haemoglobinopathies and vitamin A deficiency can, among other causes, lead to anaemia. 1 Areas with the highest rates of severe anaemia are often found in developing countries, where infections such as malaria or hookworm might be common. 1 In addition, human immunodeficiency virus (HIV) infections affect millions of people in the developing world and may influence iron status. 2
There are a number of indicators of iron status: bone marrow iron, haemoglobin, haematocrit (or packed cell volume), mean cell volume, mean cell haemoglobin, red cell distribution width, reticulocyte haemoglobin concentration, serum/plasma iron, erythrocyte protoporphyrin, zinc protoporphyrin, ferritin, total iron-binding capacity (TIBC), transferrin saturation, soluble transferrin receptors (sTfR) and body iron stores. In a recent World Health Organization (WHO)/Centers for Disease Control and Prevention (CDC) technical consultation on the assessment of iron status at the population level, five of the indicators listed above were selected for discussion at the consultation on the basis of the practicality of their measurement and the theoretical advantage of the indicator as a measure of iron status. 3 The indicators chosen were haemoglobin, zinc protoporphyrin, mean cell volume, sTfR and serum ferritin. Haemoglobin is a measure of anaemia, 1 zinc protoporphyrin reflects a shortage in the supply of iron, 4 mean cell volume indicates if red blood cells are abnormal in size, either too large (macrocytic anaemia) or too small (microcytic anaemia), 5 sTfR reflects the intensity of erythropoiesis and the demand for iron 6 and serum/plasma ferritin concentration is an important indicator of body iron stores. 1 However, the synthesis of ferritin is stimulated by infection, 7 therefore, recent infection may obscure iron deficiency when iron stores are measured by plasma ferritin because the concentration of plasma ferritin may indicate higher iron stores than truly exist. In contrast, clinical studies indicate that sTfR is less affected by inflammation than is serum ferritin. 8 The final recommendation of the WHO/CDC consultative group was that the best approach for assessing the iron status of populations is to measure the concentration of haemoglobin, even though not all anaemia is caused by iron deficiency, together with measurements of serum ferritin and sTfR. The WHO/CDC consultative group indicated that the prevalence of iron deficiency in a population could be based on serum ferritin except where inflammation is prevalent and in that case, the prevalence should also be based on sTfR. Table 1 indicates how data on both serum ferritin and sTfR may be interpreted, but this classification still requires validation. The WHO/CDC consultative group also stated that it can be useful to measure the concentration of an acute phase protein as well as serum ferritin, but that data are required to examine the relationships among serum ferritin, sTfR and different acute phase proteins to assess which correlated with serum ferritin during different stages of infection.
The interpretation of low serum ferritin and high soluble transferrin receptor (sTfR) concentrations in adult population surveys to define iron status: based on experience of measuring ferritin and sTfR in populations and requires validation (WHO/CDC)3
*WHO cut-off for serum ferritin3
†Apply thresholds recommended by manufacturer of assay until international reference standards are available
‡<30% pregnant women
¶Iron deficiency is defined as the state where there is insufficient iron to maintain normal physiological function of tissues such as the blood, brain and muscles. Iron deficiency can exist in the absence of anaemia, if it has not lasted long enough or if it has not been severe enough to cause the haemoglobin to fall below stated thresholds
§Iron depletion is the state in which storage iron is absent or nearly absent but the tissues that need iron are able to maintain normal physiological function
To evaluate the impact of interventions to control iron deficiency in populations, the consultation decided serum ferritin was the best indicator, but at the same time the measurement of the concentration of one or more acute phase proteins e.g. C-reactive protein (CRP) and α-1-acid glycoprotein (AGP) could provide useful information.
A background document on the interpretation of iron indicators in the presence of an acute phase response was produced for discussion by the WHO/CDC consultative group (personal communication). This review is however, a more comprehensive examination of the importance of the acute phase response in quantifying the effect of inflammation and infection on iron indicators especially haemoglobin, serum ferritin and sTfR. I searched the Medline database for information on the acute phase response and the association between acute phase response and iron indicators, with particular attention to serum ferritin, sTfR and haemoglobin. I also carefully examined references in the articles identified to locate additional relevant studies.
The acute phase response
The acute phase response is the innate, non-specific physiological and biochemical response of an organism to infection, inflammation, trauma, surgery, tissue injury, neoplastic growth or immunological disorders. 9 The acute phase response is usually transient and its main purpose is to prevent further damage to the tissues affected and to remove harmful molecules. However, in many chronic diseases like rheumatoid arthritis, the continued presence of an inflammatory stimulus maintains a continuous hypoferraemia and suppresses erythropoiesis resulting in anaemia of chronic inflammation.
During the acute phase response, the synthesis of a number of proteins is rapidly up-regulated, mainly in hepatocytes, under the control of cytokines including interleukin-1 (IL-1), tumour necrosis factor-α (TNF-α) and IL-6, which are released at the site of the tissue injury or insult. As the pro-inflammatory cytokines are released, the vascular system and inflammatory cells are also activated, leading to the production of more cytokines and other inflammatory mediators that diffuse into the extracellular fluid compartment and circulate in the blood stream. 10 The cytokines activate receptors on various target cells in the body resulting in a number of physical and biochemical changes. 9 The physical changes can be identified clinically by the presence of fever, anorexia, negative nitrogen balance and catabolism of muscle cells, 11–14 and biochemical changes can be identified by:
Leukocytosis; Decreases in low- and high-density lipoproteins; Increased adrenocorticotrophic hormone and glucocorticoid concentrations; Activation of the complement system; Decreased serum concentrations of zinc, iron and vitamin A; Changes in the concentration of several plasma proteins called the acute phase proteins.
10
Cytokines are not useful markers for monitoring health because they are cleared from the circulation within a few hours but the acute phase proteins are useful because they remain in the circulation for a minimum of 48 h.
Positive and negative acute phase proteins
Within a few hours of an infection or insult to the tissues, protein synthesis in the liver is altered and there is a complex set of reactions, the acute phase response, which is initiated to prevent further tissue damage, destroy the infective organism and activate the repair process. The acute phase response is characterized by an increase in the serum concentration of a number of proteins, the positive acute phase proteins and a decrease in others, the negative acute phase proteins. The role of the positive acute phase proteins has not been completely clarified, but includes host-adaptive and host-defence mechanisms of binding to foreign substances and modulating the phagocytic cell functions, scavenging the free haemoglobin and radicals and modulating the host immune response. 10 The up-regulation of the positive acute phase proteins is associated with a decrease in some of the carrier proteins, which are the negative acute phase proteins, e.g. transthyretin (previously called pre-albumin), retinol-binding protein (RBP), transferrin and albumin. These compounds are thought to have no immune function, but instead to act as transport proteins. As a result, the plasma concentration of the specific nutrients they carry may be reduced during infection and inflammation. 15
The positive acute phase proteins may be species-specific in the way they react and include: CRP, serum amyloid A, haptoglobin, AGP formerly called orosomucoid, α-1-antichymotrypsin, fibrinogen, complement factor-3 (C3), ceruloplasmin and ferritin. The magnitude of the change in concentration of the acute phase proteins during an acute phase response varies and is in general characterized into three groups:
Acute phase proteins which increase about 50% such as ceruloplasmin and C3; Acute phase proteins which increase by 2–5-fold, such as haptoglobin, fibrinogen, AGP and α-1-antichymotrypsin; Acute phase proteins which rapidly increase by as much as 1000–10,000-fold, such as CRP and serum amyloid A.
15,16
Sequence of events of the acute phase response
The acute phase response after elective surgery, not preceded by infection, can be used to demonstrate the time course of stimulation for the acute phase proteins. The earliest change in the acute phase response is in cortisol, which peaks at 6 h, followed by leukocytosis, which peaks at 10 h. Data obtained after cholecystectomy indicated that the acute phase proteins, CRP and α-1-antichymotrypsin rose rapidly in the first 6 h and continued to rise for the first 20 h after surgery, whereas AGP showed only small increases during the same time period (Figure 1). Albumin and transthyretin both decreased, whereas haptoglobin initially decreased, but returned to baseline values within 20 h after the surgery, followed by a steady increase over the next few days (Figure 1). 15 De novo synthesis of CRP starts very rapidly after a single stimulus, rising from normal median concentrations of 0.8 mg/L in young adult volunteers to concentrations greater than 5 mg/L within 6 h. 17 Data collected over six days following elective surgery showed that CRP rose very rapidly to concentrations of >100 mg/L, peaked at day 2, and then slowly declined. 15 Fibrinogen and AGP increased slowly initially and did not return to normal concentrations until up to a week after CRP had returned to baseline concentrations. 15 In data reported by Fleck and Myers, the rise in AGP and fibrinogen was preceded by a slight fall in concentration immediately after an operation. 15 An initial decrease in AGP concentration was also observed by Myers et al. 18 2–4 h after a skin incision for hysterectomy and followed by an increase in AGP at 6 h. 18 The initial decrease in AGP concentration is thought to be due to early increases in microvascular permeability that facilitates the movement of proteins between the plasma and extracellular fluid in damaged tissues. 16
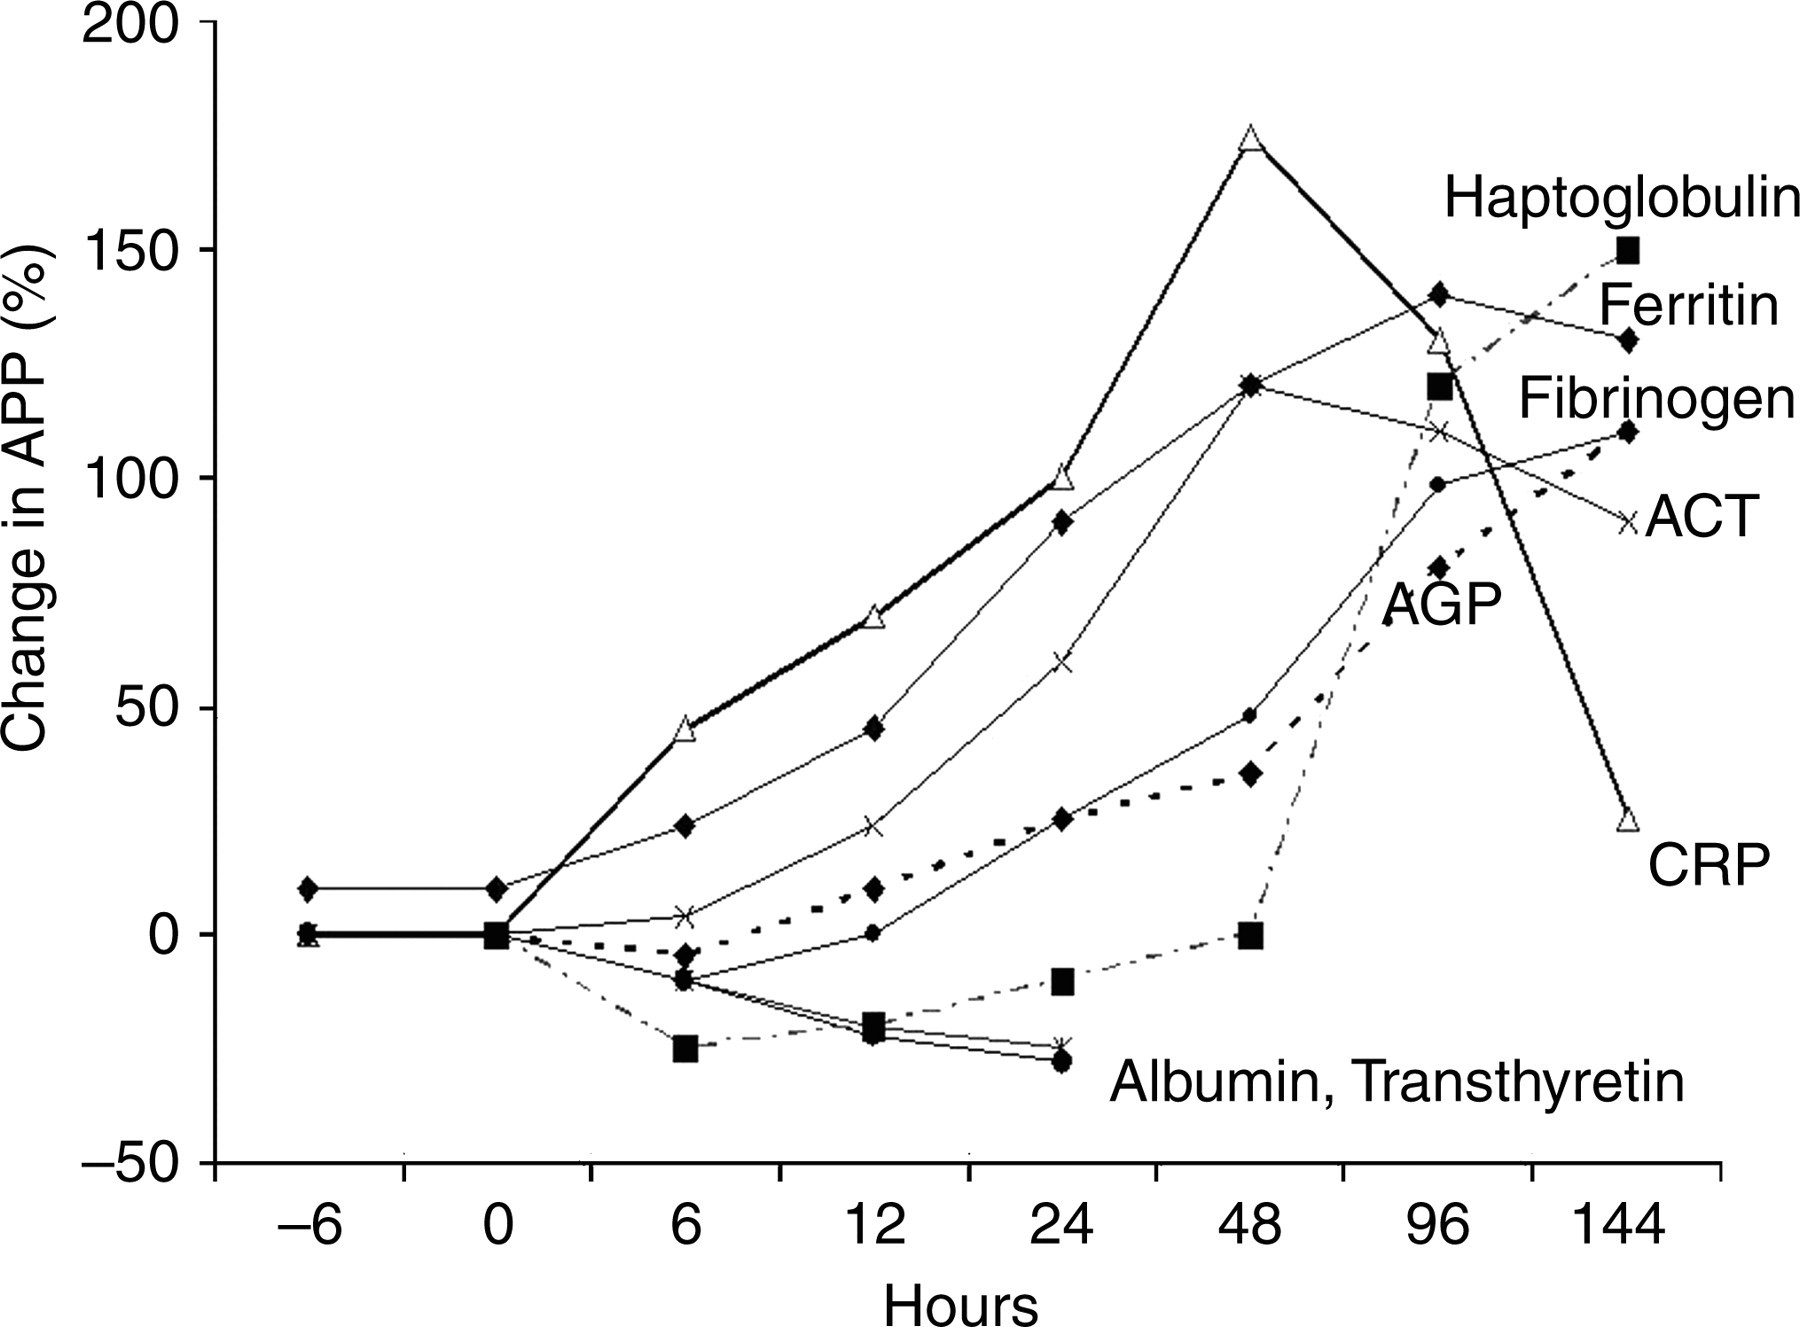
Characteristic patterns of change in acute phase proteins (APP) after trauma (modified from Fleck and Myers).15 APP are shown as percent change from initial values. AGP , α-1-acid glycoproteins; CRP, C-reactive proteins; ACT, α-1-antichymotrypsin
CRP, serum amyloid A, haptoglobin, fibrinogen and albumin data collected over 21 days confirmed and enhanced the information from earlier reports. 15 Both CRP and serum amyloid A increased early and rapidly and peaked at 48–72 h. With no postoperative complications, CRP returned to normal by the 10th postoperative day, whereas serum amyloid A did not return to normal values until about 12–14 days after surgery. In contrast, haptoglobin and fibrinogen initially decreased in concentration over the first 12 h, then slowly increased and achieved maximum concentrations at 10 and 12 days, respectively. Fibrinogen returned to normal by day 21, but haptoglobin was still elevated at that time. 16
Changes in acute phase proteins and iron indicators during treatment for various diseases
Baynes et al. 19 followed the inter-relationships of various acute phase indices in patients with differing illnesses over time and showed sequential changes during treatment. High concentrations of plasma ferritin appeared to parallel those of plasma CRP measured in acute pneumonia, and similar responses were found in tuberculosis, rheumatoid arthritis and neutropenic sepsis, suggesting that ferritin was acting as an acute phase protein. However, the degree to which ferritin rose was influenced by the underlying iron status of the subjects. Plasma ferritin concentrations were much lower in individuals with rheumatoid arthritis who were iron deficient as well as being chronically ill, whereas CRP seemed to be elevated in accordance with the severity of the disease.
In patients admitted with neutropenic sepsis, both CRP and ferritin were markedly elevated and with recovery, there was a sharp drop in CRP that was not paralleled by a drop in plasma ferritin (Figure 2). The plasma half-life of CRP is about 19 h and is the same in both health and disease. Thus, the sole determinant of CRP concentration is synthesis rate, which is determined by the intensity of the pathological process stimulating CRP production: when the stimulus is removed serum CRP concentrations fall rapidly. 20 During the treatment of neutropenic sepsis, the synthesis of CRP must have been switched off as the infection was removed, and hence concentrations declined markedly. Concentrations of ferritin declined more slowly than did those of CRP, perhaps because of the longer half-life of ferritin; studies using rat livers indicated the half-life of ferritin was about 72 h. 21 In addition, some components of the acute phase response may still be active. For example, AGP and erythropoiesis may remain depressed, and serum ferritin concentrations may remain high. 19
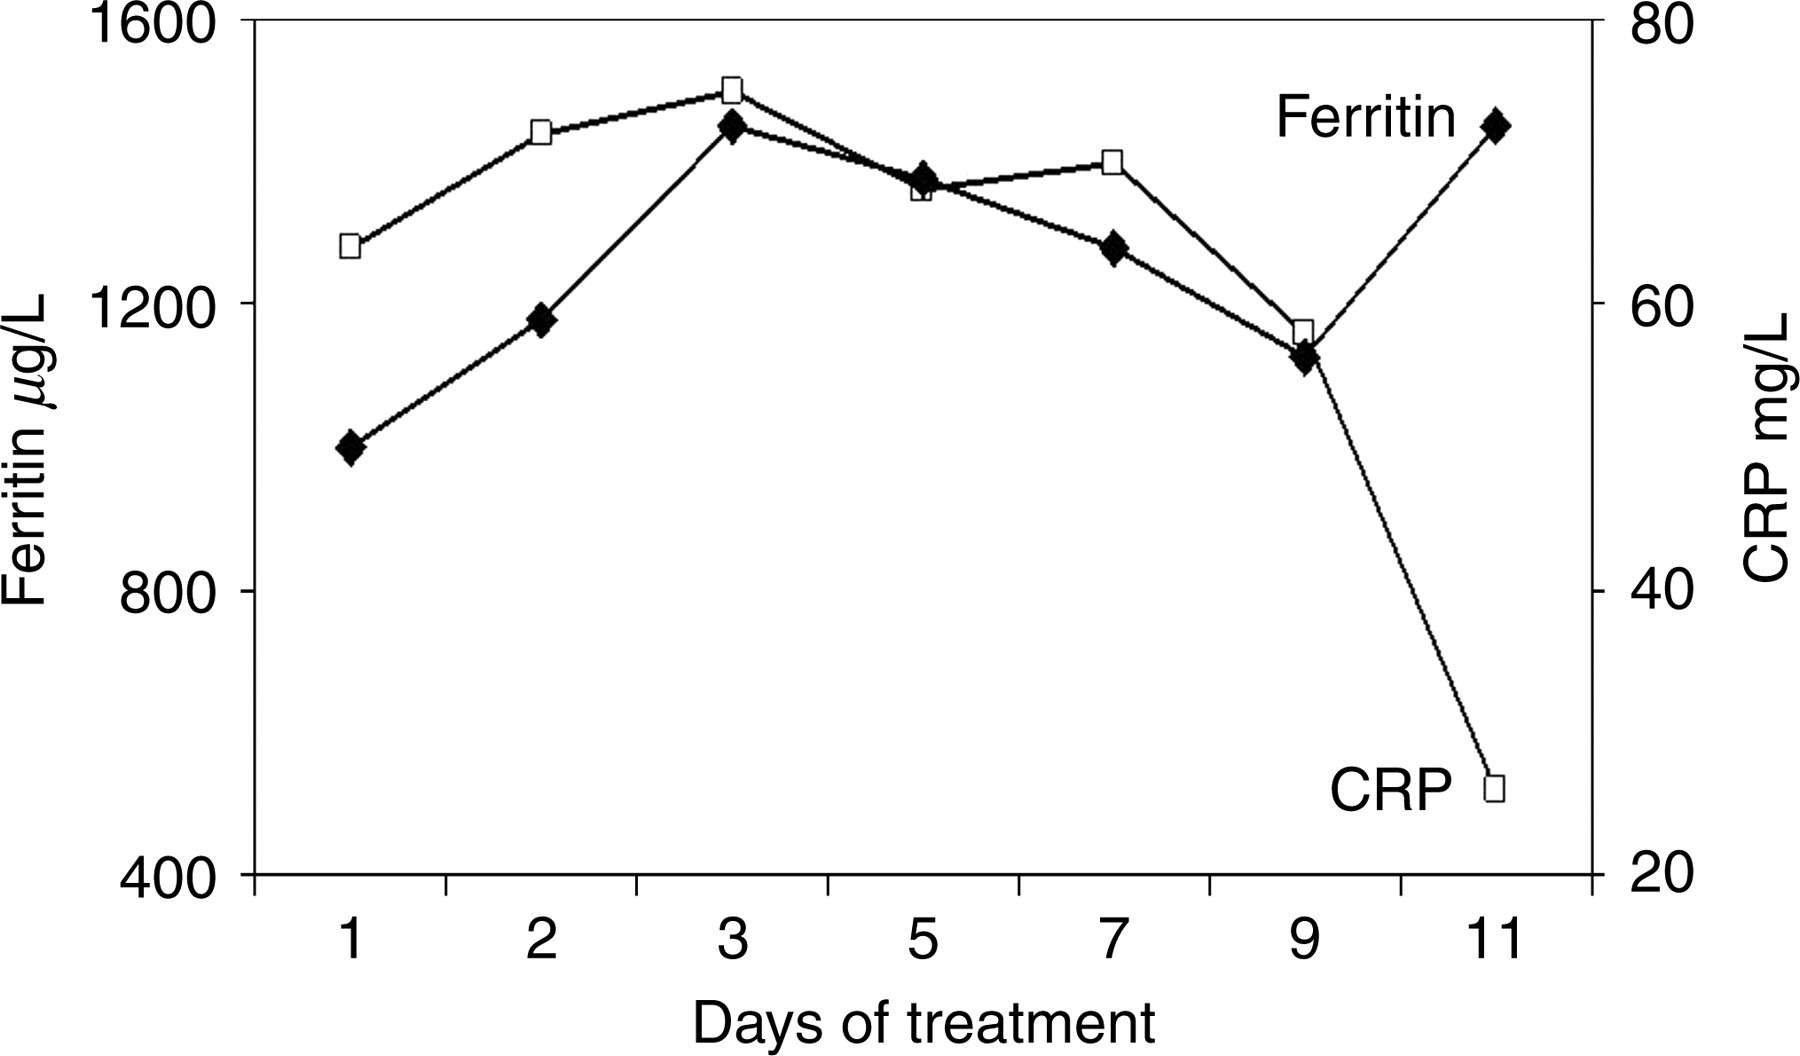
Sequential changes during treatment in mean plasma ferritin and C-reactive protein (CRP) in nine patients with neutropenic sepsis (modified from Baynes et al.)19
Acute phase proteins, iron indicators and the influence of cytokines
Low serum iron and elevated serum ferritin concentrations during an acute phase response are associated with a redistribution of iron into the liver and mononuclear phagocyte system, which are mediated by cytokines. 22 In animal studies, the administration of the cytokines, TNF-α, IL-1 and IL-6 induced a decrease in serum iron concentrations within 3–6 h of administration, and in similar studies in vitro, cytokines induced an increase in ferritin synthesis. 23–25 Feelders et al. 22 carried out an experiment in humans and reported similar results to those found in the in vitro and animal studies, that is the administration of cytokines resulted in hypoferraemia (low concentrations of serum iron) associated with a marked increase in ferritin production within 4 h.
In the study by Feelders et al. subjects were pre-treated for two days with the T-cell-derived cytokine human interferon-γ (IFN-γ), which is thought to prime activated macrophages. 22 Serum samples were taken on two pre-treatment days and at baseline from 12 patients with inoperable soft-tissue sarcoma or melanoma. The diseased limb was isolated from the body's circulation and was perfused with recombinant human TNF-α and recombinant human IFN-γ. Further, blood samples were taken for seven post-treatment days. Although the presence of an acute phase response is found in many types of cancer 26,27 and would be expected to produce associated changes in iron metabolism, Feelders et al. 22 showed that the acute phase proteins (except AGP, which was slightly elevated) and iron status were normal before treatment, suggesting that the local tumours were not producing a systemic reaction.
Following the treatment with recombinant TNF-α and IFN-γ, all acute phase proteins decreased immediately probably due to haemodilution and capillary leakage. The only exceptions were CRP and ferritin, which increased subsequent to the isolated limb perfusion, representing an early acute phase response, whereas AGP responded more slowly in a second ‘wave’ of responses (Figure 3). CRP concentrations started to increase 4 h after perfusion and showed a sharp decrease after peaking at day +2. Ferritin concentrations were slightly higher at baseline compared with day −2, but gradually increased after perfusion for up to 4 h, when a sharp rise in ferritin concentrations occurred, in parallel with CRP at day +2. Subsequently, ferritin concentrations decreased slowly but were still elevated at day 7, as was AGP (Figure 3). In contrast, the two negative acute phase proteins, albumin and transferrin, decreased (not shown) in concentration from day −2 and remained low up to day +2. Serum iron decreased from 18.3±1.4 μmol/L during pre-treatment to 9.1±0.8 μmol/L at baseline, then remained unchanged until a marked decrease occurred 8 h after the perfusion, to reach minimum concentrations (3.1±0.1 μmol/L). Serum iron returned to baseline values at day +2. At the start, sTfR concentrations were within the reference range (4.94±1.64 mg/L) (Figure 3), but during pre-treatment with rIFN-γ, concentrations fell to 3.4 mg/L at baseline, followed by a further decrease after perfusion to reach a nadir of 3.0 mg/L at day +2. Subsequently sTfR concentrations increased but had not reached initial concentrations by day 7.
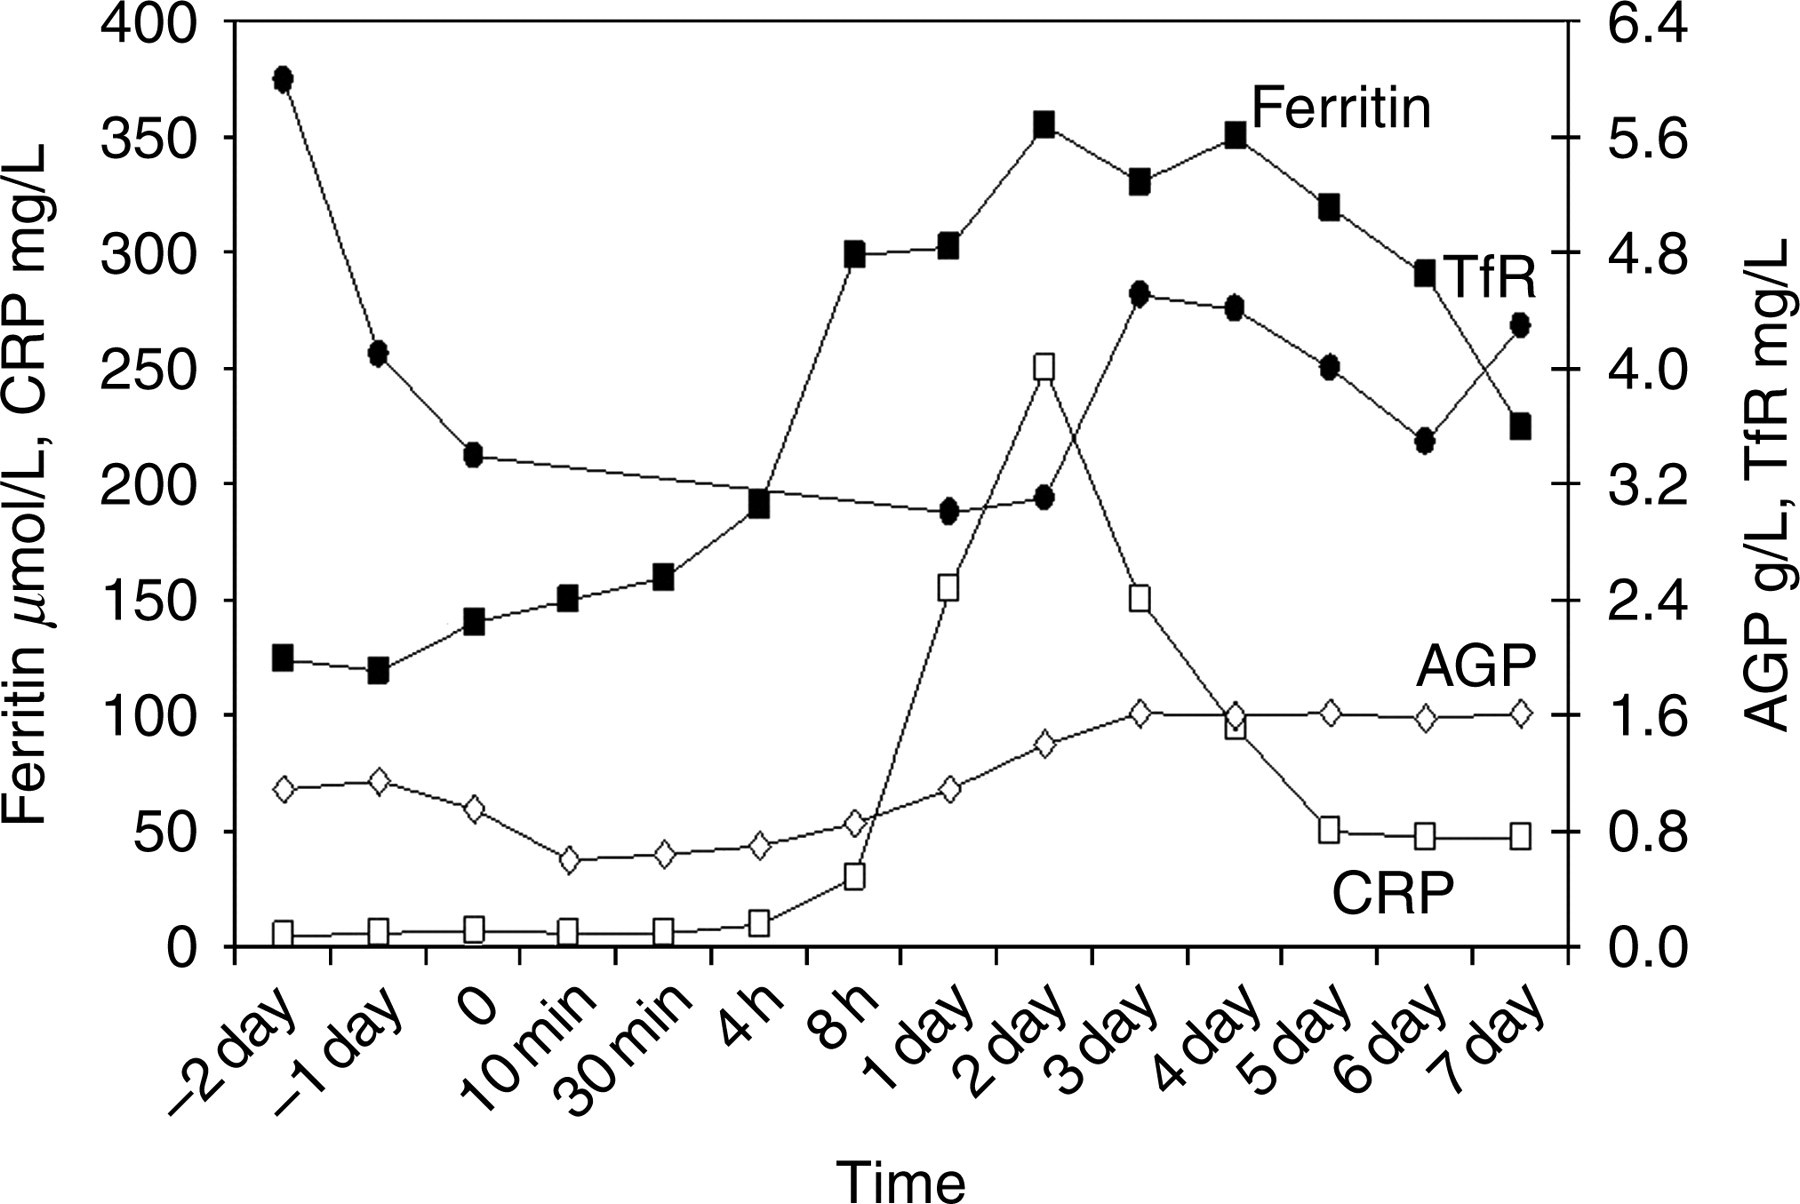
Time course of ferritin, C-reactive protein (CRP) and α-1-acid glycoprotein (AGP) after isolated limb perfusion (modified from Feelders et al.).22 TFR, transferrin receptor.
The experiment showed that the administration of cytokines TNF and IFN-γ in humans caused hypoferraemia associated with increased ferritin production. The data also confirmed earlier reports that the increase in ferritin concentrations paralleled those of CRP, suggesting that ferritin responds as an early acute phase protein. 19 However, plasma ferritin concentrations remained elevated longer than did CRP concentrations, thus, in the latter part of the experimental treatment, ferritin behaved more like AGP. Concentrations of sTfR, however, showed a prompt decrease following TNF-α administration, with minimum concentrations paralleling maximum concentrations obtained for CRP and ferritin. 22 The response of sTfR suggests one of two possibilities: either it was reflecting an impaired erythroid growth or the expression of TfR was being mediated by the cytokines.
Control of iron metabolism
The regulation of iron metabolism is normally under the control of iron-regulatory proteins that bind to sequences on mRNA and protect mRNA from degradation. As a consequence of iron deficiency, the iron-regulatory proteins bind to mRNA and promote the expression of TfR protein, and repress ferritin synthesis. When iron is adequate, ferritin synthesis is promoted and iron storage occurs. During acute inflammation, the normal control of iron metabolism is reorganized by TNF-α and IL-1, the primary mediators of the acute phase response. TNF-α and IL-1 induce ferritin transcription thereby increasing serum ferritin concentrations, despite low concentrations of serum iron, because ferritin mRNA is more sensitive to cytokines than to iron. 22 The increase in serum ferritin concentrations parallels the increased storage and retention of iron within the reticulo-endothelial system.
Experimental studies using rat livers have reported a rapid drop in serum iron concentrations following the induction of inflammation, a reaction that may be due to an increase in apoferritin synthesis which inhibits the release of iron into the plasma. 28 Another study using mice injected with pro-inflammatory cytokines (recombinant TNF and IL-1) or mouse peritoneal macrophages treated in vitro with TNF and IL-1 found that only TNF caused a significant decrease in serum iron after 6 h and mediated the hypoferraemia of inflammatory disease. 29
The low concentrations of serum iron found during infection are accompanied by changes in plasma concentrations of several iron-binding proteins (Table 2) that facilitate iron uptake by the reticulo-endothelial system and the removal and reuse of haemoglobin from the breakdown of old erythrocytes. 30 Hypoferraemia may protect against infection by withholding iron from pathogenic micro-organisms. Although this may be true for some bacteria, other pathogenic bacteria have powerful siderophores enabling them to compete quite successfully against the iron-binding proteins in the plasma. 31 Hypoferraemia may also reduce the potential pro-oxidant properties of iron and exacerbation of tissue damage at the site of inflammation where reactive oxygen species are being produced and the body's cells are at risk of damage. 32 An early theory suggested that lactoferrin acted in the hypoferraemic–hyperferritinaemic response to inflammation by causing a drop in plasma iron and a rise in plasma ferritin. This was done by removing iron from transferrin and delivering it to the macrophages, where it was bound to ferritin. However, it is now thought that lactoferrins exert antimicrobial properties that are independent of iron binding, although the mode of action has not been elucidated. 32 Current ideas also suggest that activated macrophages synthesize TNF-α, which with IL-1, in the presence or absence of exogenous iron, transcriptionally induce synthesis of the H-subunits of ferritin (see below) and increase iron uptake by the macrophages.
Influence of inflammation on iron-binding proteins in plasma (adapted from Thurnham et al.)30
*Ceruloplasmin reference range for adults analysed by immunoturbidimetric assay (ARUP Labs, UK)
†Transferrin reference range for adults analysed by quantitative turbidimetric assay (Dade Behring)
‡Lactoferrin reference range as analysed by radioimmunoassay
¶Ferritin reference range analysed by microparticle enzyme immunoassay (Abbott IMx)
#Haptoglobulin reference range analysed by immunoturbidimetric assay (Sentinel, Italy)
§sTfR reference range used by Ramco Laboratories, Texas, USA
‖Converted to SI units from the mass-SI unit equivalence of (19.6/1.47) reported by Allen et al. 55
More recently, the hypoferraemia of infection has been shown to be the consequence of induction of hepcidin expression through the signal transducer and activator of transcription 3 (STAT3). STAT3 is an acute phase response factor, which is activated through phosphorylation by the action of the inflammatory cytokines on hepatocytes to form homo- or heterodimers that translocate to the cell nucleus where they act as transcription activators. 33,34 STAT3 is a key effector of baseline hepcidin expression during inflammatory conditions, and hepcidin is thought to be a key iron-regulatory hormone produced by the liver. Hepcidin may control plasma iron concentration and tissue distribution of iron by inhibiting intestinal iron absorption, iron recycling by macrophages and iron mobilization from hepatic stores and act by inhibiting cellular iron efflux through binding to and inducing the degradation of ferroportin, the only known cellular iron exporter. 35 The expression of hepcidin is modulated in response to body iron stores, hypoxia and inflammatory and infectious stimuli involving at least in part cytokines secreted by macrophages. 36 Increased hepcidin expression may play an important role in the anaemia of inflammation by restricting intestinal iron absorption and macrophage iron release. Any detrimental consequence of these changes to the iron status in the short term is probably minimal. 37 However, if infection is prolonged or the individual is malnourished at the start, then a further reduction in the concentration of iron caused by inflammation may well impair tissue functions so producing or worsening the nutritional deficiency.
The hypoferraemia of inflammation does not represent a genuine (i.e. dietary) iron deficiency, but rather a redistribution of iron that can prevail in the face of normal iron stores.
38
Anaemia commonly occurs in chronic infection, inflammation and malignancy and is characterized by:
Decreased plasma iron and iron-binding capacity; Impaired release of reticulo-endothelial iron into the plasma; Modest decrease of red cell survival; Relative failure of bone marrow to increase red cell production.
Frequent exposure to endemic diseases will continuously maintain a hypoferraemic state and promote anaemia by impairing erythrocyte synthesis and/or a shortening red cell lifespan. Whether this is also accompanied by a metabolic iron deficiency, will depend on the ability to maintain iron stores, i.e. iron absorption, iron loss and availability of dietary iron becomes critical to maintaining normal haemoglobin concentrations. Where infection is prolonged (chronic disease) or the patient malnourished at the outset then the concentration of haemoglobin may decrease so much as to impair tissue function and as a consequence the ability of the body to deal with the infection. In many developing countries where the exposure to infection is high, elevated acute phase proteins may be found throughout the year, e.g. in The Gambia elevated α-1-antichymotrypsin concentrations were found in more than 50% of Gambian infants at all time points during a longitudinal study over 15 months.
39
Childhood anaemia and stunting were both found to be a problem in such children.
40
Which iron indicator is best to assess iron deficiency in populations?
Measurement of bone marrow iron remains the gold standard for assessing iron stores, but because of the invasiveness of the method, alternative methods of measuring iron stores are sought, e.g. plasma ferritin. In Scandinavia, using a randomly selected sample of women with known iron status, the efficacy of different methods of screening for iron deficiency was re-examined on the basis of absence/presence of stainable iron in bone marrow smears The study found, using a radioimmunoassay for serum ferritin determination calibrated with the International Standard 80/602, the best discrimination was obtained using a cut-off of <16 g/L serum ferritin (specificity 98%; sensitivity 75%). 41 Absence of iron stores was associated with signs of an iron-deficient erythropoiesis, and was evident at serum ferritin concentrations of 25–40 μg/L. Use of multiple criteria to diagnose iron deficiency falsely reduced prevalence figures for iron deficiency. 41 A second study in Scandinavia successfully used the cut-off of <16 μg/L serum ferritin to evaluate iron status in the Danish female population before and after abolishment of iron fortification. 42
Another approach to identify iron deficiency was used in the National Health and Nutrition Examination Survey II and III where three parameters were measured: transferrin saturation, serum ferritin and erythrocyte protoporphyrin. Criteria were established such that if two of the three were abnormal then iron deficiency was present. 43 It is suggested that the first approach (ferritin <16 μg/L) overestimated the frequency of iron deficiency, especially in paediatric samples, while the second approach (two-thirds abnormal parameters) may underestimate iron deficiency unless cut-offs are carefully selected, particularly for transferrin saturation because it has high biological variability. 41
Other approaches for assessing iron deficiency, especially in the presence of infection, include:
Determination of serum ferritin plus percentage saturation of serum iron-binding capacity (transferrin), where high serum ferritin plus a percentage transferrin saturation <45 usually indicates infection caused the high ferritin;
44
Measurement of sTfR, thought to be unaffected by infection;
45
Measurement of sTfR plus ferritin. Iron deficiency anaemia (haemoglobin: <140 g/L men; <120 g/L women), no inflammation (CRP ≤4 mg/L), and no stainable bone marrow iron i.e. uncomplicated iron deficiency; Anaemia of infection+iron deficiency anaemia: as measured by elevated CRP concentrations (>4 mg/L), haemoglobin (<140 g/L men; <120 g/L women), no bone marrow iron and with chronic inflammatory diseases e.g. rheumatoid arthritis, liver cirrhosis, chronic renal failure; Anaemia of inflammation: inflammation and no iron deficiency anaemia (haemoglobin ≥140 g/L men; ≥120 g/L women) and stainable iron in the bone marrow with chronic diseases; Non-anaemic controls that had no inflammation and stainable bone marrow iron.
In particular, Beguin and others suggest that the combined use of sTfR and ferritin or the use of sTfR/ferritin or sTfR/log ferritin ratios may help to identify iron deficiency in patients with a chronic inflammation.
8,46,47
Cook et al.
48
reported that in healthy subjects the sTfR/serum ferritin ratio can be used to provide estimates of iron stores, but the use of the ratio where infection is endemic has not been investigated. Lee et al.
49
assessed the diagnostic performance of sTfR, ferritin and sTfR/log ferritin index for detecting iron depletion in groups of anaemic and non-anaemic patients and controls.
49
Based on bone marrow iron classification and clinical data the patients were classified into groups:
Using these groups there was no significant difference among the areas under the curve obtained for ferritin, sTfR or sTfR/log ferritin index. However, in patients with chronic inflammatory disease, both ferritin (cut-off ≤153 μg/L) and sTfR (cut-off >0.75) discriminated between those with iron deficiency anaemia plus anaemia of infection, and those with just anaemia of infection but the sTfR/log ferritin index did not improve the ability to detect iron depletion compared with ferritin alone, and sTfR had lower diagnostic accuracy than did ferritin.
49
The sTfR/log ferritin index did not improve diagnostic accuracy compared with the serum ferritin or sTfR, and sTfR was not better than ferritin for detecting iron depletion. However, the authors suggest that measurement of an acute phase protein is required so that different cut-offs (e.g.>153 μg/L) can be applied to serum ferritin in patients with inflammation or infection. The pathogenesis of anaemia in cancer is still unclear and in patients with cancer serum ferritin is the best indicator of iron status.
49
Ferritin
In vertebrates cytosolic ferritin consists of two subunits, the H (heavy chain) and the L (light chain) forms. The apoferritin shell is made up of 24 ferritin subunits and each ferritin molecule can sequester about 4500 iron atoms. 7 The ratio of the H:L type can vary with the L-form being found mostly in the liver and spleen and the H-form mostly in the heart and kidney; however, during inflammation or stress the ratio of H:L forms can increase. The H-subunit has ferroxidase activity and can convert ferrous (Fe[II]) to ferric (Fe[III]) that is important in limiting the amount of Fe(II) available to participate in the production of free oxygen radicals and hence limit the potential generation of oxidant species.
Reference ranges for serum ferritin
Only small quantities of ferritin are present in the serum and it immunologically resembles the L-subunit. Concentrations of serum ferritin are elevated in conditions of iron overload and inflammation. Although serum ferritin is used as an indicator of body iron stores little is known about its source. 7
There are several WHO standards for ferritin, prepared by extraction from human liver or spleen. Not all methodologies are calibrated in relation to the same primary standard, the consequence of which is different results with different test systems. Of course, antibodies from a range of test kits may also contribute to the variation in results. The reference values quoted in the literature vary considerably, partly due to the different standards and partly due to the difficult nature of the investigation, which requires a suitable reference population to define the range.
The WHO define serum ferritin concentrations <12 μg/L to indicate depleted iron stores in children <5 years of age, and concentrations <15 μg/L indicate iron deficiency in those older than five years of age. 1 However, both of these cut-offs may be too low in the presence of an acute phase response or chronic disease, and serum ferritin concentrations between 30 and 100 μg/L may indicate depleted iron stores in such circumstances. 1,50
Ferritin as a measure of iron status
Diagnostic bone marrow sampling is seldom performed in simple iron deficiency, but if the diagnosis is in doubt a marrow aspirate may be carried out in a clinical setting to demonstrate absent bone marrow stores, but this is not a practical measure for population surveys. WHO states that iron status can be determined by several well-established tests in addition to haemoglobin and haematocrit, but no single standard test can assess iron deficiency without anaemia. 1 In the WHO/CDC consultative group statement it was suggested that measuring serum ferritin concentration is the best method for describing the prevalence of iron deficiency in a population, except where inflammation is prevalent. In addition it was noted that serum ferritin is the best indicator of a response following an intervention to lower the prevalence of iron deficiency, such as, fortification of flour with iron, and should be measured with haemoglobin concentration in all programme evaluations. 3
Ferritin and the acute phase response
The dual role of serum ferritin as an indicator of iron stores and as a positive acute phase protein has been known since the 1970s, but the exact kinetics are still not known in detail. 1 Understanding how to interpret the concentration of serum ferritin in the presence of inflammation is difficult, and various approaches have been suggested. An early idea was to combine the assay of serum ferritin with a measure of disease severity such as erythrocyte sedimentation rate or CRP. Witte et al. 51 described such a method using serum ferritin and erythrocyte sedimentation rate in anaemic patients in a community hospital and claimed to be able to exclude iron deficiency in almost all patients with anaemia of infection. However, Coenen et al. 52 were not able to confirm the findings. More information is needed to interpret markers of iron status in the presence of both acute and chronic inflammation; the interpretation of serum ferritin as a marker of iron status specifically in malaria and HIV will be discussed in later sections.
The report of the WHO consultative group on the use of iron indicators for population assessment of iron status suggests that a meta-analysis of existing data be carried out to explore the possibilities of using one or two acute phase proteins to correct ferritin in the presence of infection. 3 In the meantime, the recommendation is that when using serum ferritin concentrations as a measure of iron deficiency, at least one acute phase protein should also be measured, and if possible, individuals with acute phase protein concentrations greater than the manufacturer's recommended cut-off should be excluded from the analysis. As the latter can result in the exclusion of much valuable data, more studies to determine how to interpret ferritin in the presence of infection are urgently needed.
Soluble transferrin receptor
Transferrin is the iron-transport protein in the plasma, providing iron to cells through its interaction with the specific membrane receptor (TfR). 8 The TfR is a disulphide-linked, transmembrane glycoprotein with two identical polypeptide chains, each weighing 95,000 daltons. TfR has an important role in the regulation of iron metabolism at the cellular level by mediating the cellular uptake of transferrin-bound iron (Fe III). TfRs are present on nearly all types of cells, but the number of receptors varies according to the cell type and correlates with the requirement for iron. That is, fewer receptors are expressed when iron is abundant. 53 In normal adults 80% of the TfR are in the erythroid cell precursors in bone marrow. The TfR-transferrin-iron complex travels from the cell membrane into the cell via an endocytic vesicle and in the intracellular compartment the iron dissociates from the TfR-transferrin complex. 54 Iron remains in the cytosol, whereas the TfR-transferrin complex is recycled back to the cell surface.
sTfR is found in serum or plasma and is a truncated monomer of the transmembrane receptor in that it lacks the first 100 amino acids. 8,55 sTfR was first measured quantitatively in human serum by Kohgo et al. 56 in 1986 and in rat serum by Beguin et al. 57 in 1988, but, as an alternative method for assessing iron status, its measurement has become popular in the last 10 years. Serum concentrations of sTfR increase in iron deficiency when there is inadequate iron delivery to the bone marrow and tissues. It is thought that serum or plasma sTfR concentrations are not increased in individuals during an acute phase response because reduced erythropoietin production and suppression of erythropoiesis by cytokines may prevent elevation. 8 Therefore, in general, the measurement of sTfR may help to distinguish between individuals with and without iron deficiency in the presence of infection, but there may be difficulties in interpreting sTfR in the presence of some infections as will be discussed below.
Soluble transferrin receptor and normal concentrations
sTfR concentrations can be measured in quantitatively reproducible assays. Most assays are based on immunological methods that identify the amount of cleaved serum fragment from the membrane-bound TfR found on nearly all cells. The quantification of the relationship of iron deficiency anaemia to sTfR resulted in the commercial production of kits for measuring sTfR, however, no international reference standard currently exists, which limits the comparison of data among laboratories using different commercial kits.
Although work is now in progress to establish an international reference standard for sTfR, the absence of such a standard has made it difficult to identify a reference range of concentrations. Beguin et al. 8 published a normal mean (SD) sTfR concentration of 5±1 mg/L and a commercial kit that is popular in the USA (Ramco, USA) uses a reference range of 2.9–8.5 mg/L, others use different ranges, e.g. 1.3–3.3 mg/L (Orion Diagnostica, Finland) and 0.85–3.05 mg/L (R & D, USA).
In an experiment to measure sTfR in healthy adults, no differences in sTfR concentration were found by sex or age between the ages of 18 and 80 years, but black subjects had significantly higher concentrations than non-black (Caucasian, Hispanic and Asian), and black and non-black subjects living at high altitude had higher concentrations than those living closer to sea level (Table 3). 55 Another study found sTfR concentrations were higher in infants (mean 7.8 mg/L; 95% CI: 4.5, 11.1) than in prepubertal boys (7.0 mg/L; 95% CI: 4.7, 9.2) and higher in prepubertal boys than in men (5.8 mg/L; 95% CI: 3.1, 8.5). 58 The authors also reported that lower serum ferritin and iron concentrations, even within the normal physiological range, were associated with elevated sTfR concentrations and the lower the serum ferritin concentrations, the higher the sTfR concentrations.
Mean soluble transferrin receptor (sTfr) concentrations in populations and at different heights above sea level55
*Assayed by a quantitative two-site immunoenzymometric (‘sandwich’) technique. sTfR is calibrated against natural plasma sTfR minimizing calibration discrepancies from differences between the analyte and the cellular transferrin receptor
†In the study, the mean value for all adults 19.6 nmol/L corresponded to 1.47 mg/L
‡Black adults include men and women
§Non-black are Caucasian, Asian and Hispanic and include both men and women
Factors influencing soluble transferrin receptor concentrations
The cellular content of sTfR varies with the iron needs of the tissue and is highest in human placenta and in erythroid marrow. 59 Clinical studies have demonstrated that the concentration of sTfR is proportional to the total body mass of tissue receptors and an elevation of sTfR concentrations occurs whenever erythroid precursors are increased as in iron deficiency anaemia. 60 Therefore, measurements of sTfR provide a useful clinical index of tissue iron deficiency. Serum sTfR concentrations can range from eight times below to 20 times above the average normal values. 8 The most important factor controlling this variability is bone marrow erythropoietic activity. 8
Erythropoiesis is regulated by the hormone erythropoietin, which is secreted mainly in the kidney in adults and to a small extent in the liver. 61 Erythropoietin is produced in response to hypoxia and causes the bone marrow to synthesize more red blood cells. As long as there are no abnormalities in the production of erythropoietin in the kidney, and there is enough stored iron, the concentration of erythropoietin will normally have a linear inverse correlation with haemoglobin concentrations. 61 With the increase in the erythroid mass, there is an increase in the number of TfRs, which are present on the red cell surfaces and hence there is a proportional increase in the concentration of the truncated form of the tissue receptor (sTfR) in the serum. 62 Therefore, in the normal healthy condition, sTfR concentrations measure the absolute rate of erythropoiesis.
Usefulness of soluble transferrin receptor evaluation as a measure of iron status
In an early study to evaluate the role of serum sTfR measurements in the assessment of iron status, serial measurements of serum iron, TIBC, mean cell volume, erythrocyte protoporphyrin, serum ferritin and sTfR were performed by repeated phlebotomies in 14 normal volunteers. 6 sTfR concentrations did not change during depletion of storage iron, but when serum ferritin concentrations reached subnormal values (<12 μg/L) there was an increase in serum sTfR concentrations. The serum sTfR was more sensitive to the degree of functional iron deficiency than either the erythrocyte protoporphyrin or mean cell volume. The authors suggested that in assessing the iron status of a population, elevated serum sTfR is of particular value in identifying mild iron tissue deficiency of recent onset, serum ferritin concentrations are useful as a measure of iron stores, and haemoglobin concentration is a measure of advanced iron deficiency. 6 During the response to iron therapy, there is a transient increase in sTfR, perhaps because of an increase in erythroid marrow, followed by a reduction in sTfR, before an increase in haemoglobin can be seen. 8
The distinction between iron deficiency anaemia and the anaemia that accompanies infection, often called the anaemia of chronic infection or perhaps more correctly, anaemia of chronic inflammation, is difficult to identify because indicators such as ferritin are influenced by the acute phase response. sTfR is not an acute phase protein and concentrations remain in the reference range in anaemia of chronic inflammation, but sTfR concentrations may be slightly elevated in non-anaemic iron deficiency (9 mg/L), and more elevated in iron deficiency anaemia (25 mg/L). Therefore, sTfR distinguishes between iron deficiency anaemia and anaemia of chronic inflammation, because sTfR concentrations barely change in anaemia of chronic inflammation, but are very much increased in iron deficiency anaemia (Table 4).
Changes in serum concentrations of markers of iron status in iron deficiency anaemia (IDA), anaemia of inflammation (AOI) and the combination of both, where N indicates no change and the arrows indicate the direction of a change (Bultink et al.)47
The production of inflammatory cytokines, e.g. TNF-α in infection can suppress both haemopoiesis by inhibition of erythropoietin production, and erythropoiesis. 61 For example, in rheumatoid arthritis, a chronic inflammatory condition, serum sTfR concentrations can remain within reference ranges even when iron stores are depleted because cytokines can suppress erythropoiesis both directly or indirectly through inhibition of erythropoietin production. 63 Therefore, the relationship between iron status and sTfR concentrations in anaemia of chronic inflammation is inversely dependent on the degree of inflammation, since inflammation will depress erythropoietin production and marrow activity. 8
One hypothesis to explain the inhibition of erythropoiesis in anaemia of chronic inflammation suggests there is enhanced immune activation of T-cells and monocytes 64 to secrete pro-inflammatory cytokines and a local production of INF-γ. Activated monocytes produce higher concentrations of IL-12 than normal, which in turn stimulate type 1 CD4+ human T-cell (Th1) cells to produce TNF-α and INF-γ. INF-γ causes the early death of erythroid progenitor cells in the bone marrow and thus inhibits red cell production. Simultaneously, the production of the pro-inflammatory cytokines (IL-1, IL-6, TNF-α and INF-γ) from monocytes may interfere with iron metabolism reducing iron availability to the bone marrow resulting in functional iron deficiency. 64
Specific diseases, the acute phase response and iron
Asymptomatic malaria
Iron deficiency is common in many regions where malaria is endemic; hence the diagnosis of iron deficiency is complicated by the presence of malaria. Assessing iron status in malaria-endemic areas presents difficulties even in asymptomatic and apparently healthy individuals. Constant exposure to malaria parasites induces varying levels of immunity in a population, such that asymptomatic and apparently healthy adults and older children may have malaria parasites in their blood. The presence of parasites can produce a chronic or mild acute phase response, even in an asymptomatic individual, resulting in elevated serum ferritin concentrations. Asymptomatic malaria may also be associated with increased erythropoietin and sTfR concentrations, if there is any haemolysis of red cells.
Assessment of iron status in malaria-holoendemic areas
In a study of pre-school children on Pemba Island, Zanzibar where Plasmodium falciparum is holoendemic, indicators of iron status were measured. 65 Although all children studied were clinically well on the day of assessment, the authors found that >75% of children had malaria parasitaemia and anaemia was highly prevalent (80% with haemoglobin <100 g/L). In children <30 months old, male sex, recent fever and malaria parasite density were strongly inversely related to haemoglobin concentrations (P = 0.000 in all relationships) perhaps because the children were unable to increase erythropoiesis for several possible reasons: iron deficiency, folate deficiency, insufficient erythropoietin production or cytokine-mediated suppression of the bone marrow response to erythropoietin. In children≥30 months there was no association between haemoglobin and sex or malaria parasite density, and the relationship with recent fever was smaller. In the same study, serum ferritin was higher with greater malaria parasitaemia in children <30 months old, but there was no association in children≥30 months, although recent fever was associated with higher concentrations of serum ferritin in the older age group. 65 The authors speculated that age-dependent immune mechanisms might protect older children e.g. secretion of TNF-α is reduced with age, and modify the effect of sub-clinical parasitaemia, but the association between serum ferritin and fever remains with increasing age because of the acute phase response.
In the same study, serum sTfR concentrations increased with the level of parasite density suggesting children with higher parasitaemia had more haemolysis, which reduced red cell mass thus stimulating erythropoiesis, and was a physiological response to the anaemia of malaria. 65 However, serum sTfR was lower in severely anaemic children with malaria parasites than in severely anaemic children without malaria parasites and suggested cytokine-induced suppression of haemopoiesis inhibiting erythropoietin production.
In an earlier study of 3605 older children (mean [SD] age 10.5 [1.8] years) in Zanzibar, iron status was assessed by measuring haemoglobin, erythrocyte protoporphyrin and serum ferritin concentrations. In highly endemic areas of Africa, a parasite concentration of more than 5000 parasites/μL blood is thought to be predictive of clinical disease. The prevalence of P. falciparum parasitaemia was high for this population, but parasite density was low, as 99% of the children described in the study had parasite densities <5000 parasites/μL blood. 66 Neither haemoglobin nor erythrocyte protoporphyrin concentration was associated with malaria parasite density. Stoltzfus et al. 66 found no relationship between serum ferritin concentrations and parasite densities <1000/μL blood, but above this serum ferritin concentrations increased at a rate of 1.5 μg/L per 1000 parasites. Ferritin was positively associated with haemoglobin and negatively associated with erythrocyte protophoryrin and this relationship was maintained regardless of malarial parasite density. The authors suggest that assessment of iron status using haemoglobin, erythrocyte protophoryrin and serum ferritin in school-age children in a malaria-holoendemic area was valid, as malarial parasitaemia in this population is infrequently associated with disease and the iron indicators were not biased by the presence of malaria.
Assessment of iron status in areas with seasonal malaria
In a study population of apparently healthy pre-school children in Kenya, the prevalence of malaria was lower (18%) than in Zanzibar (75%) and was seasonal. 67 Children with high serum CRP concentrations (≥8 mg/L) had higher serum ferritin concentrations (geometric mean: 25 μg/L) compared with children with lower CRP concentrations (CRP <8 mg/L), when the serum ferritin geometric mean was 9.4 μg/L (P = 0.002). Serum sTfR concentrations were inversely related to haemoglobin (P = 0.02), but were not associated with serum CRP. The authors suggest that the inflammatory response to malaria was reflected in the high CRP and serum ferritin concentrations but the lack of association between CRP and sTfR, even after adjustment for confounding factors of malaria, suggested that inflammation did not affect serum sTfR. However, the association between elevated serum sTfR concentrations and low haemoglobin concentrations is consistent with the idea that malaria-induced haemolysis leads to increased erythropoiesis as is likely to happen in all other conditions where there is increased red cell lysis e.g. glucose 6-phosphate dehydrogenase deficiency, sickle cell anaemia, thalassaemia. 68–70
Several studies report that elevated sTfR concentrations in people with asymptomatic and mild malaria. 65,66,69,71 However, Verhoef et al. 67 suggest that because the haemolysis was malaria-induced, elevated sTfR concentration may not be a useful measure for detecting iron deficiency in individuals with malaria and further studies are needed to elucidate the relationship between sTfR concentrations and iron deficiency in malaria.
Odunukwe et al. 72 proposed that serum ferritin could be a useful marker of iron stores during asymptomatic malaria, if corrected for parasitaemia. They suggested that there is a linear relationship between serum ferritin and malaria parasite density in apparently healthy adults, irrespective of the Plasmodium species, and that ferritin can be corrected using the following formula:
Measured serum ferritin concentration − (0.08 μg × malaria density) = actual serum ferritin concentrations (μg/L), where malaria density is measured in counts/μL blood. However, although the DAKO sandwich ELISA ferritin assay was calibrated using a standard from the National Institute for Biological Standard and Control (UK) the usefulness of this formula has not yet been confirmed by other workers.
Human immunodeficiency virus and anaemia
HIV-1 has a bigger impact on haemopoiesis than most infectious agents. Anaemia, a frequent complication of HIV-1, increases in severity as the disease progresses and is often a negative prognostic indicator in infected patients. 61 This phenomenon was described in a large prospective study across Europe (EuroSIDA), 73 when it was reported that lower haemoglobin concentrations were associated with a much faster rate of disease progression. 73
Anaemia in HIV is thought to be related to immunological alterations of iron metabolism rather than iron deficiency, 2 as was reported in a cross-sectional study of 63 HIV+ adults, in which low haemoglobin concentrations were associated with low erythropoietin, transferrin and TIBC, and with high ferritin, INF-γ, neopterin and ß2-microglobulin concentrations. 74 The authors suggested that endogenous release of cytokines, such as INF-γ, which inhibit erythropoiesis, may be one underlying cause of anaemia in HIV+ subjects. A second study reported that the haemoglobin concentrations increased following treatment with antiretroviral combination therapy and were associated with a decrease in immune activation i.e. lower TNF-α and neopterin concentrations and disease progression i.e. as monitored by a slower fall in CD4+ cell counts. These parameters did not change in those not receiving treatment, suggesting a cause–effect relationship between immune activation and anaemia in HIV. 75
Human immunodeficiency virus and iron loading
Frequently, haemoglobin and serum iron concentrations decrease and ferritin concentrations increase with HIV progression. Ferritin concentrations negatively correlate with CD4 counts and are highest in individuals with AIDS. 76 These changes are accompanied by progressive iron loading in macrophages, endothelial and other cells and at the more advanced stages in bone marrow, the brain and other organs. 77 The main cause of the iron loading is a chronic acute phase response initiated by cytokines that stimulate iron retention by the reticulo-endothelial system, and possibly causing an iron-mediated oxidative stress in subjects with HIV. 77 The diversion of iron from the circulation into the reticulo-endothelium system also results in a reduced availability of iron for erythroid progenitor cells and haem synthesis. 75 Because iron is needed for lymphocyte activation and proliferation, changes in iron status may depress the immune system in HIV by withholding iron, which is not true iron deficiency, hence altered immune function related to iron metabolism and not iron deficiency might be a special problem in patients with HIV. 78
Human immunodeficiency virus and acute phase proteins
The results from a number of studies suggest that infection by HIV alone can elicit an acute phase response, but overall, the acute phase response in asymptomatic HIV is mild. 74,78–83 In a study of children with HIV infection, without secondary infection, Jahoor et al. 84 found that the acute phase response may be different from the response elicited by bacterial infections because the higher concentrations and faster synthesis rates of the positive acute phase proteins were not accompanied by lower concentrations and synthesis rates of the negative acute phase proteins. The results from the child study confirmed earlier data from the same author from asymptomatic HIV-infected adults. In that study, the authors reported higher plasma concentrations of CRP, fibrinogen and haptoglobin and increased fractional synthetic and absolute synthetic rates for both fibrinogen and haptoglobin, but no difference in the plasma concentrations of the negative acute phase proteins, RBP, albumin or transthyretin between healthy controls and HIV-infected people. 82 Holmes et al. 85 also found no difference in the plasma concentrations of three negative acute phase proteins, albumin, RBP and transferrin between a group of asymptomatic HIV men and a control group.
Serum ferritin and human immunodeficiency virus
Serum ferritin concentrations are higher in HIV+ than in non-infected subjects and the more advanced the disease the more elevated the concentrations. 2 In a study of HIV+ children with advanced disease, elevated ferritin concentrations (>100 μg/L) were found in 93% of the children, and further increases in ferritin concentration always came before or accompanied disease progression. 86 In addition, serum ferritin concentrations were associated with disease progression and immune activation in a study of HIV adult patients with advanced disease. 75 Elevated ferritin concentrations were strongly associated with immune activation at baseline, as indicated by high serum neopterin and soluble TNF-receptor concentrations. Following treatment with a combined antiretroviral therapy, a reduction in immune activation correlated with a reduction in serum ferritin concentrations. The authors reported that their findings supported the hypothesis that serum ferritin synthesis is up-regulated by the pro-inflammatory cytokines that divert iron into the reticulo-endothelia system and limit the iron available to erythroid cells.
In a study using apparently healthy adults with HIV in Kenya, higher median plasma ferritin concentrations (5-fold) were reported when both CRP and AGP concentrations were high, and when AGP concentrations alone were high there was a three-fold increase when compared with a reference HIV+ group with no elevated acute phase proteins. 87 The authors used the relationship between the acute phase proteins and plasma ferritin to calculate gender-specific correction factors to remove the influence of inflammation from plasma ferritin concentration (Table 5). The corrected median ferritin values for both the men and women were still higher than mean plasma ferritin concentrations for non-HIV+ adults (84 μg/L men and 31 μg/L women) living in the same area of Kenya. 87
Use of correction factors to remove influence of inflammation from plasma ferritin concentrations from apparently healthy HIV-1 positive adults (modified from Thurnham et al.) 87
*Data corrected by multiplying individual ferritin results by the correction factors for the respective groups
†High C-reactive protein (CRP) concentrations >5 mg/L, high α-1-acid glycoprotein (AGP) concentrations >1.0 g/L
‡Correction factors calculated by dividing median of the individual acute phase groups by that of the respective reference group for the two sexes separately
Soluble transferrin receptor and human immunodeficiency virus
The circulating sTfR concentration is proportional to cellular expression of the membrane-associated TfR and increases with increased cellular iron needs and cellular proliferation. Under normal conditions when iron is abundant, few sTfRs are expressed on the cell surface; when cytosolic iron is low, iron-regulatory proteins bind to mRNA and promote the expression of sTfR. 88 In vitro experiments have demonstrated that HIV can affect cellular iron metabolism by increasing the pool of cytosolic iron and also showed that changes in the immune system are similar to those in iron excess as there is loss of CD4+ T-lymphocytes and an increase in CD8+ T-lymphocytes. 76 In an experimental model, lymphoid cell lines were infected with acute HIV-1 infection. 89 The results of the experimental model showed that the expression of the surface TfR was lower in cells infected with acute HIV-1 than in uninfected cells and this was associated with the viral disease load. Citrate, a molecule that can chelate iron, dose-dependently prevented the down-regulation of surface TfR but only inhibited HIV-1 replication by 23–30%. Because chelatable iron is required by the virus for replication, the down-regulation of sTfR in HIV-1 positive cells might be an important area for virus/cell interaction.
Although there are many studies on the effect of HIV at the cellular level, limited data are available on the measurement of serum sTfR concentrations in HIV. In a study of two groups of HIV+ adults, sTfR did not appear to be affected by HIV infection, as sTfR did not correlate with HIV disease progression or immune markers. 76 Another study of HIV adults with advanced disease reported that sTfR concentrations were not correlated with disease progression (decline in CD4+) or immune activation markers (neopterin concentrations and TNF-receptors). 75 However, during treatment with antiretroviral therapy, sTfR concentrations increased and independently predicted an increase in haemoglobin. The treatment with antiretroviral therapy decreased viral load; a change that probably caused a reduction in cytokine activity (TNF and INF-γ) and an increase in erythropoiesis.
Conclusion
Serum ferritin and sTfR are probably the most useful biomarkers for measuring iron status but inflammation has important effects on these biomarkers, which are discussed in this review;
Normally, the synthesis of ferritin is regulated post-transcriptionally by intracellular iron concentrations by means of the iron-regulatory proteins, which interact with the iron responsive elements of ferritin mRNAs. However, serum ferritin concentrations are elevated during inflammation and appear to be the result of cytokine stimulation, independent of intracellular iron;
The increase in serum ferritin concentrations during inflammation is similar to that of the positive acute phase protein, CRP. Consequently, serum ferritin in the reference range can only be certain to reflect iron sufficiency in the absence of inflammation. Interpretation of serum ferritin concentrations is problematic in populations where the incidence of infection or inflammation is high;
In the studies cited, serum ferritin concentrations behaved like a fast-acting positive acute phase protein at the beginning of the acute phase response and paralleled the changes in concentration of serum CRP. However, in the later stages of the acute phase response, when the fast acting acute phase proteins (e.g. CRP) are decreasing, but the slower acting acute phase proteins (AGP) are still elevated, ferritin remained elevated, behaving more like the slower reacting acute phase protein;
Thus, in the initial phase of infection serum CRP concentrations may predict the behaviour of serum ferritin and in the later stages of inflammation serum AGP concentrations could be used to adjust for the confounding effects of the acute phase response on serum ferritin concentrations;
Elevated concentrations of sTfR are good indicators of tissue iron deficiency, and are independent of iron stores measured by serum ferritin concentrations;
sTfR concentrations are not elevated in cases in which anaemia is due to inflammation; therefore, changes in sTfR concentration can distinguish between iron deficiency anaemia and anaemia of chronic inflammation. However, when iron deficiency anaemia and anaemia of chronic inflammation are both present, sTfR concentrations are elevated, irrespective of the acute phase response;
The relationship between sTfR concentrations and erythropoietic activity is inversely dependent on the degree of inflammation because inflammation can depress erythropoietin production and erythropoiesis;
Serum ferritin provides the best approach to measuring iron status in populations where exposure to inflammation/infection is not common. Where infection is seasonal, then population assessments should be done in the season of lowest disease transmission. Where infection is common then two acute phase proteins should be measured as well as serum ferritin, either to correct ferritin or remove cases where inflammation is present (as long as this does not bias the population sample);
However, more information is needed to interpret iron status as a result of an acute phase response. The report from the WHO/CDC consultative group on the use of iron indicators for population assessment suggests the use of a meta-analysis to explore the possibilities of using one or two acute phase proteins to correct ferritin in the presence of inflammation.
Footnotes
Acknowledgements
These findings and conclusions in this review are those of the author and do not represent the views of the CDC.