
Abstract
Abstract
Background
Currently, there is no ‘gold standard’ for detecting patients with sensitivity to lactose. Biochemical investigation by a breath hydrogen test alone detects <50% cases. Breath methane and symptoms are not recorded as standard practice. The clinical value of analysing C/T13910 and G/A22018 polymorphisms, strongly associated with lactose sensitivity, has not been established.
Methods
Two hundred and ten patients with unexplained gut and systemic symptoms and controls were challenged with 50 g lactose. Breath hydrogen and methane were measured and symptoms recorded. All were genotyped for two polymorphisms, C/T13910 and G/A22018.
Results
CC13910/GG22018 in 14.5%, CT13910/GA22018 in 39% and TT13910/AA22018 in 46.5%. One hundred percent of CC13910/GG22018 were lactose sensitive having a breath hydrogen >20 ppm within 6 h and symptoms. But the breath hydrogen test lacked sensitivity and specificity in the other groups. There was elevated breath hydrogen in 21% of CT13910/GA22018 and 15% of TT13910/AA22018 by 6 h, whereas 17 and 30.9% had elevated breath methane alone. Breath methane and breath hydrogen with clinical symptoms improved sensitivity and specificity, increasing detection of lactose sensitivity in genotypes CT/GA and TT/AA from <50 to >75%.
Conclusions
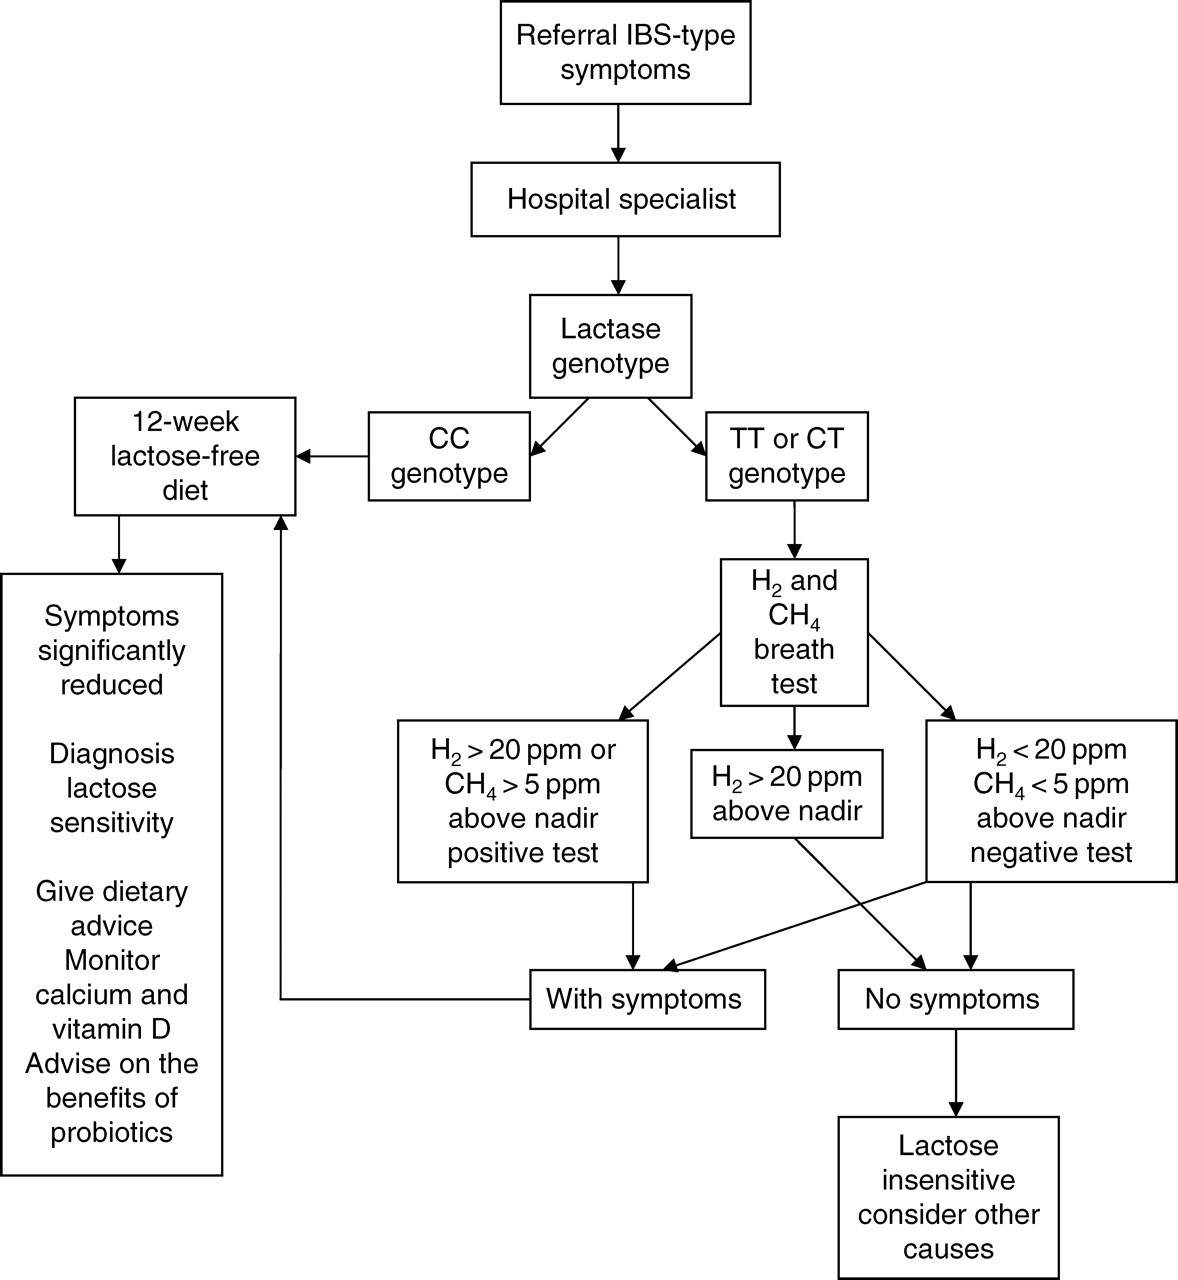
The data presented define the current best practice for the clinical identification of lactose sensitivity. Patients were first genotyped. Those identified as CC with symptoms should immediately undertake a 12-week lactose-free diet. Those identified as CT or TT should undertake a breath hydrogen and methane test. Those positive for hydrogen or methane along with symptoms or with symptoms only, should also undertake a lactose-free diet. Those with high hydrogen without symptoms should be investigated for causes other than lactose sensitivity.
Introduction
The condition of lactose intolerance has been recognized medically for over a century. However, in spite of extensive biochemical and clinical investigations there is no current ‘gold standard’ for the identification and diagnosis of patients sensitive to lactose. The principal reason for this is that biochemical investigations have tried to separate out two groups, lactose intolerant and lactose tolerant. However, three principle genetic groups have now been identified associated with hypolactasia.
1
Within these genetic groups, variable lactase expression has been demonstrated by comparison with intestinal biopsy samples, homozygous lactase persistence giving high lactase, homozygous lactase non-persistence low, and heterozygous lactase persistence being intermediate.
1,2
It is now clear from our data that there is a high individual variation, both within and between the genetic groups, in the threshold to lactose that results in symptoms. Therefore, the conventional terms ‘lactose intolerant’ or ‘lactose tolerant’ are clearly now erroneous.
3
As such, we have used the terms ‘lactose sensitive’ (LS) or ‘lactose insensitive’ in order to make our data clear. As a result, the current clinical management is inadequate due to failure in identifying how many patients have a low lactose threshold and what their individual sensitivity is.
4–12
Many thousands of patients present each year to a range of specialties with a combination of unexplained gut and systemic symptoms.
13,14
The possibility that these might be due to lactose sensitivity has been missed
5,6,8,14
because:
There are inconsistent clinical guidelines for the biochemical investigation and clinical symptom assessment; It has been reported that the hydrogen breath test lacks sensitivity and specificity (sensitivity 37% at 1 h to 95% at 3 h; specificity 62–67% for up to 5 h when using lactose instead of milk).
15
The sensitivity of the hydrogen breath test is reduced further when undertaken with milk instead of lactose and is subject to huge interindividual variation.
7,9,11–15
Many studies have attempted to determine how many false-positives (FP) and false-negatives (FN) this test reveals.
10,11–16
Some individuals do not have the necessary colonic bacteria to generate hydrogen. A decrease in pH in the colon can also reduce or abolish the hydrogen response. Colonic methanogens use hydrogen to generate methane, reducing further the output of hydrogen. Stool pH or lactase activity measurement from intestinal biopsy samples are not conclusive evidence of the degree of a patient's lactose sensitivity;
17
Until now there are no established biochemical mechanisms to explain irritable bowel syndrome (IBS), unexplained abdominal symptoms and other systemic symptoms caused by food sensitivities;
5–7,18,19
Failure to diagnose sensitivity to lactose often occurs because symptoms recur even after removing dairy products from the diet. This is flawed because there has been a dramatic increase in lactose added to a large number of foods and drinks without being on the label, the daily amounts consumed often being greater than a glass of milk (11.8 g/250 mL);
4,6,8,12,20–22
No clinical value of genetic markers has been established for lactose sensitivity.
1,2,23–26
Lactose sensitivity in clinical practice
Fifty percent of referrals to hospital gastroenterologists are patients labelled IBS with unexplained abdominal and other symptoms. 17 These patients often undergo unnecessary diagnostic investigations resulting in multiple hospital visits. Furthermore, significant numbers of these patients have abdominal and systemic symptoms due to lactose sensitivity. 27 Lactose sensitivity is caused by inadequate digestion of lactose, β-galactose 1,4 glucose – the sugar in milk, because of variable low concentrations of lactase enzyme (lactase phlorizin-hydrolase, EC 3.2.1.62/108) in the small intestine. All populations, except white northern Europeans (Caucasians) and some ethnic groups lose 80–90% of lactase within a few years of weaning. 23,24,28–30 Thus, some 70% of the world adult population are hypolactasic when compared with 30% in the USA and 10–15% of white northern Europeans. Lactase can also be lost as a result of secondary causes including small-intestinal conditions such as Crohn's or coeliac disease, gut infection, imbalances in thyroid or sex hormones or ageing. 5–12,20,23,24,28–30 However, hypolactasics can ingest some milk without causing some symptoms. 11
The genetics of hypolactasia
Primary hypolactasia occurs due to a congenital deficiency (rare and life-threatening) or adult-type hypolactasia postweaning (common and non-life threatening). The human lactase gene is located on the long arm of chromosome 2 (2p21q). Regulation involves both transcriptional and post-transcriptional mechanisms, a cis-acting element controlling the appearance of lactase just before birth. No controlling mechanism has been described for hypolactasia due to loss on weaning. Single nucleotide polymorphisms (SNPs), C/T13910 and G/A22018, strongly associated with adult-type hypolactasia have been located within introns 13 and 9 upstream of the lactase-coding region, respectively. Phenotypically, patients with the lactase non-persistence genotype CC/GG and abdominal symptoms have increased lactose sensitivity regardless of ethnicity. Prior to the discovery of these SNPs it was impossible to identify patients with this genetic trait. We estimate that up to six million people in UK alone may be affected. The polymorphisms C/T13910 and G/A22018, which are in linkage disequilibrium lie in a region upstream and distinct from the lactase-coding region, were found in introns of the helicase MCM6 in a coding region associated with cell cycle regulation. In contrast, insertions/deletions and SNPs associated with congenital hypolactasia have recently been described in the lactase-coding region. 31
The aim of this study was to establish the ‘current best practice’ to identify patients with a low threshold to lactose, who as a result suffer repeatedly with abdominal and other symptoms. The strategy was first to separate patients into the three principal genetic groups and then compare breath hydrogen and methane with symptoms when given a standard dose of lactose. 1,2,25,26,30 The study was based on a discrete cohort of patients referred with persistent IBS type symptoms that were not diagnosed by conventional clinical, Rome II criteria, 17 other biochemical investigations, or were not responsive to drug treatment. These were compared with a matched control group with no gut or systemic symptoms identified from hospital staff volunteers.
Methods
Patient selection
Of the 210 patients selected for the study referred sequentially with unexplained gut and systemic problems, 164 were women and 46 men. Of these, 10 (2 men and 8 women) refused dietary management or did not return for follow up. Two hundred patients were investigated for lactose sensitivity of which 156 were women and 44 men (age range 4–69 years; mean 45.6 ± 15.2 years). Controls were white European and comprised 11 women and four men (age range 25–60 years; mean 40.7 ± 13.9 years). The referrals came from gastroenterologists (75%), other hospital physicians (15%), and primary care physicians (10%). Fifteen controls were randomly selected from hospital staff volunteers on the basis of no medical history of bowel problems, no current medical conditions and took a mixed diet. Any control subjects with gut or systemic symptoms were excluded. This was an observational study carried out using rigorous clinical criteria, and blinding of data analysis to avoid bias. The patient group ethnic origins were Caucasians (179), Indians (9), Afro-Caribbeans (2), Arabs (2), West Indians (4), Spanish (1), Italian (1), Slovakian (1) and Maltese (1). The dropouts were Caucasians (8), Arab (1) and Indian (1).
Symptom scoring and clinical diagnosis of lactose sensitivity/insensitivity
Lactose sensitivity or insensitivity was diagnosed clinically on the basis of symptoms score induced by 50 g oral lactose, followed by a clinical judgement of a sustained, significant symptom relief after 12 weeks on a true lactose-free diet. The mean number of symptoms exhibited by patients within each group were recorded: (1) within the month prior to the test (symptoms before test); (2) occurring during the 48 h following a 50 g (1 g/kg if weighing <50 kg) lactose challenge, equivalent to approximately 1 L of milk after an overnight fast (symptoms during test using an adaptation of a published questionnaire); 11 (3) after a 12-week lactose-exclusion diet (symptoms post-lactose exclusion) (Tables 1 and 2). Six gut symptoms (abdominal pain, diarrhoea, bloating, flatulence, nausea and constipation) and 12 systemic symptoms (headache, fatigue, muscle and joint pain, loss of concentration, itching skin rash or eczema, rhinitis, asthma, sore throat, heart palpitations, increased frequency of micturition, mouth ulcers, hot and cold episodes) were recorded. Different investigators recorded (1), (2) and (3) to avoid bias. Each patient filled out a chart recording the time and estimating the severity of each symptom after the lactose load on a scale 0–10. The severity rating was based on validated scores for other clinical conditions (0, no symptoms; 1–3, annoying; 4–6, discomfort; 6–8, having to stop and sit down; 10, severe). The patients were seen in the clinic the following week and dietary intervention commenced. The diet was not just dairy-free but also free from hidden lactose in foods and drinks. Patients were seen again after 4 weeks and then 12 weeks; the diagnosis of lactose sensitivity being made at this point if dietary exclusion of lactose had caused significant, sustained improvement in symptoms, using the severity scale. The controls underwent the same lactose challenge, symptom questionnaire and DNA testing.
Lactase non-persistence genotyping
Genotypes were determined by restriction fragment length polymorphism analysis of polymerase chain reaction (PCR)-amplified DNA.
7
Patient DNA was extracted from EDTA blood samples (Qiagen Ltd, Sussex, UK), diluted in 10 mmol/L Tris–HCl; 0.5 mmol/L EDTA; pH 9.0, used immediately or stored at −20°C. DNA sequences were obtained from the UCSC genome assembly version hg16 (
Breath data analysis
Breath hydrogen and methane were analysed in a single sample of alveolar air using a MicroLyzer Model SC (Quintron, Milwaukee, WI, USA). Hydrogen and methane in the patients' samples were separated by gas chromatography and detected by sensors within the instrument (within-batch patients' coefficient of variation was 5–10% for hydrogen and up to 18% for methane). A thermal conductivity detector also measures carbon dioxide (CO2) in the sample and a correction factor was applied to account for any dilution of alveolar CO2 with dead space or inspired air during collection. Hydrogen and methane were assessed as positive (high) if >20 ppm and >5 ppm above the nadir, respectively (Table 1). Many studies have used comparisons with time 0 to assess positivity of the test. However, pre-analytical factors such as smoking, non-compliance with dietary restriction, diabetes and bacterial overgrowth may lead to high hydrogen and methane at time 0. In order to improve the assessment of positivity during the breath test, we interpreted a rise above the nadir during the test as being positive.
Breath hydrogen and methane in the principal genetic groups related to lactose sensitivity
Definitive diagnosis of lactose sensitivity was based on a substantial improvement in the number and severity of symptoms after 12 weeks of complete exclusion of lactose from the diet, including hidden lactose, as described in Methods
PV+, positive predictive value; PV−, negative predictive value
All values were calculated as the difference between the peak and nadir breath hydrogen or methane within 6 h of ingesting 50 g of oral lactose (1 g/kg if weight <50 kg). Percent was calculated from the proportion of patients within the particular group. Data were then grouped for lactase genotype and as LS or insensitive. The breath data were analysed for true-positives (TP) = positive breath test in a patient diagnosed with lactose sensitivity; true-negatives (TN) = negative breath test in a patient without lactose sensitivity; FP = positive breath test in a patient without lactose sensitivity; FN = negative breath test in a patient diagnosed with lactose sensitivity; sensitivity (%) = (TP × 100)/(TP + FN), where TP + FN = total number of patients diagnosed clinically with lactose sensitivity; specificity (%) = (TN × 100)/(TN + FP), where TN + FP = total number of patients diagnosed clinically as not having lactose sensitivity. The positive predictive value (PV+) % = (TP × 100)/(TP + FP) and negative predictive value (PV−) % = (TN × 100)/(TN + FN) (Table 1). Peak breath hydrogen (a) and peak breath methane (b) above the nadir were grouped for lactase genotype and are shown as LS or insensitive (n = 200 for [a] and n = 155 for [b], Figure 1). Breath hydrogen and methane data were statistically compared using the paired samples t-test and showed significant differences between patient results above and below the nadir (P < 0.0001). Friedman ANOVA (Friedman's statistic of 16.63, P = 0.0002, two-tailed P ≤ 0.0001) revealed a significant difference in breath hydrogen between the principal genetic groups (Table 1). No significant difference between any of the principal genetic groups was revealed for methane (two-tailed P = 0.56 and P = 0.106 for CC/GG versus CT/GA and TT/AA, respectively) (‘Analyse-it + General 1.71’ [Microsoft Excel]).
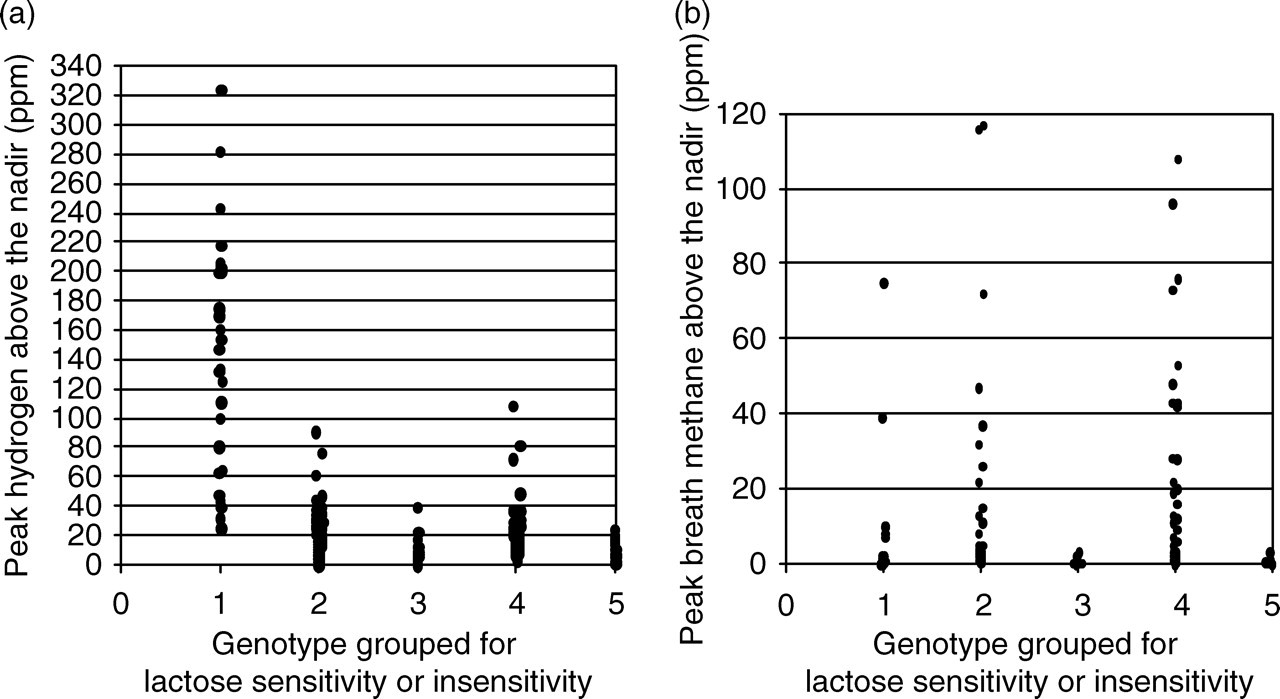
Breath hydrogen and methane in the different genetic groups. Dot plot of peak hydrogen above the nadir (a) and peak methane above the nadir (b). Group 1 = CC/GG (sensitive, n = 29 for [a], n = 23 for [b]); Group 2 = CT/GA (sensitive, n = 65 for [a], n = 51 for [b]); Group 3 = CT/GA (insensitive, n = 13 for [a] and n = 10 for [b]); Group 4 = TT/AA (sensitive, n = 71 for [a] and n = 55 for [b]); Group 5 = TT/AA (insensitive, n = 22 for [a] and n = 14 for [b]). While breath hydrogen >20 ppm was observed in five lactose insensitive patients (n = 36), breath methane >5 ppm was not observed in any lactose insensitive patients (compared with data from Table 1b)
Results
Polymorphism analysis, breath hydrogen and methane related to lactose sensitivity
All the patients were first genotyped for the C/T13910 and G/A22018 strongly associated with lactose sensitivity. 1 Of the 200 patients, 14.5% (29 patients) were homozygous CC/GG, 39% (78 patients) were CT/GA and 46.5% (93 patients) were TT/AA. The value of breath hydrogen and methane after a 50 g lactose challenge was then evaluated in the three principal genetic groups (see Methods; Table 1 and Figure 1). All CC/GG were classed as LS, 100% having high hydrogen and 25% high methane as well. Methane analysis did not add any extra to the hydrogen data in the CC/GG genotyped group. Only in this group was there a clear rise in mean breath hydrogen, revealing that current protocols for breath hydrogen testing for 2–3 h target this group only (Figure 2). Measurement of both hydrogen and methane at 6 h considerably improved sensitivity, specificity and the predictive value in CT/GA- and TT/AA genotyped patients only (Table 1; Figures 1 and 2). 32 Of the total, 83.3% of CT/GA were classed as LS. Of these, 69.8% had high hydrogen and 28.3% high methane after challenge; 76.3% of TT/AA were classed as LS and 71.5% had increased hydrogen and 40% increased methane. Taken together, these data reveal that raised methane after lactose challenge was an insensitive, but specific marker for lactose sensitivity. Twenty-three percent of CT/GA (3 patients) and 9.1% of TT/AA (2 patients) patients had raised breath hydrogen without raised methane and without symptoms from lactose (Table 1b). These patients were lactose insensitive and require further clinical investigation.
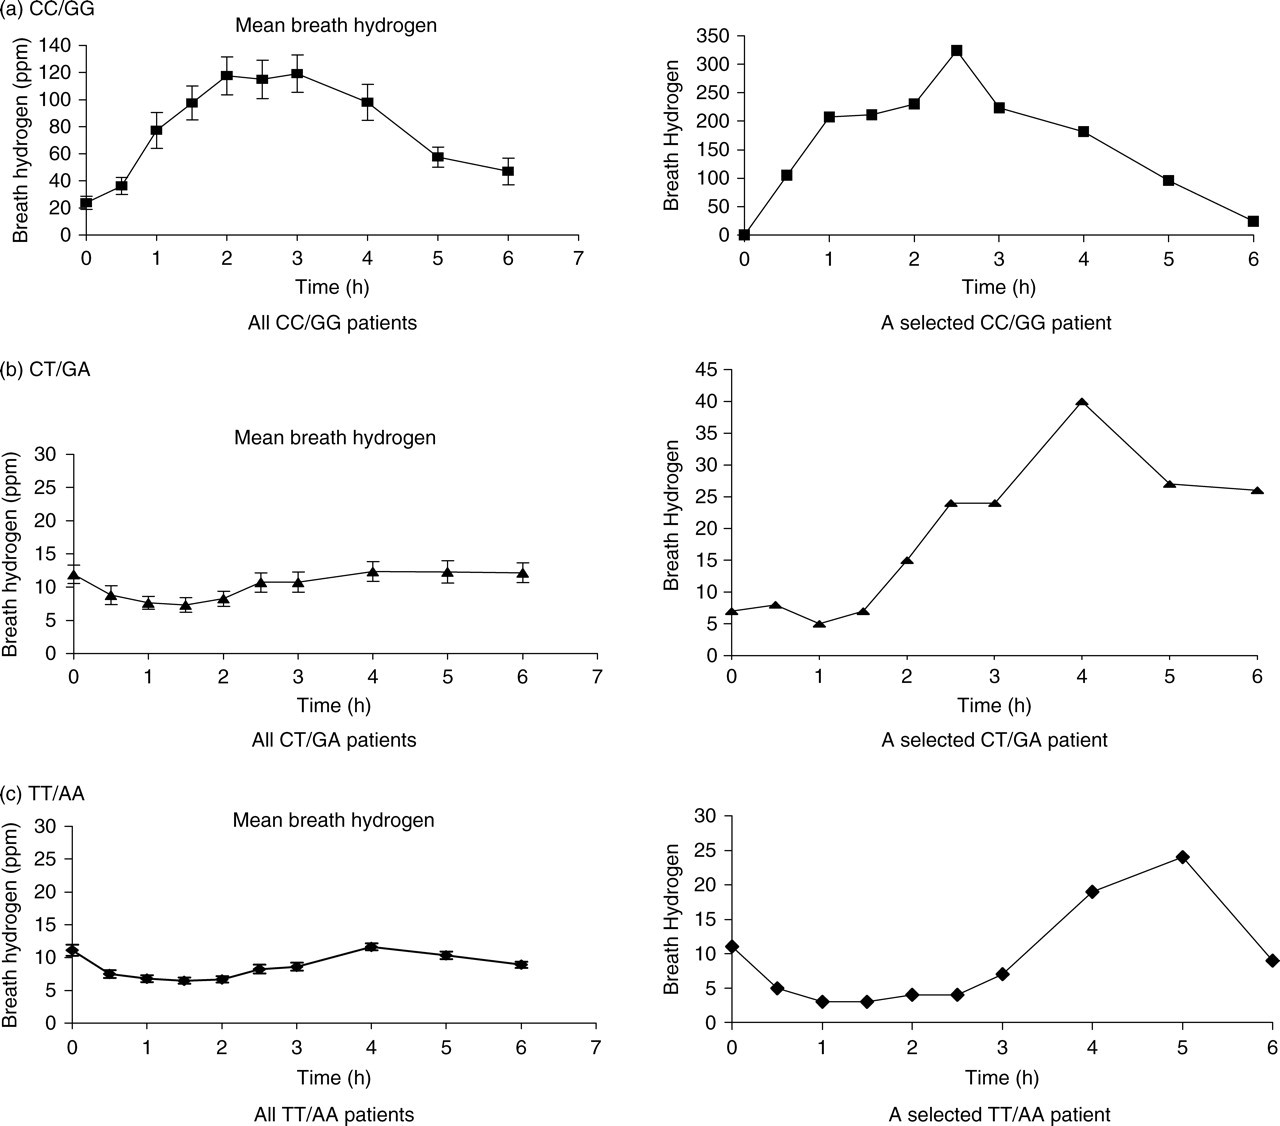
Effect of 50 g of lactose on breath hydrogen and methane in the three principal genetic groups. Hydrogen concentration in the breath samples was measured every 30 min after ingesting 50 g of oral lactose as described in Methods. Mean breath hydrogen results are shown to be associated with the principle polymorphisms for all patients in this study. (a) (▪) denotes CC/GG (n = 29); (b) (▴) denotes CT/GA (n = 78); (c) (⧫) denotes TT/AA (n = 93). One hundred percent of referred patients genotyped as GG/CC had a mean rise in breath hydrogen of >20 ppm above the nadir within 3 h. The breath hydrogen was substantially raised for the duration of the test (6 h). The mean breath hydrogen observed in the CT/GA group did not rise above 20 ppm within 3 h, although a rise similar to that observed up to 6 h for homozygous CC/GG patients was present in individual patients. For the homozygous TT/AA group, the mean breath hydrogen was below 20 ppm throughout the test, although individual rises of >20 ppm above the nadir was observed. A selected example of a patient from each principle group demonstrates the variability and timing of hydrogen generation during the test
The prevalence of the SNPs was consistent with data reported previously. 30 Only one patient was CC/GA. None were CT/AA. In the control group, with no history of gut or systemic symptoms none were CC/GG, 13% (2 people) were CT/GA and 87% (13 people) were TT/AA associated with lactase persistence. All in the control group were clinically diagnosed as lactose insensitive (Table 2).
Gut and systemic symptoms before and during a lactose breath test compared with symptoms post-dietary lactose exclusion
Patients were grouped according to genotype and eventual diagnosis of lactose sensitivity as described in Methods
Symptoms caused by lactose sensitivity
Lactase polymorphism analysis revealed that the current lactose breath test identifies the CC/GG genotyped patients. Our data also demonstrated that the specificity and sensitivity of the lactose breath test could be improved by measuring both hydrogen and methane in the CT/GA and TT/AA genetic groups (Table 1). We now needed to determine if recording symptoms before and during the test together with the results of a lactose-free exclusion diet added value to the diagnostic process. Of this specific cohort of patients, 82.5% referred with unexplained gut symptoms were LS (165 patients), reducing their total symptoms from 9–10 to 1–2 after 12 weeks on a lactose-excluded diet (Figure 3). Before the lactose challenge, patients with lactose sensitivities recorded significantly more symptoms when compared with those patients who were lactose insensitive (Table 2). Furthermore, the number of recorded symptoms in those patients who were LS was significantly higher during the test when compared with symptoms before the test and post-dietary lactose exclusion (P = 0.05 and P = 0.001, respectively). In contrast, this was not the case with lactose insensitive patients (P ≥ 0.5; Figure 3 and Table 2).
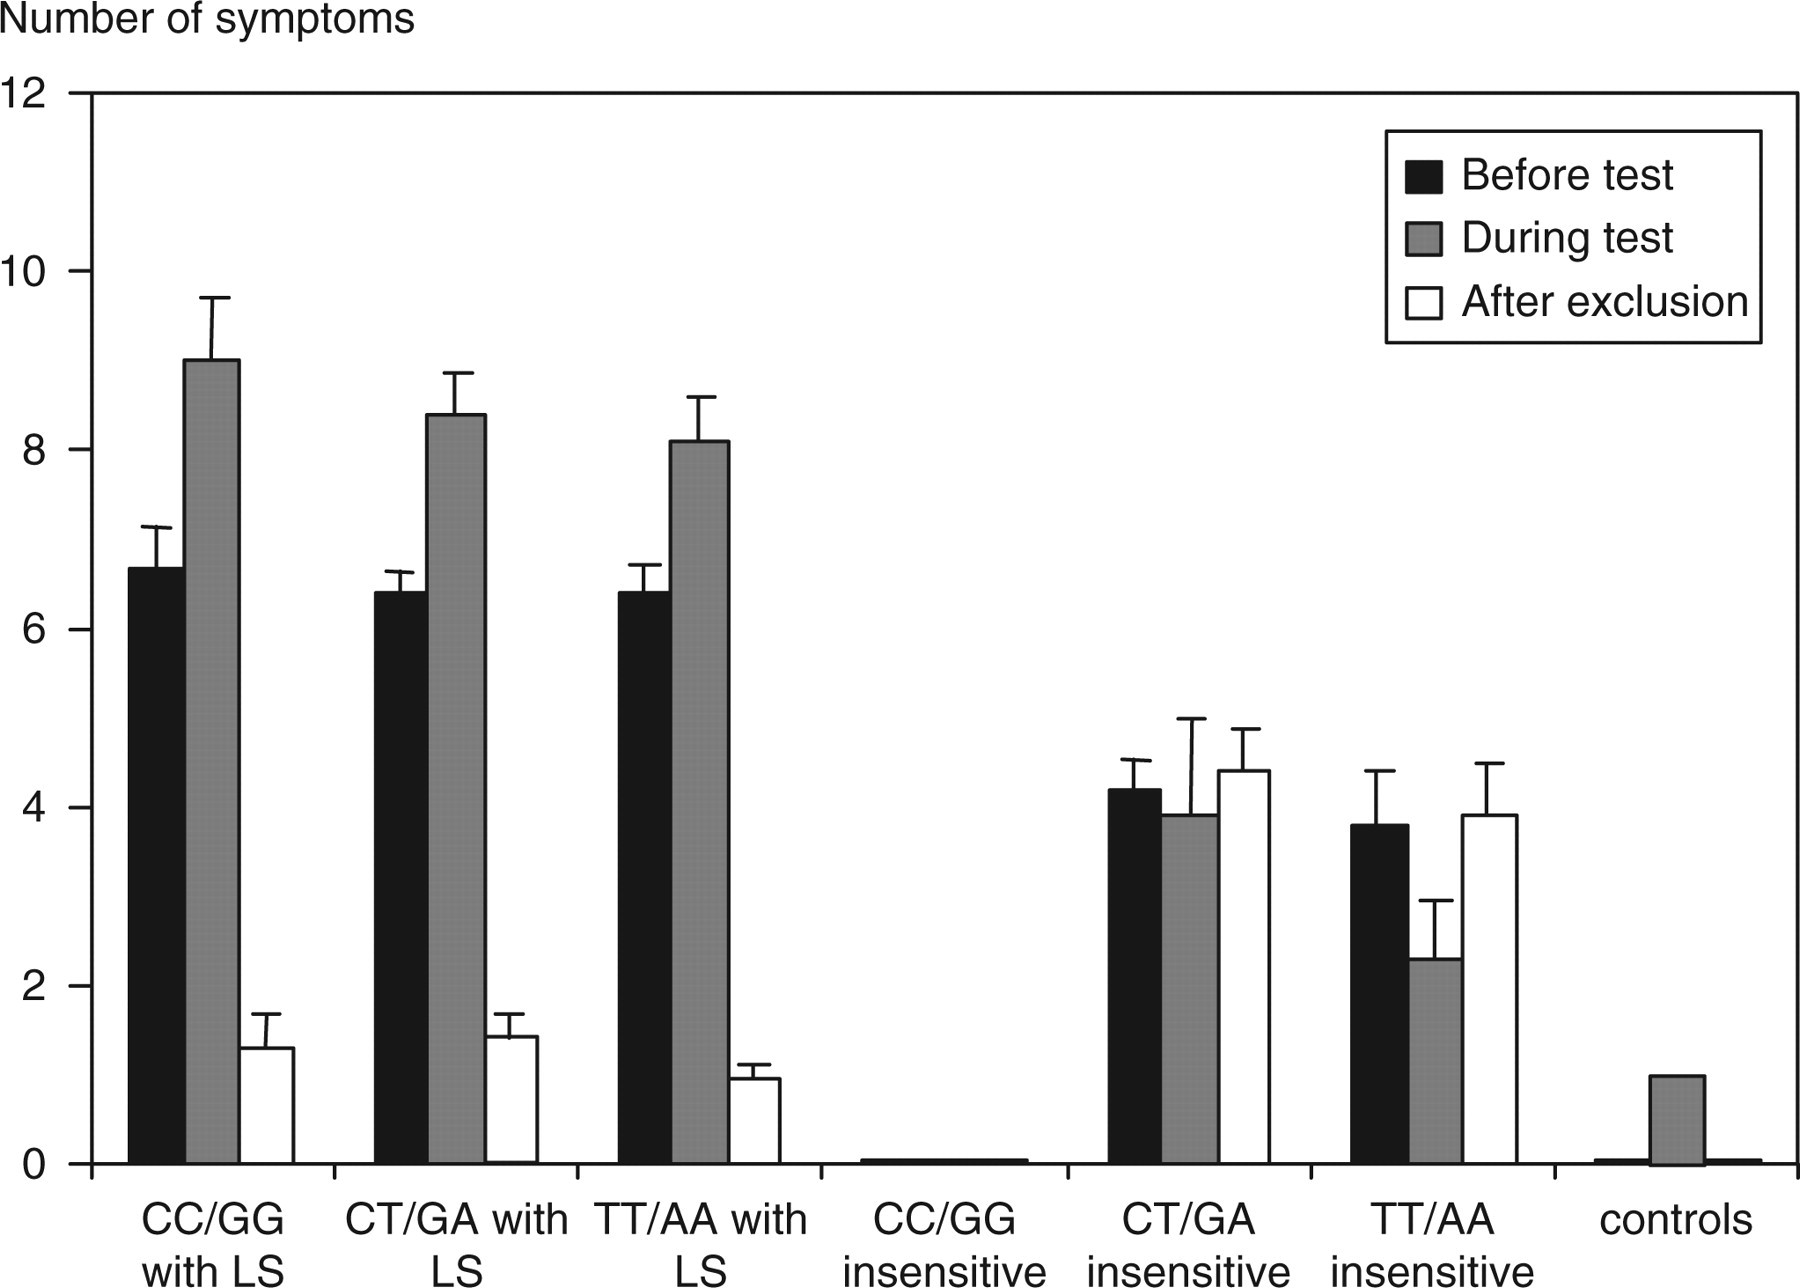
Number of symptoms recorded in the different genetic groups. The number of symptoms were recorded before, after ingesting 50 g of oral lactose (1 g/kg if weight <50 kg) and again after 12 weeks. The results represent mean ± SEM for three groups diagnosed as lactose sensitive (LS): CC/GG (100%), CT/GA (83.3%), TT/AA (76.3%); and two groups eventually diagnosed as lactose insensitive but still suffering from irritable bowel syndrome: CT/GA (16.7%), TT/AA (23.7%)
Of the referred patients, 17.5% (35 patients) showed no increase in symptoms after the lactose challenge and no improvement after 12 weeks without lactose (Table 2). The mean number of symptoms reported by these latter patients prior to the lactose load was half those recorded by the patients eventually diagnosed as LS. Some individuals in the control group showed some symptoms after the lactose load (50 g), highlighting the importance of assessing individual patient lactose sensitivity (Table 2 and Figure 1). 33
Discussion
The results here show that C/T13910 polymorphism analysis together with breath hydrogen and methane analysis and recording clinical symptoms should now be used as the ‘current best practice’ in the biochemical investigation of lactose sensitivity (Figure 4). This new ‘standard’ clarified the diagnosis of lactose sensitivity. Analysis of C/T13910 only is required, as G/A22018 had identical correlations and the genotype prevalence was consistent with other studies.
34
However, the lactase genotype does not provide definitive diagnostic information for patients typed as CT/GA or TT/AA.
27
Our data highlight that previous biochemical investigation for lactose sensitivity missed patients due to:
Failure to clinically determine a patient's lactose threshold; Failure to adequately account for individual patient's dietary lactose consumption (including hidden lactose in foods, medications and pharmaceuticals); Variations in the lactose breath-testing procedures; High variation in the number and type of symptoms recorded after ingestion of lactose; Variation in the timing of the symptoms experienced post-lactose ingestion.
Most patients had undergone endoscopic and or barium studies with no abnormalities detected. Many were previously labelled as IBS. The majority of our patients were white northern Europeans (85%). The ethnic distribution and epidemiology of the two C/T13910 polymorphisms now need to be examined, together with the incidence of systemic symptoms. It has been shown that homozygous CC/GG have low lactase, homozygous TT/AA are lactase persistent and heterozygous CT/GA are intermediate.
1,2,25,30
However, this was based on biopsy sampling in which it is not currently possible to assess the total lactase activity in the small intestine.
35,36
Hypolactasia can be caused by congenital deficiency (rare), the molecular basis distinct from adult-type hypolactasia,
31
inherited loss on weaning (common); or loss due to ageing, gut infection, or thyroid or sex hormone imbalance. As non-genetic loss is potentially reversible and 76.3% of TT/AA patients had lactose sensitivity (71 patients), secondary causes must be excluded. In addition, the lactose threshold could be established by breath testing and symptom scoring after ingesting decreasing amounts of lactose. TT/AA polymorphism in the intron of MCM6 can enhance the lactase promoter.
2,26
However, in some families we have observed three generations with lactose sensitivity. Thus, inherited hypolactasia can occur with the TT/AA polymorphism, and thus cannot alone explain the molecular basis of adult-type hypolactasia. There were no marked differences in the average age between the genetic groups, although secondary causes must be excluded and the lactose threshold established. Recent evidence suggests that TT/AA patients may be carriers of a mutation associated with congenital lactase deficiency that result in symptoms. Further work is now required to confirm this.
2,31,35
A clinical pathway for investigation of lactose sensitivity
All CC/GG patients had a low lactose threshold complaining mainly of gut-related symptoms after lactose, consistent with 100% correlation with raised breath hydrogen. Our data substantiate the claim 16,21,37 that the breath hydrogen test alone is both specific and sensitive, but only for the CC/GG lactase non-persistent cohort of patients (Figure 2 and Table 1). Our data clearly show that there is no requirement to breath hydrogen or methane test CC/GG lactase non-persistence genotypes (Table 2; Figures 1 and 2). CT/GA and TT/AA patients also suffered gut symptoms during the lactose test, but also complained particularly of systemic symptoms. Prolonging the analysis to 6 h detected more patients with lactose sensitivity in these groups, but still >40% who were diagnosed as LS were missed by this method. Our data also suggested that the hydrogen breath testing was useful in identifying those patients who did not require dietary intervention. Elevated breath methane improved the sensitivity and specificity of detecting lactose sensitivity, as some 30% of patients identified as having a low lactose threshold could have raised breath methane without raised breath hydrogen (Table 1). This was consistent with hydrogen being the substrate for methane production, supporting the hypothesis that both systemic and gut symptoms are caused by gases and toxins from colonic bacteria. 5–7,32,35,36,38,39 It is now vital that the biochemical mechanism resulting in symptoms is identified. This may reveal biochemical processes that account for a variety of medical conditions such as diabetes and arthritis where the cause is as yet unknown. 35
SNP analysis, breath hydrogen and methane and a detailed record of gut and systemic symptoms after ingesting 50 g of lactose showed that >80% of patients from this cohort of referred patients with unexplained gut symptoms were LS, improving diagnosis from <50 to >75% (Table 1). Definitive diagnosis must be confirmed through a sustained improvement of symptoms following a true lactose-free diet. In those patients with diarrhoea, the timing was inconsistent with osmotic effect of lactose. We predict that this effect would be more likely due to a signalling mechanism which challenges currently accepted clinical knowledge. 35,36 Also, several patients had a history of constipation since childhood rather than diarrhoea. 16,37,40,41 Lactose sensitivity causes great distress in many patients, many not realizing that lactose is added to many foods and drinks, in addition to those directly from milk and its products. 4–8,21,22,29 A typical meal can contain lactose, equivalent to one to three glasses of milk, above many patients' lactose threshold. 42
The results reported here cannot be explained by a placebo effect. It has been reported that such effects can occur in as many as 30% of people undergoing a double-blind placebo-controlled trial. Unfortunately, randomized double-blind controlled trials are not possible when studying food sensitivities, because the key diagnostic criterion is the effect of removing a specific substance from the diet. Furthermore, it is very difficult to find a substance that can replace lactose, which prevents subjects guessing whether they are taking lactose or not. Hydrolysed milk (lactose reduced) has been used, but is sweeter than milk, and protein present can elicit other responses. Aspartame, used as an alternative sweetener in several studies, 11 can cause similar systemic symptoms to lactose including allergic, cardiovascular, endocrine and neurological symptoms. 43 Our study was based on rigorous clinical criteria. DNA analysis was undertaken blind, and precautions were taken to minimize bias in the analysis of symptoms and breath hydrogen and methane. In patients diagnosed with lactose sensitivity, the average number of symptoms dropped from nine to one after dietary lactose exclusion (Table 2 and Figure 3). This applied to the selected group of patients; with hitherto unexplained gut and systemic symptoms used in this study, and thus could not be explained by a ‘placebo’ effect. 44,45 In contrast to lactose-insensitive patients, symptoms returned when LS patients purposely re-challenged themselves, or unknowingly ingested food containing ‘hidden’ lactose above their threshold.
From this study, we have drawn up a ‘current best practice’ algorithm for investigation of patients with unexplained gut and systemic symptoms, which might be due to lactose sensitivity (Figure 4). It is vital to monitor LS patients' calcium and vitamin D status, 45–48 and advise on probiotics. 49
The combination of biochemical and clinical data reported here have important implications for the management of unexplained gut symptoms (often labelled IBS), chronic fatigue, allergies and arrhythmias, muscle and joint pain together with a wide range of unexplained systemic symptoms. 5,7,50 They also have social and economic benefits, reducing primary care visits, invasive investigation and prescribed drugs 27 (Waud JP, Matthews SB, Campbell AK, unpublished observations).
Footnotes
Acknowledgements
We thank the Department of Medical Biochemistry and Immunology and the Institute of Biomedical Science for financial support to JPW. We thank Suzanne Watkins, specialist nurse for assistance with lactose breath testing and dietary support.
The authors have no conflicts of interest in this study.