
Abstract
Abstract
Background
This paper describes the preparation, analysis and certification of four frozen human serum certified reference materials (CRMs) containing creatinine and the electrolytes calcium, lithium, magnesium, potassium and sodium. These materials have been prepared to give concentrations of these analytes that cover the currently accepted analytical range.
Methods
The analysis of the materials for certification purposes has been carried out using methodology traceable to primary standards, and which is acceptable as a reference method. The certification methods include liquid chromatography-mass spectrometry (LC-MS) with exact-matching isotope dilution calibration (EM-IDMS) for creatinine, inductively-coupled plasma optical emission spectroscopy (ICP-OES), ICP-MS and isotope-dilution inductively-coupled plasma mass spectroscopy (ID-ICP-MS) for the electrolytes.
Results
The uncertainties estimated for these certified values include a component from the characterization measurements, as well as contributions from possible inhomogeneity and long-term instability. The certified values have been corroborated by measurements obtained in a major UK External Quality Assessment scheme, which have, with the exception of the determination of creatinine at a particularly low concentration, given excellent agreement.
Conclusions
The materials are intended for use by pathology laboratories and manufacturers of in vitro diagnostic (IVD) kits for validation of existing routine methodology to a traceable standard, which will promote harmonization between the different methods, instruments and IVD kits used in these laboratories.
Introduction
Standardization among the various available analytical methods is important in providing global comparability in the diagnosis, treatment and monitoring of pathological disease. In addition, the European in vitro diagnostic (IVD) Directive requires all assays used in diagnostic tests placed on the market be traceable to available ‘high order’ reference materials or procedures. 1 Standardization of assays can be aided by the availability of certified reference materials (CRMs) with values assigned by a reference method. It is also important to note that traceability is inextricably linked to specificity.
Four frozen human serum reference materials have been prepared, analysed and certified. The data for these CRMs have been prepared in accordance with the criteria for European Reference Materials® (ERM) Status. The data have been accepted as complying with the principles laid down in the Technical Guideline of the ERM® cooperation agreement between the German Federal Institute for Materials Research and Testing (BAM), Laboratory of the Government Chemist (LGC) and the European Commission's Joint Research Centre, Institute for Reference Materials and Methods (IRMM). Information on these guidelines is available on the Internet (
Two of these materials have been certified for electrolytes (calcium [Ca], lithium [Li], magnesium [Mg], potassium [K] and sodium [Na]) and creatinine content and have been numbered ERM-DA250 and ERM-DA251. The other two materials, which have been numbered ERM-DA252 and ERM-DA253, have been certified only for their creatinine concentration, although the electrolyte concentrations were also determined and reported as an additional material information.
Reference materials containing these analytes are currently available in lyophilized format that require reconstitution prior to use. The materials described in this paper are the first matrix CRMs for all of the listed analytes available as whole human serum, although the currently available material SRM956b contains certified concentrations for electrolytes, but not creatinine. These frozen serum preparations have the advantages of being as close to the native patient matrix as possible. Although full commutability studies have not been performed with this material across the different methods, samples were sent as a part of External Quality Assessment (EQA) distributions on four separate occasions where a full representation of current analytical methodologies was available.
These materials have also been produced and certified independently of the producers of instrumentation and test kits used in clinical pathology laboratories for the routine measurements of creatinine and electrolytes. Data from EQA schemes have shown that there is a significant variability between the results obtained in clinical pathology laboratories using different instruments or IVD test kits. This indicates the clear need for materials such as those described in this paper, with the certified values obtained using traceable reference measurement procedures.
It is generally accepted that the glomerular filtration rate (GFR) is the best overall index of kidney function, and an estimate of the GFR (eGFR) is widely used for the staging, diagnosis and monitoring of chronic kidney disease. 2 A number of predictive equations have been used to determine the eGFR, 3–5 however, the National Kidney Disease Education Programme of the National Institute of Diabetes and Diseases of the Kidney, National Kidney Foundation, American Society of Nephrology and the Department of Health National Service Framework for Renal Services (UK) recommend estimating GFR using the Modification of Diet in Renal Disease study equation. This equation uses serum creatinine in combination with age, sex and race to estimate GFR.
Reliable results derived from the creatinine analyses are therefore necessary to provide confidence in the eGFR value. Standardization among the various available analytical methods is therefore important in providing global comparability in the diagnosis, treatment and monitoring of kidney function. Current variability in serum creatinine measurements suggests that they are not adequate for the estimation of GFR using these equations at creatinine concentrations within or near the upper reference limit (<133 μmol/L). This latter range is of major importance in the diagnosis and staging of chronic kidney disease in adults. 6 Standardization of assays would be aided by the availability of appropriate reference materials.
The determination of electrolytes is also carried out routinely in clinical hospital laboratories, and the results can be used as part of a renal profile.
The physiological ranges for electrolytes are Ca: 2–3 mmol/L, Mg: 0.6–0.9 mmol/L, K: 3–6 mmol/L and Na: 125–150 mmol/L. 7
The certified values and their associated uncertainties are provided in Table 1, and calculated values and their associated uncertainties in μmol/L or mmol/L are provided in Table 2.
Certified values and uncertainties for materials ERM-DA250 to 253
ERM®, European reference materials®
Calculated values and uncertainties for materials ERM-DA250 to 253 converted to μmol/L (creatinine) and mmol/L (electrolytes)
*Creatinine values in μmol/L
ERM®, European reference materials®
Methods
Preparation of materials
Pools of human serum from donors of mixed age and sex were prepared by the Wales External Quality Assessment scheme (WEQAS) as a part of the General Chemistry EQA scheme preparation. The serum samples were obtained as two batches from the National Blood Service (Bristol, UK) and Scipac Ltd (Sittingbourne, UK), and were prescreened for human immunodeficiency virus and hepatitis B and C. These were fresh, off the clot serum samples from ‘normal’ subjects. Donor consent was not required. The materials were frozen following collection and thawed prior to use.
Tangential flow ultrafiltration was used to modify the concentration of analytes to the required concentration using either dialysis or concentration mode. The batches were mixed, and two pools were prepared, the low pool containing physiologically low concentration of electrolytes and creatinine, and the high pool containing physiologically high concentrations of electrolytes and creatinine. The target values for these pools are provided in Table 3. Mixtures of the high and low pools were combined to produce two further intermediate pools.
Specifications and acceptance limits for prepared high and low pools
The resulting serum samples were thoroughly mixed for a minimum of 2 h, sterile-filtered to 0.2 μm, and 1 mL dispensed aseptically into plastic screw-cap 3 mL cryovials. Approximately 1000 U of each reference material was produced and stored at −70 ± 5°C. The materials have been stored subsequently at −70 ± 5°C continuously.
Formal assessment of commutability was not undertaken according to NCCLS EP14, 8 as this was not considered necessary with the creatinine being determined by a primary reference method of measurement. However, material was distributed to all participants within the WEQAS General Chemistry scheme and assessed within the respective method groups.
Methods of analysis for certification
Creatinine
The method described here for creatinine determination has been previously published in Journal of Chromatograph B. 9
Ten samples from each material were analysed in duplicate, with ∼0.4 g of sample accurately weighed into 4 mL amber-glass vials. Each sample was spiked with a known amount of isotopically-labelled creatinine-d3 (QMX, Thaxted, UK) which was estimated to be equimolar in concentration to that of the creatinine in the serum sample. The spiked samples were allowed to equilibrate at room temperature for a minimum of 2 h. Each sample was precipitated by the addition of 3 mL of cold absolute ethanol (HPLC Grade, Fisher Scientific, Loughborough, UK). The solutions were allowed to stand for 5 min before being centrifuged at 4000 rpm. The supernatant was evaporated to dryness at 60°C under nitrogen before being reconstituted in deionized water (18 MΩ) (5–10 mL, depending on the sample). Finally, the reconstituted extract was passed through a 0.45 μm polypropylene syringe filter (Fisher Scientific). Liquid chromatography-mass spectrometry (LC-MS) was performed using a Waters 2690 Separations Module (Watford, UK) connected to a Micromass Ultima tandem mass spectrometer (Manchester, UK). The chromatography was performed on a Luna C18 (II) 150 × 2.1 mm, 3 μm analytical chromatography column (Phenomenex, Macclesfield, UK), and the mobile phase consisted of aqueous ammonium acetate (10 mmol/L) maintained at a flow rate of 0.2 mL/min. The calibration standards were prepared using creatinine SRM 914, obtained from NIST, Gaithersburgh, MD, USA.
The electrospray probe was operated at 2.5 kV and the combined hexapole and cone voltage was 40 V. The source block and desolvation temperatures were 120°C and 450°C, respectively. Analyte ionization was achieved by protonation resulting in [M + H]+ ions at 114 and 117 m/z for the natural and deuterated compounds, respectively. Traceability was assured using the CRMs SRM909b (NIST) and BCR 574 (IRMM, Geel, Belgium).
Electrolytes
The electrolyte content of the two materials to be certified were determined by analysing 10 randomly selected samples of ∼0.4 g each, accurately weighed. The Mg content was determined by isotope dilution inductively-coupled plasma mass spectrometry (ID-ICP-MS). The Ca, K, Li and Na concentrations were determined using single standard matching inductively-coupled plasma optical emission spectrometry (ICP-OES).
Each sample was allowed to equilibrate at room temperature for 3 h. The serum was then diluted with 1% w/v nitric acid at a ratio of 1:65 for analysis, with further dilutions being made for Ca and Li as necessary. For Mg analysis of ERM-DA250 by IDMS, ∼0.2 g, accurately weighed, of the spike solution (25Mg 9.84 μg/g obtained from Teknolab A/S, Drobak, Norway) was added to ∼0.4 g of sample, accurately weighed, and diluted to ∼40 g, accurately weighed, with 1% w/v nitric acid. For Mg analysis of ERM-DA251 by IDMS, the same procedure was followed, but 0.3 g of both spike solution and sample was used.
The internal standard for each analyte (scandium for Ca and Na, rhodium for K and Li, obtained from SPEX CertiPrep Inc, Metuchen, NJ, USA) was accurately weighed, to four significant figures, into each sample and standard, after dilution. All electrolytes were determined individually.
For the material assigned the number ERM-DA251, when using ICP-OES, the recoveries obtained for Li from reference materials analysed in the same batch were consistently low. Consequently, Li concentration was determined on this material subsequently by inductively-coupled plasma mass spectrometry (ICP-MS) using single standard exact matching, where a standard is prepared to be similar to the expected concentration of the sample, and the final sample concentration is calculated using the values from the standard measured immediately before and after the sample measurement. The material assigned the number DA250 gave problems during analysis: the crossflow nebulizer used suffered from blockages, due to the high protein content of the material. Consequently, a modified sample preparation method was established for each analyte, which overcame the blocking of the nebulizer and gave reduced blank problems. For the determination of Li and K, ∼0.4 g of sample, accurately weighed, was digested with 2 mL nitric acid/1 mL hydrogen peroxide, in a waterbath at 80°C for 30 min, and then made up to ∼40 g, accurately weighed, with deionized water (<18 MΩ). For Na, ∼0.4 g of sample, accurately weighed, was diluted to ∼40 g, accurately weighed, with 0.1% triton-X (iso-octylphenoxypolyethoxyethanol, BDH, Poole, UK)/1% nitric acid. For Ca, ∼0.4 g sample, accurately weighed, was diluted to ∼40 g, accurately weighed, with 1% nitric acid, and then diluted 4–20 g with 1% nitric acid. All weighings were carried out to four decimal places.
Results
Homogeneity and stability
All four materials were also tested to ensure they were sufficiently homogeneous and stable for presentation as CRMs, and to determine the contribution to the overall uncertainty of the certified values from any heterogeneity and potential long-term instability. The procedures used to determine the homogeneity and stability of these materials have been assessed by the UK Accreditation Service (UKAS) as a part of LGC's accreditation to ISO Guide 34:2000 and ISO/IEC 17025:2005, as appropriate for the related laboratory activities, as a reference material producer. Details of this are available on the UKAS website (
The materials were tested at LGC for homogeneity by analysing 10 randomly selected samples of 0.4 g each using the methodology stated previously.
The data were processed using a one-way ANOVA approach using a commercial software package (Statistica). The P values obtained from this treatment showed that all the materials were homogeneous for most of the analytes at the 95% confidence level (CI), and all of the analytes at the 99% CI. Material DA-250 was not homogeneous for creatinine, Ca and Na at the 95% CI. Although the statistical analysis showed that the materials were homogeneous, a contribution was added to the total uncertainty to allow for any inhomogeneity not detected by the test method. The standard uncertainty values due to homogeneity, u hom, are shown in Table 4. The value taken was the higher value of the method variation and the between-sample variation.
Uncertainty contribution from possible inhomogeneity
ERM®, European reference materials®
The two reference materials to be certified for electrolytes were analysed by the WEQAS reference laboratory using a published reference method in 2003 and 2005. 10 The samples had been stored at −70°C. All four reference materials were analysed for creatinine by LGC in 2003 and in 2006 using HPLC-IDMS. All samples had been stored at −70°C.
All materials were shown to be sufficiently stable to be CRMs, and an expiry date of April 2008 was assigned on this basis. The stability of these materials will be assessed by LGC on an ongoing basis. A contribution to the overall uncertainty budget for any potential instability was calculated. The uncertainty values calculated for the materials due to potential instability, u lts, are shown in Table 5.
Uncertainty contribution from potential long-term instability
ERM®, European reference materials®
Calculation of uncertainties of certified values
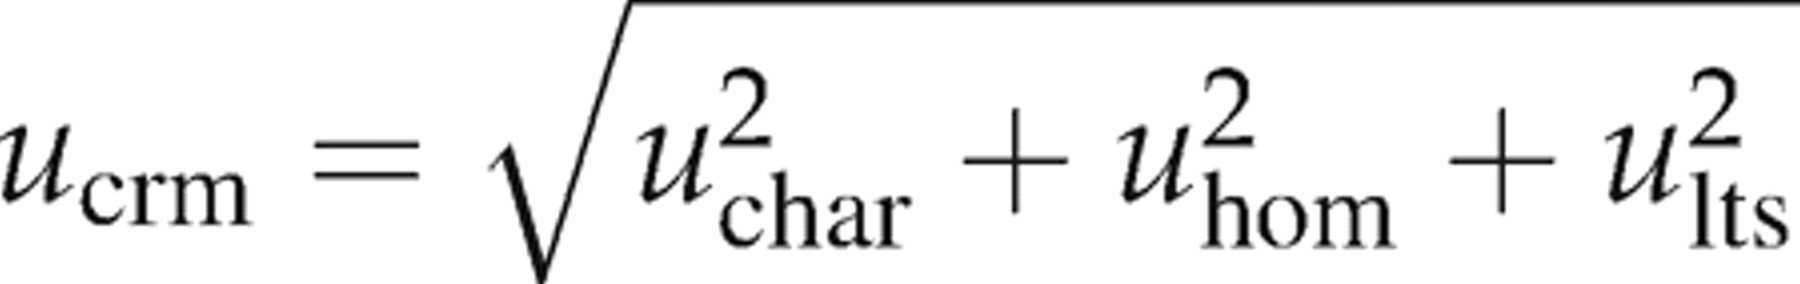
The uncertainty quoted in the material certificates (U
crm) was obtained by combining the standard uncertainty of the characterization (u
char), the standard uncertainty due to inhomogeneity (u
hom) and the standard uncertainty due to long-term stability (u
lts) as follows:
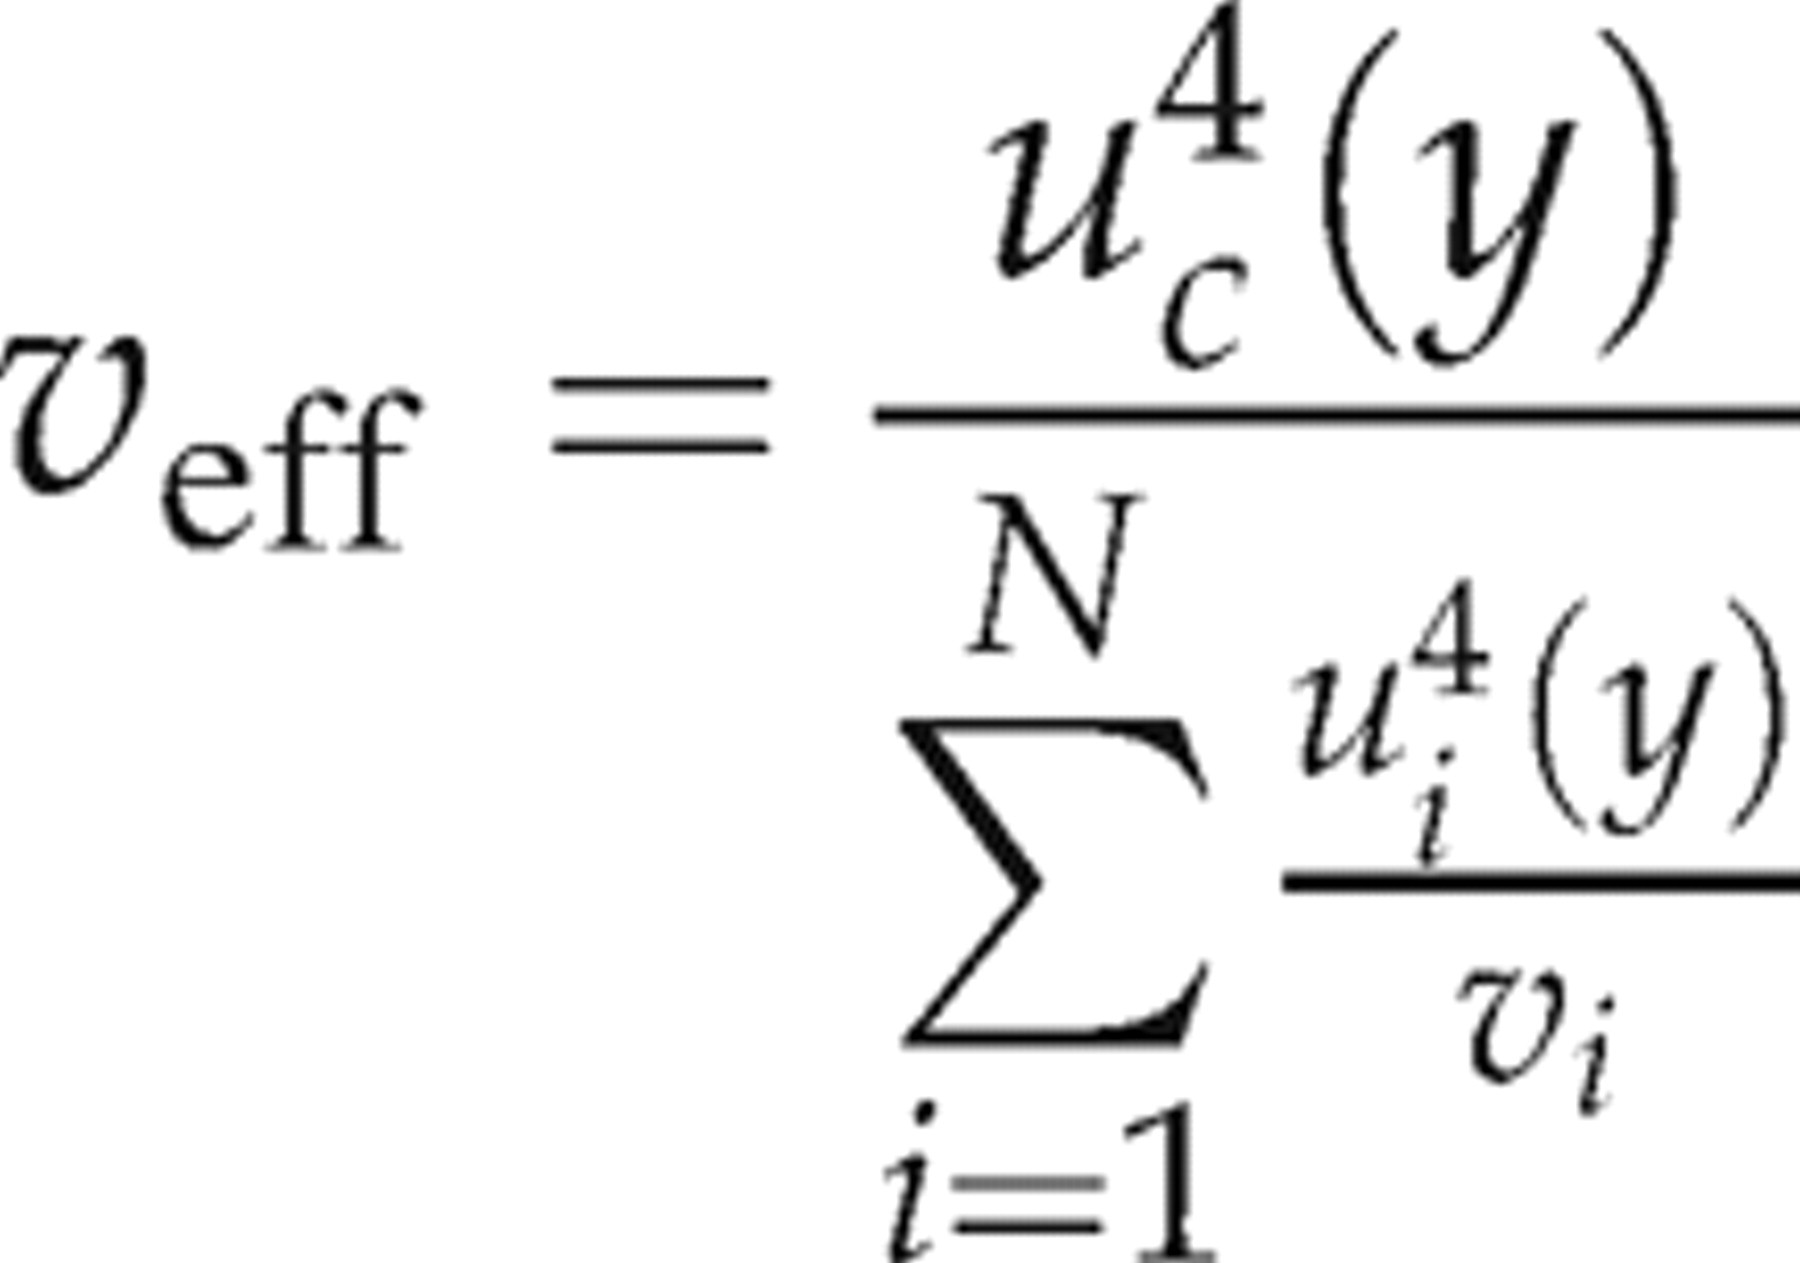
To express the final uncertainty estimate (U) with a specified degree of confidence (typically 95%) the value u
crm needs to be multiplied by a coverage factor (k). The coverage factor is obtained from a t-table, for the effective of degrees of freedom. The effective number of degrees of freedom ν
eff is calculated by rearranging and applying the Welch–Satterthwaite formula as follows:
11–15


The t value corresponding to the number of effective degrees of freedom was then calculated by interpolation using the appropriate t values for whole integer degrees of freedom given in statistical t-tables.
Results from the Wales External Quality Assessment Scheme EQA scheme
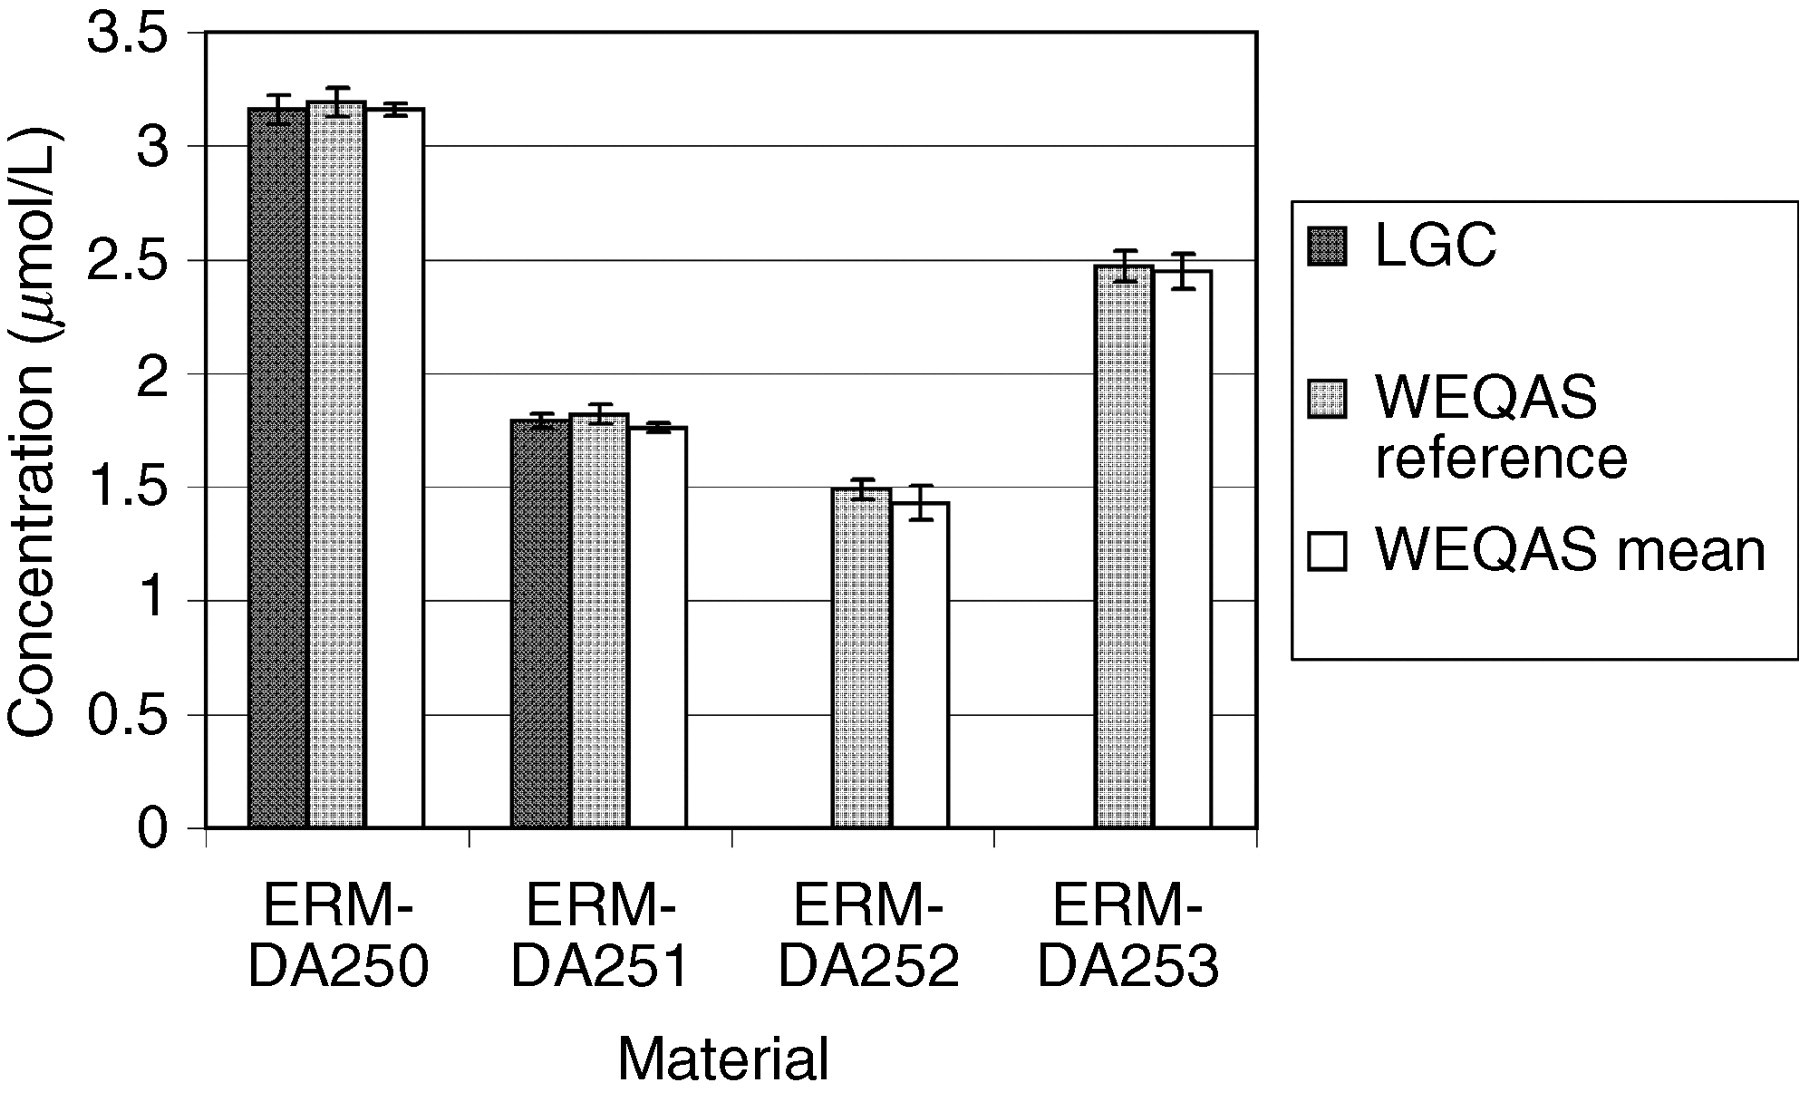
WEQAS is one of the largest EQA providers in the UK with over 600 participating laboratories. The materials to be certified were used as the test material in three separate rounds for electrolytes, and two for creatinine as a part of the WEQAS General Chemistry scheme. The participants used a range of different methods to measure the concentration of creatinine in human serum. The major methods included Jaffe, 16 kinetic Jaffe 17 and enzymatic. 18–20 Other peer method groups for Vitros, Synermed O'Leary and Roche rate blanked kinetic Jaffe were assessed separately. The methods used by participants for the determination of electrolytes included atomic absorption spectrometry, flame emission spectrometry, direct and indirect ion-selective electrodes and colorimetric techniques. WEQAS reference laboratory also determined the electrolyte concentration of the materials independently using a published reference method using atomic absorption spectrometry for Ca, Li and Mg, and flame emission spectrometry for K and Na. 7 The results from both WEQAS reference method and the WEQAS were used to corroborate the certified values obtained at LGC. The results are shown in Figures 1 –7 below.
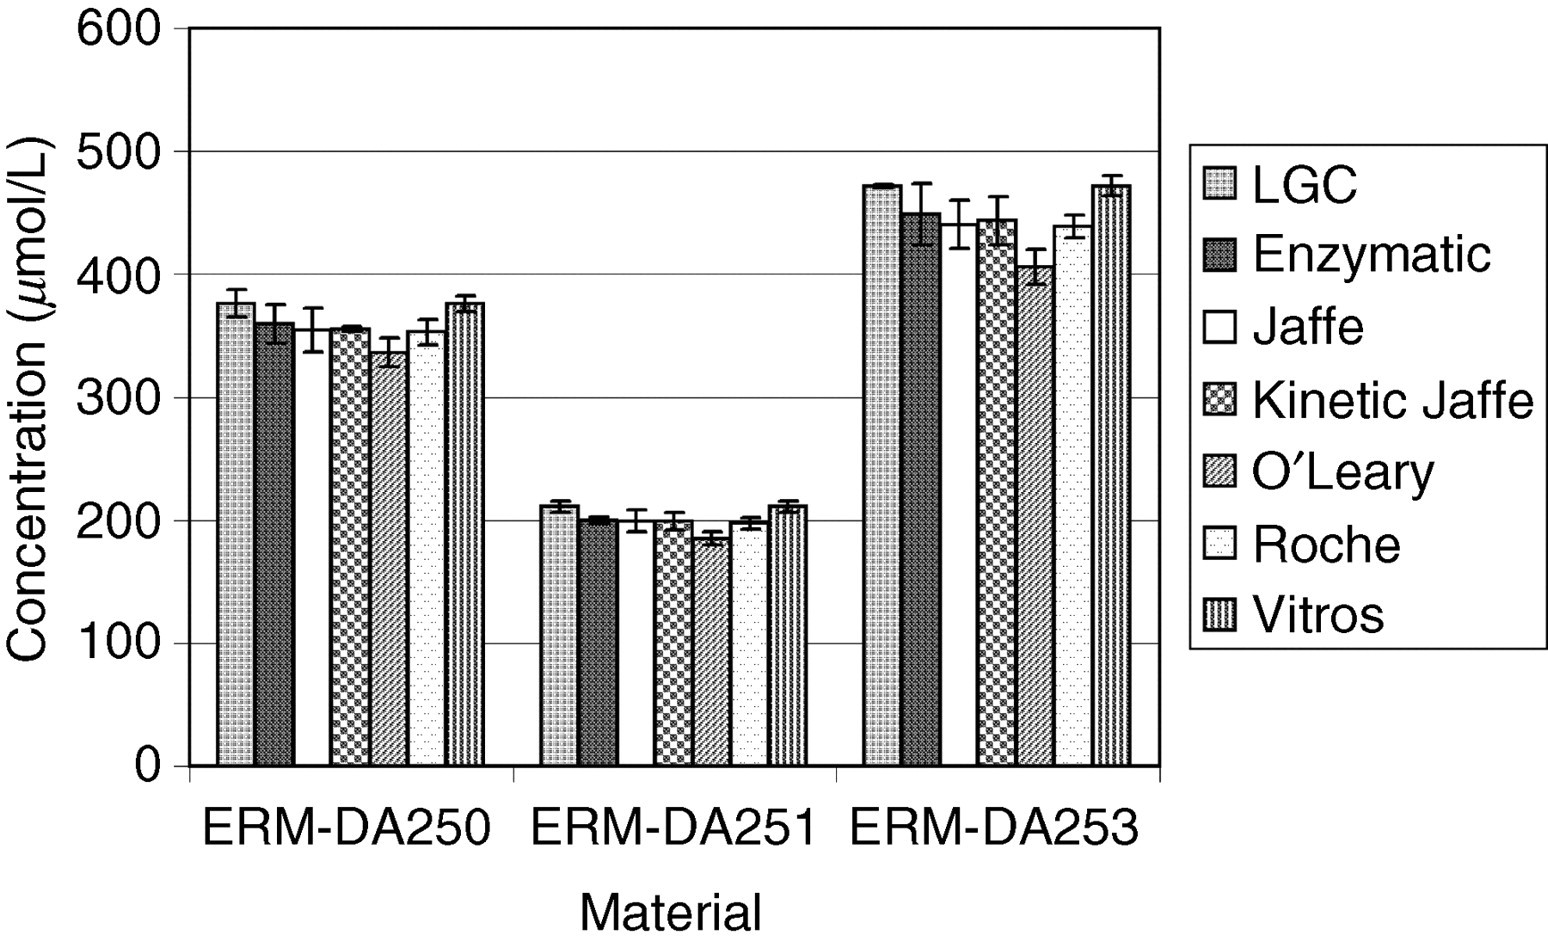
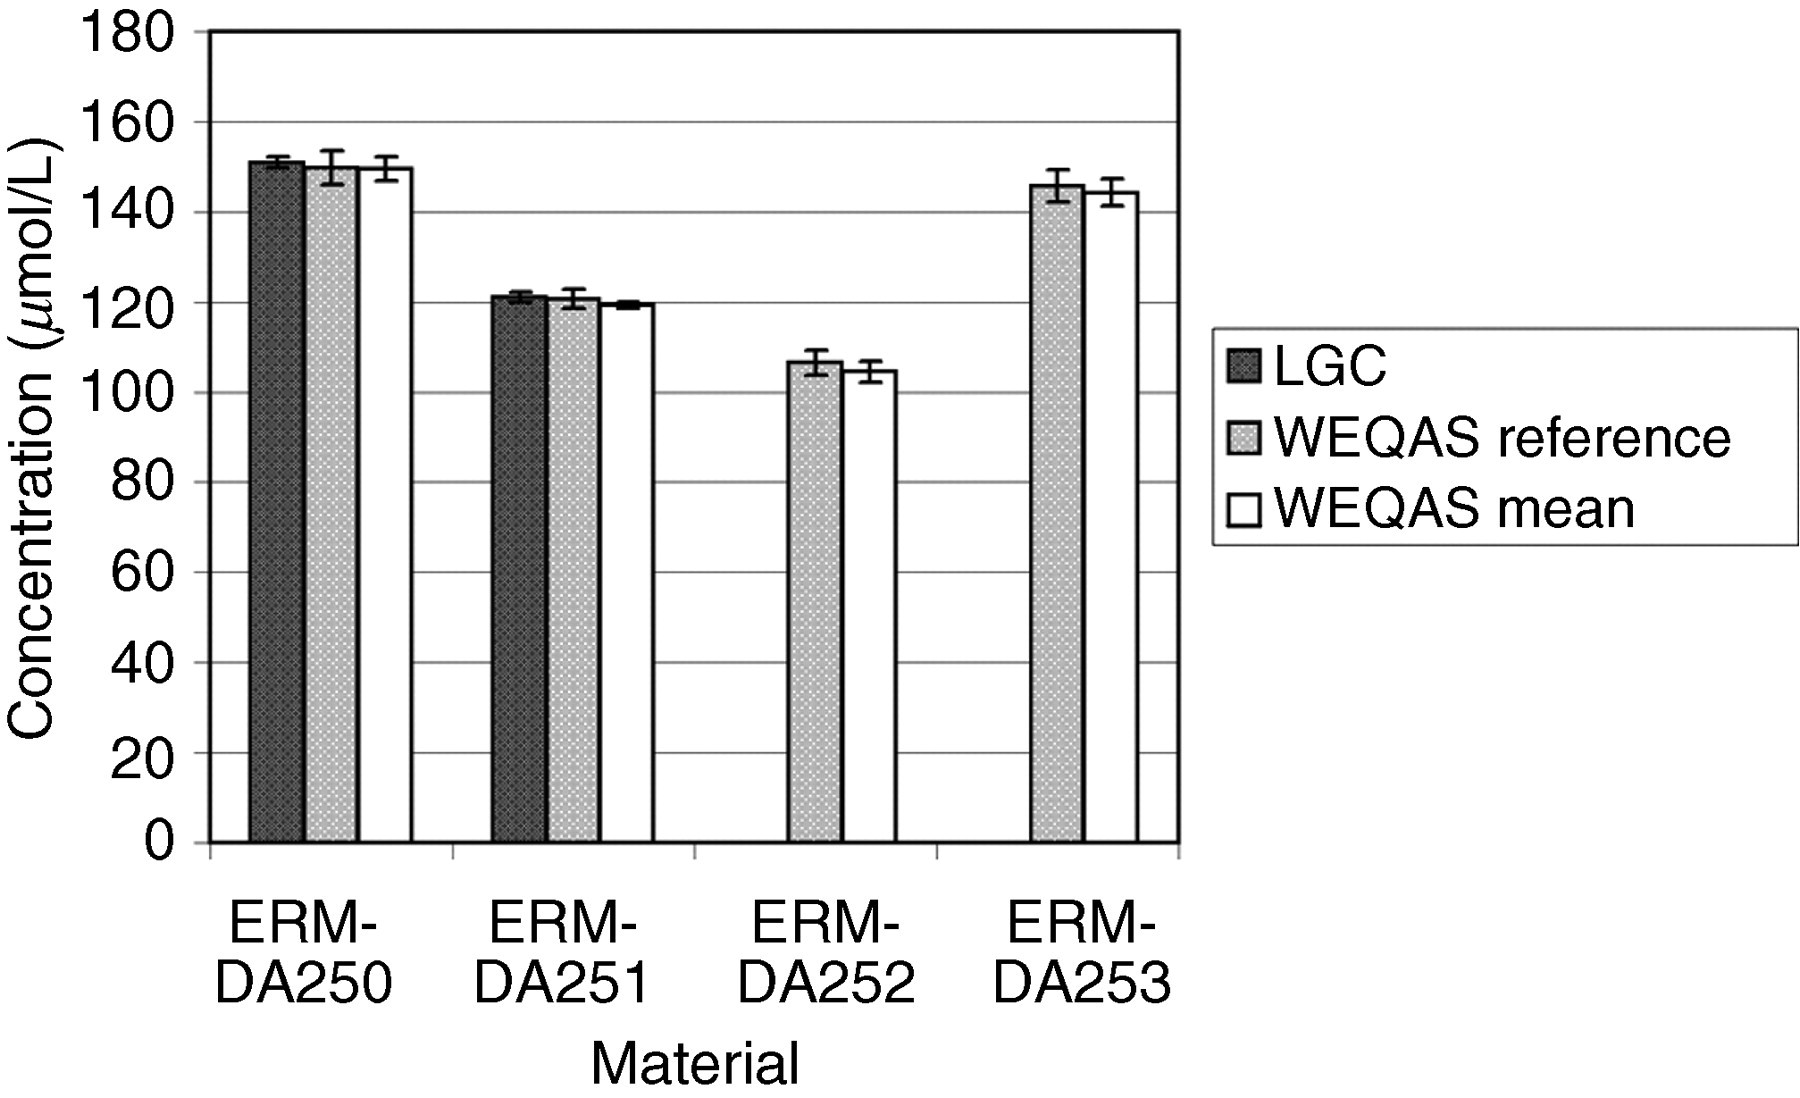
Comparison of results obtained by the Laboratory of the Government Chemist (LGC) and the Wales External Quality Assessment scheme (WEQAS) (mean data) for creatinine for materials ERM-DA250, ERM-DA251 and ERM-DA253. The error bars are the expanded uncertainty (for the LGC data) or the standard deviation (WEQAS data)
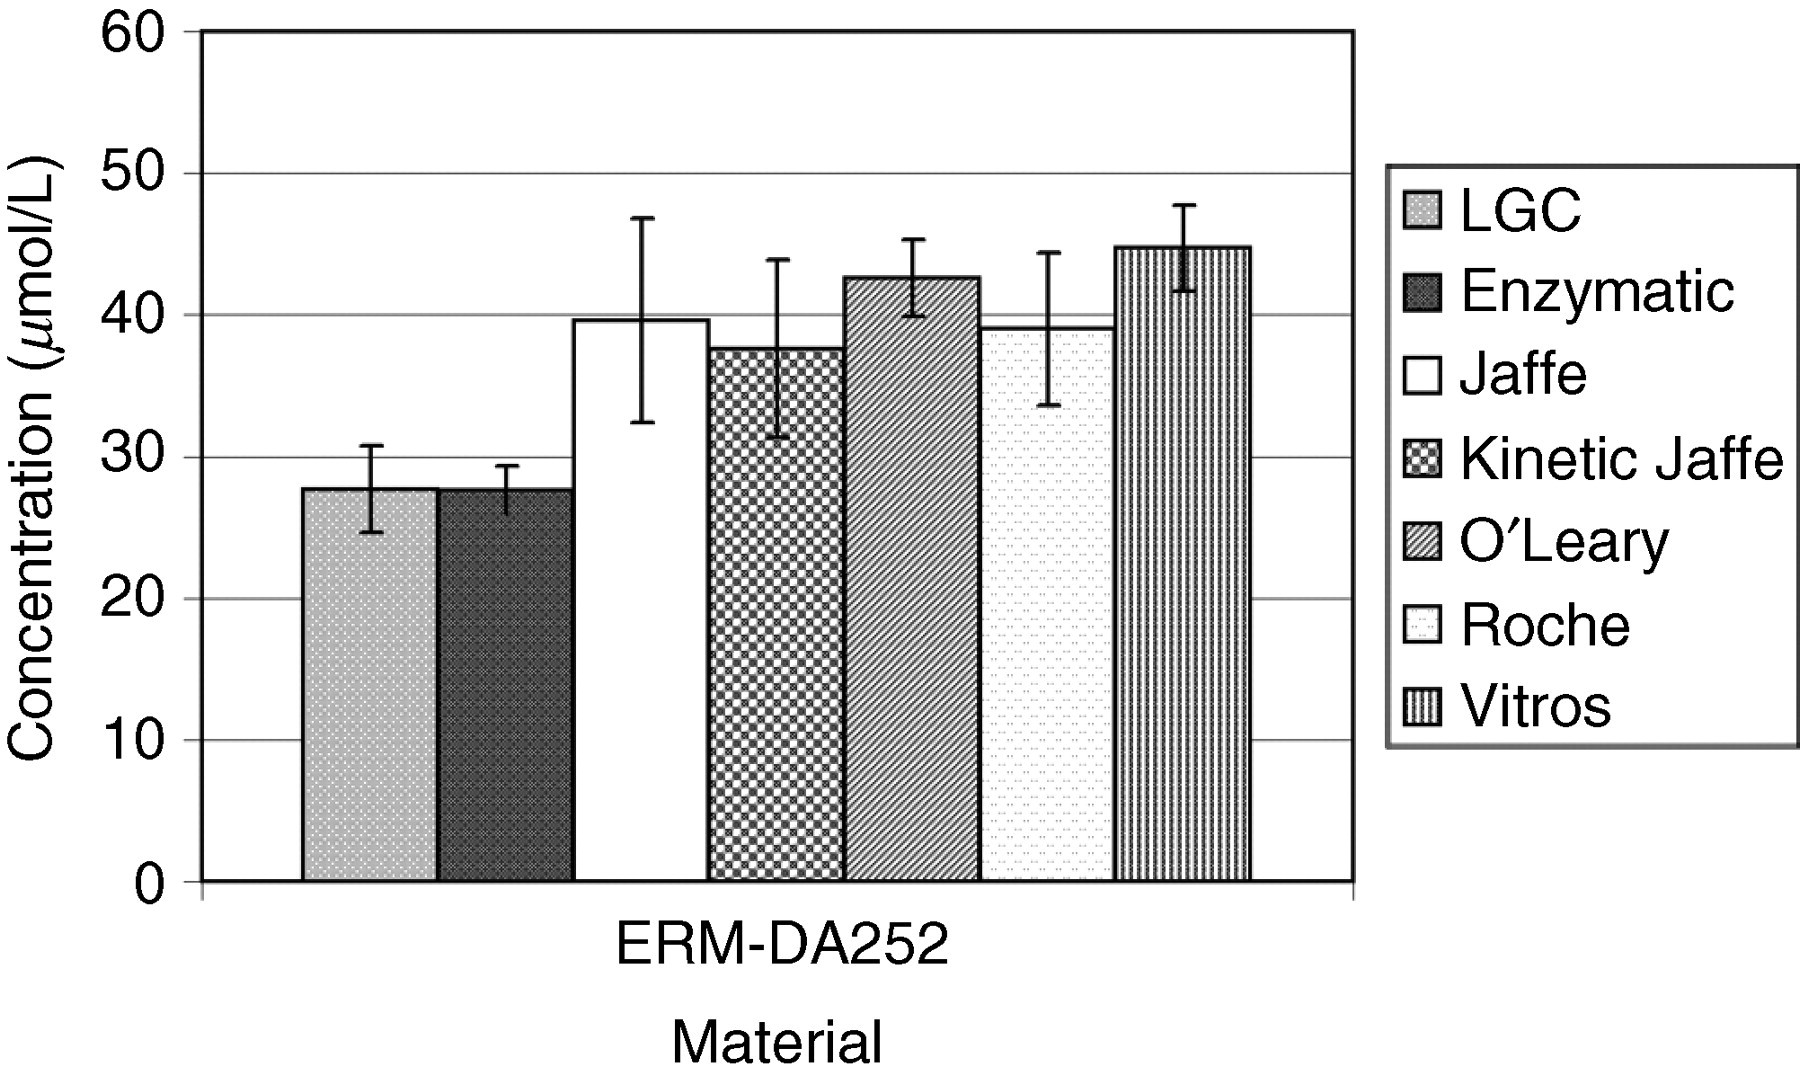
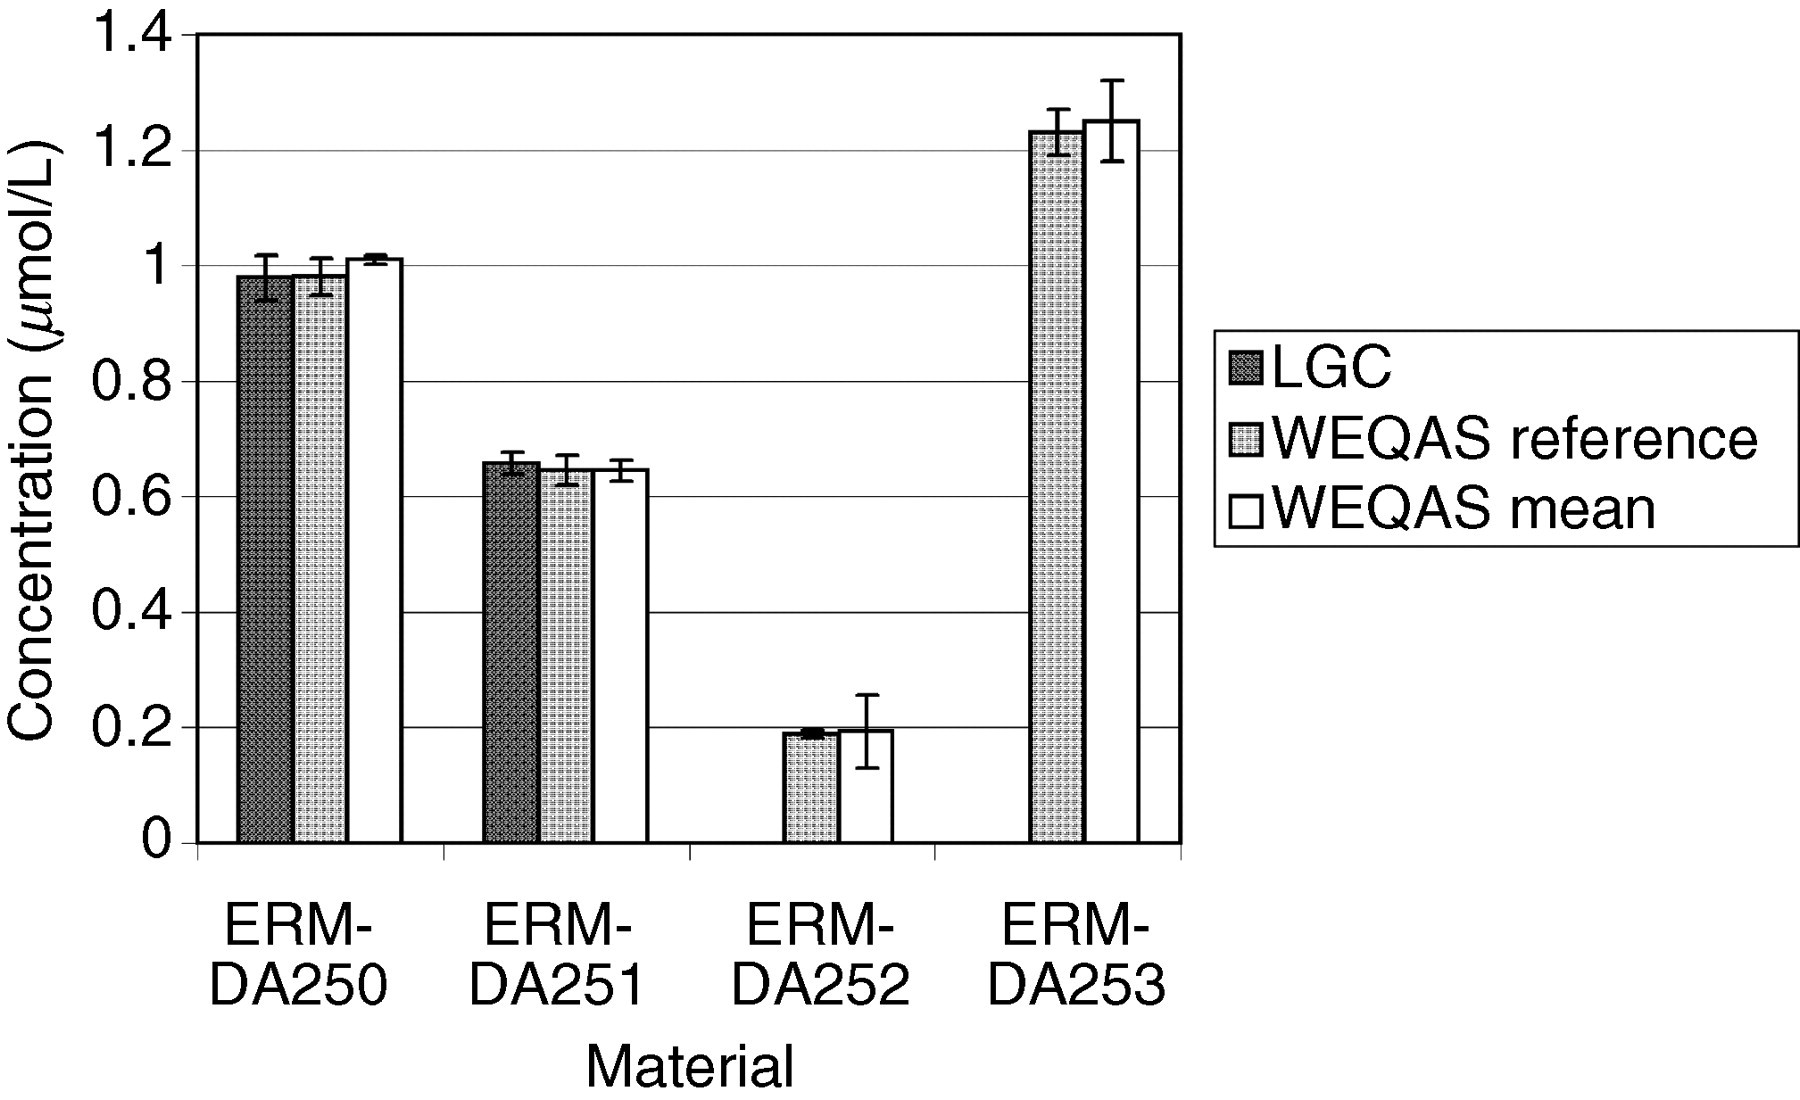
Comparison of results obtained by the Laboratory of the Government Chemist (LGC) and the Wales External Quality Assessment scheme (WEQAS) (mean data) for creatinine for material ERM-DA252. The error bars are the expanded uncertainty (for the LGC data) or the standard deviation (WEQAS data)
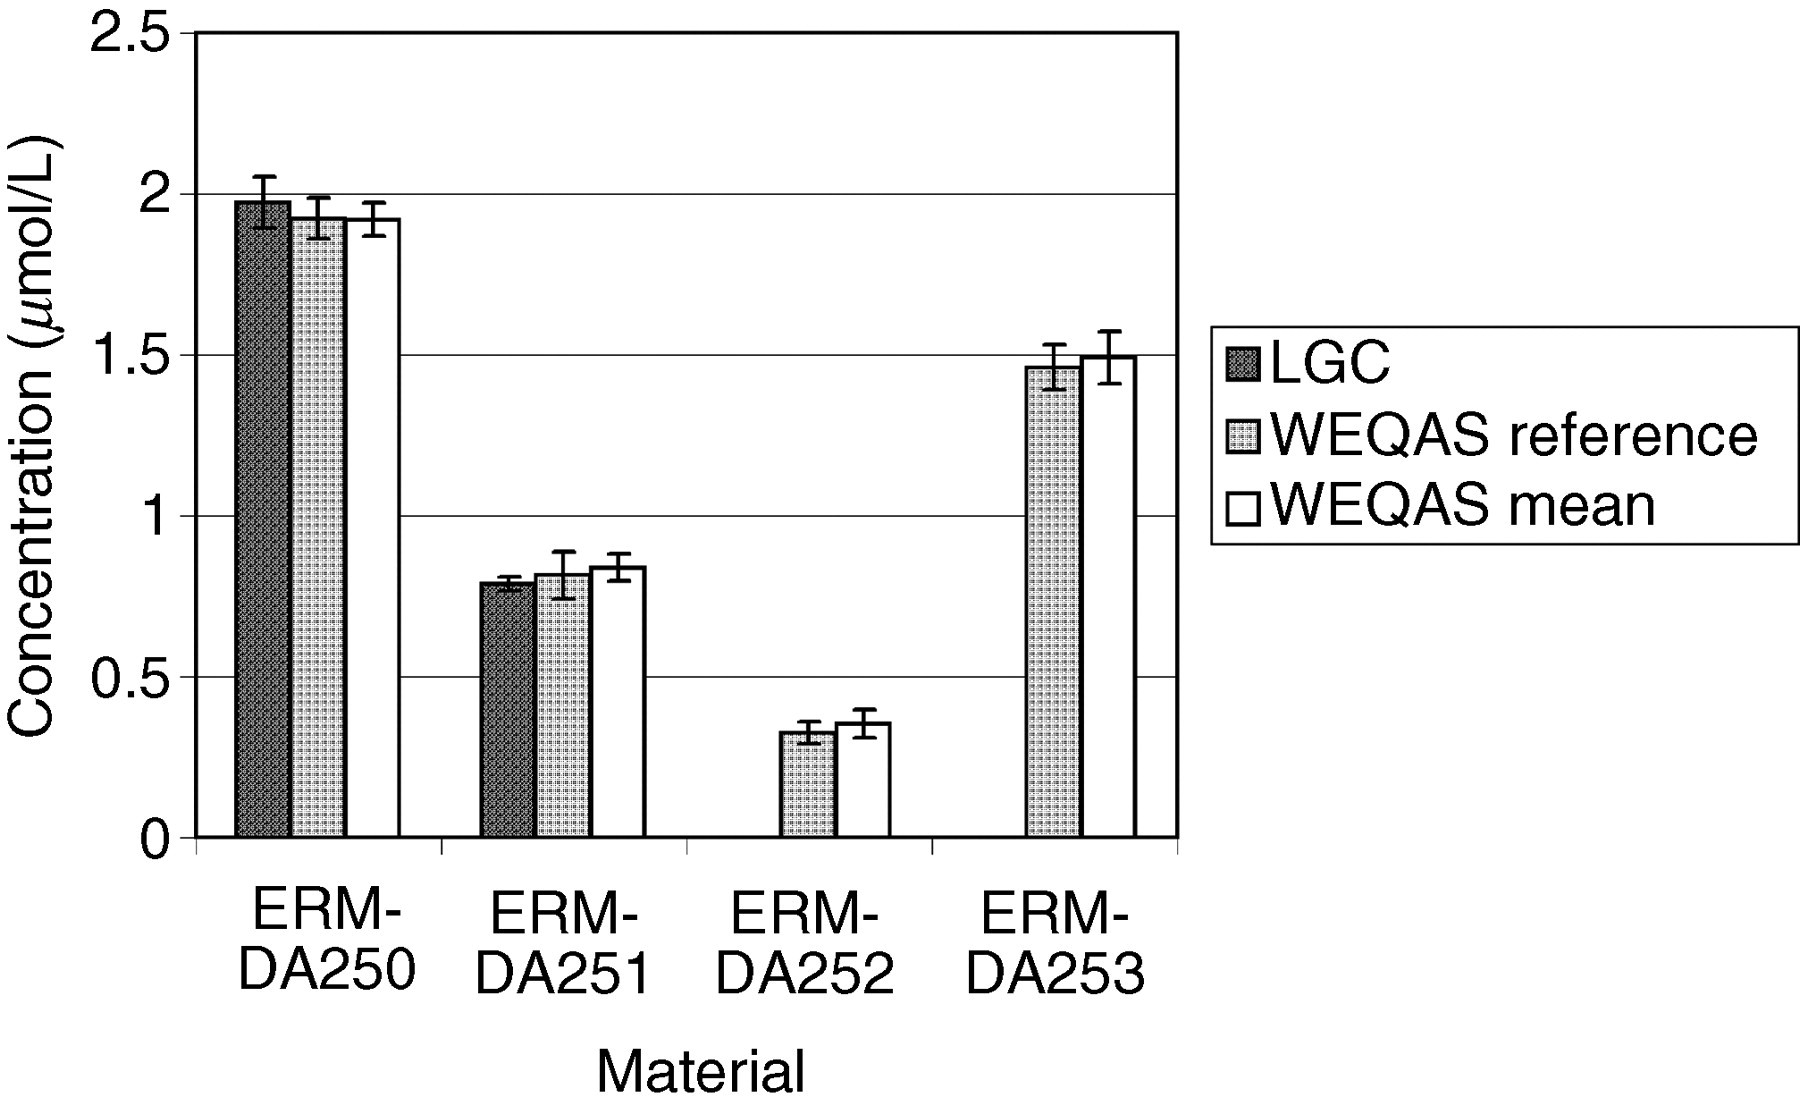
Comparison of results obtained by the Laboratory of the Government Chemist (LGC), Wales External Quality Assessment scheme (WEQAS) and a reference AA/AE method for calcium. The error bars are the expanded uncertainty (for the LGC data) or the standard deviation (WEQAS data)
Comparison of results obtained by the Laboratory of the Government Chemist (LGC), Wales External Quality Assessment scheme (WEQAS) and a reference AA/AE method for lithium. The error bars are the expanded uncertainty (for the LGC data) or the standard deviation (WEQAS data)
Comparison of results obtained by the Laboratory of the Government Chemist (LGC), Wales External Quality Assessment scheme (WEQAS) and a reference AA/AE method for magnesium. The error bars are the expanded uncertainty (for the LGC data) or the standard deviation (WEQAS data)
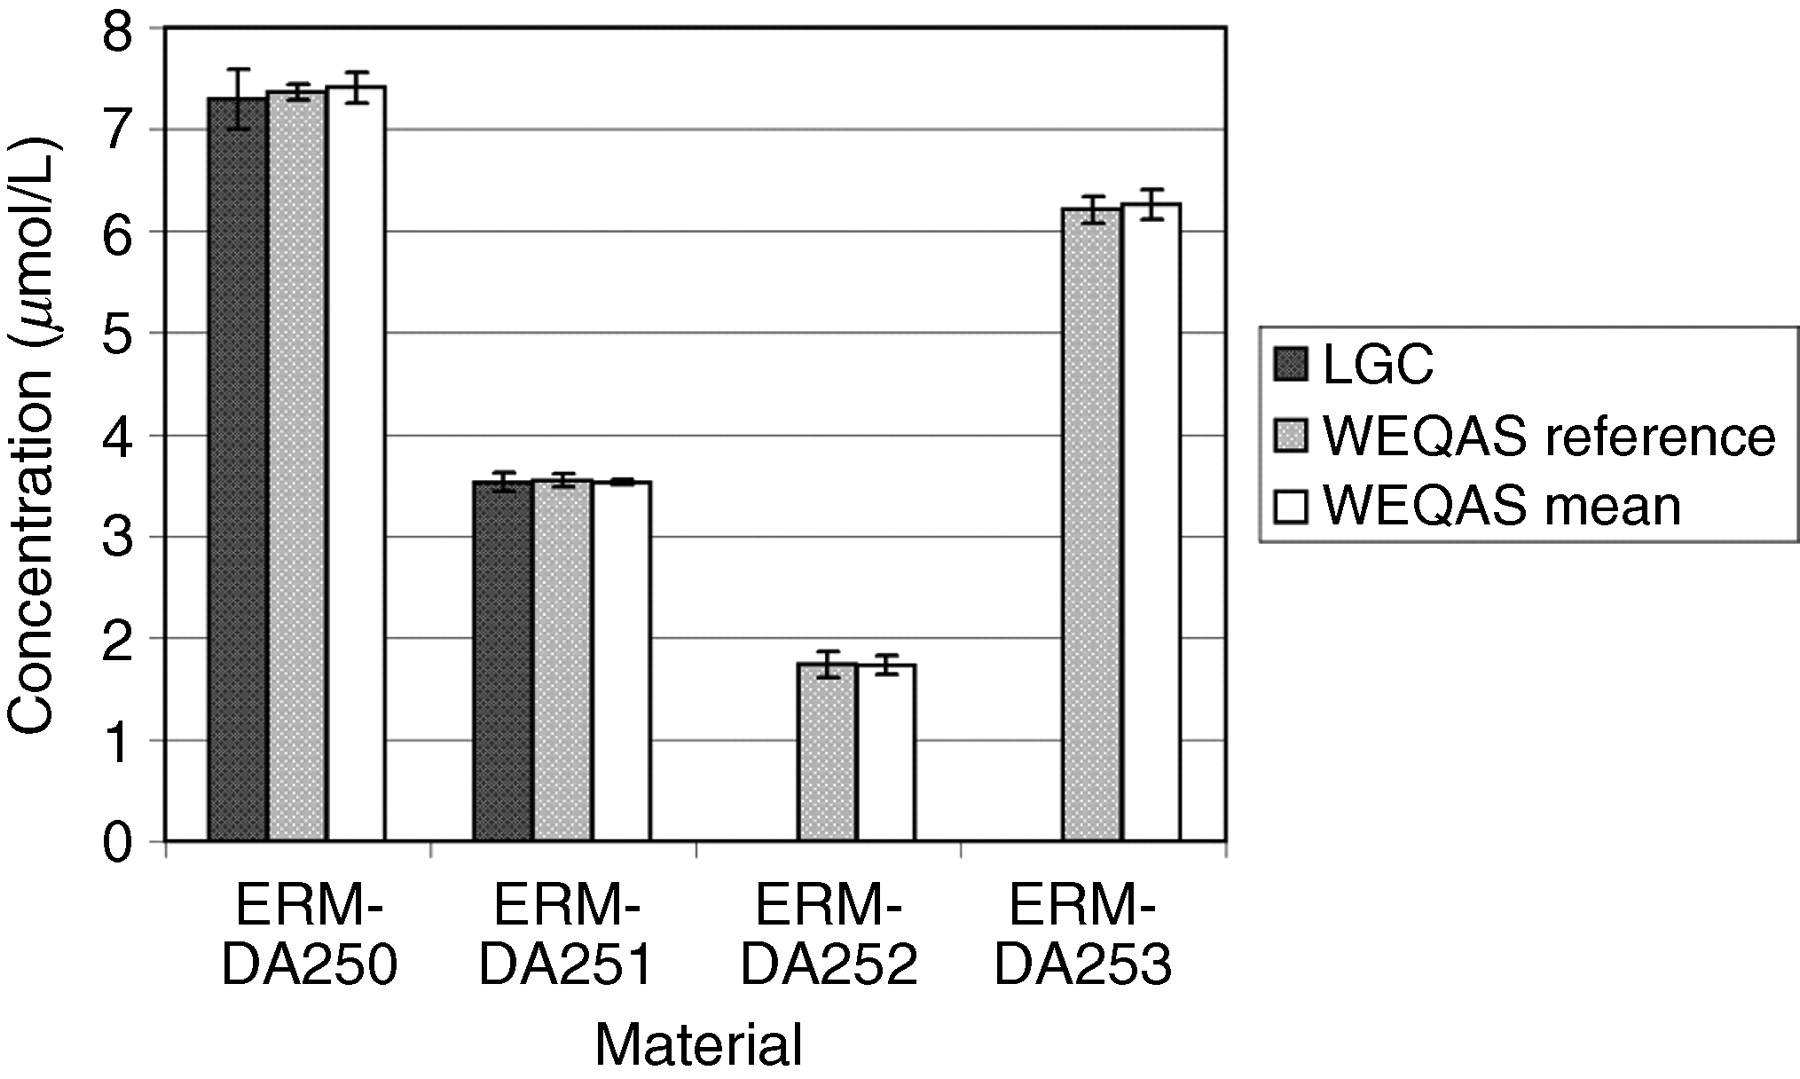
Comparison of results obtained by the Laboratory of the Government Chemist (LGC), Wales External Quality Assessment scheme (WEQAS) and a reference AA/AE method for potassium. The error bars are the expanded uncertainty (for the LGC data) or the standard deviation (WEQAS data)
Comparison of results obtained by the Laboratory of the Government Chemist (LGC), Wales External Quality Assessment scheme (WEQAS) and a reference AA/AE method for sodium. The error bars are the expanded uncertainty (for the LGC data) or the standard deviation (WEQAS data)
Excellent agreement was observed for the electrolyte results obtained at LGC, WEQAS reference method and in the WEQAS EQA scheme, providing additional confidence in the published certified values. For creatinine, a significant disagreement was observed for material ERM-DA252, where the consensus value obtained in the WEQAS was significantly higher than that obtained at LGC using LC–MS + EM-IDMS (41.1 μmol/L vs. 27.5 μmol/L). This difference can be explained by the lack of specificity for the kinetic Jaffe spectrophotometric method at a low creatinine concentration, where overestimates up to 50%, have been reported due to interferences from indoles, bilirubin and cyclosporin drugs. 21 This had also been reported in a study conducted by the IRMM, Geel, Belgium. 22 The enzymatic group compared well with the certified values.
The WEQAS consensus value was calculated as the overall mean of all results after exclusion of outliers (±2SD). Of the six methods used, the kinetic Jaffe method was the most widely used. The LGC value was determined by a traceable primary method, providing an accurate measurement of the creatinine content and validated in an international high-level interlaboratory comparison. 23
Conclusions
These materials are clinically relevant since they cover both the normal and pathological concentration range for electrolytes and creatinine.
The certified values obtained by LGC for these materials agree well with the analysis undertaken by the WEQAS Reference Laboratory and from data in the WEQAS General Chemistry scheme, with the exception of creatinine at a low concentration. This is attributed to a large number of participants using the kinetic Jaffe method. The use of CRMs such as these will provide a mechanism for clinical pathology laboratories to establish independent traceability of their routine methods to higher order reference methods. Where global treatment or disease staging goals are used, harmonization of methods is essential for meaningful results. Specificity issues such as that identified for the Jaffe reaction cannot however be solely addressed by the use of this material. Professional bodies and EQA organizations need to work with industry to identify and discourage the use of inappropriate methods and to improve the specificity of routine methods where clinically indicated. The CRMs described in this paper form an integral part of this process. Laboratories and manufacturers can obtain these materials from LGC Promochem (
Footnotes
ACKNOWLEDGEMENT
The work described in this paper was supported by the Department for Innovation, Universities and Skills as part of the National Measurement System Chemical and Biological Metrology Knowledge Base Programme.