
Abstract
Abstract
Background
Determination of urinary free cortisol (UFC) is an important adjunct for the assessment of adrenal function. In this study, we have analysed cortisol concentrations in urine samples by gas chromatography-mass spectrometry (GC-MS), liquid chromatography-tandem mass spectrometry (LC-MS/MS) and two immunoassays. The results were compared with GC-MS. The interference of cortisol ring-A metabolites in immunoassays was also assessed.
Methods
The GC-MS technique involved solvent extraction, LH-20 clean-up and derivatization. Only solid-phase extraction procedure was used for LC-MS/MS. The samples were analysed in positive electro-spray ionization mode, monitoring the transitions for cortisol and deuterated-cortisol at m/z 363.3 > 121.2 and m/z 365.3 > 122.2, respectively. Immunoassays were performed according to the manufacturer's instructions.
Results
When compared with GC-MS results both immunoassays (Coat-A-Count; approximately 1.9-fold, Centaur; approximately 1.6-fold) overestimated UFC concentrations. Cortisol ring-A dihydro- and tetrahydrometabolites contribute significantly to this overestimation. There was no interference by these metabolites in either GC-MS or LC-MS/MS methods. The sensitivity of the LC-MS/MS procedure was 2 nmol/L and the intra- and inter-assay variations were <5% in each quality-control sample. The comparison of the UFC results achieved by assaying the study samples with GC-MS and LC-MS/MS indicated that the agreement between the two methods was excellent (LC-MS/MS = 1.0036GC-MS – 0.0841; r 2 = 0.9937).
Conclusions
The interference of cortisol ring-A metabolites in immunoassays contribute to overestimation of UFC concentrations. The LC-MS/MS procedure had the sensitivity, specificity, linearity, precision and accuracy for the determination of UFC concentrations. The method is suitable for routine use provided that method-dependant reference values are established.
Introduction
Prolonged exposure of the body to elevated cortisol concentrations and loss of di-urinal rhythm are characteristic of Cushing's syndrome. 1–3 The syndrome is not very common, with an estimated annual incidence of 0.7–6 cases per million. 4,5 The associated high morbidity requires careful evaluation by clinical and laboratory tests leading to appropriate diagnosis and treatment. Analysis of urinary free cortisol (UFC) is used as a laboratory screening test for Cushing's syndrome. 6,7
Routine determination of UFC in many clinical biochemistry laboratories is performed by immunoassay. These are generally, however, based on the serum cortisol assay methods, but may be modified by introduction of a solvent-extraction procedure. UFC immunoassays are prone to interference. 8 The most commonly used antibody in cortisol immunoassays is raised against cortisol-3- (o-carboxymethyl)-oxime conjugates. This provides acceptable specificity for serum assays but concentrations of urinary ring-A cortisol metabolites, 9,10 dihydrocortisol (5α- and 5β-) and tetrahydrocortisol (3α5α-, 3α5β-, 3β5α- and 3β5β-) and other related substances 11 are high when compared with cortisol concentrations and introduce gross-positive (40–60%) bias 12,13 to the free cortisol concentrations in urine assays. Introduction of high-performance liquid chromatography (HPLC) followed by an immunological or UV endpoint determination could eliminate interfering cortisol metabolites leading to a more specific assay. 14,15 However, these methods are still susceptible to interference by some drugs. 16
The use of gas chromatography-mass spectrometry (GC-MS) could overcome all these problems of specificity. GC-MS procedures, with their inherent sensitivity, selectivity and accuracy, are considered to be the ‘gold’ standard for steroid hormone analysis. 17 GC-MS techniques are extensively used as analytical methods in the preparation of certified European Reference Materials, 18 in the assignment of target values to external quality assessment samples 13,19 and also in the evaluation of assays for steroid hormones. 20 However, GC-MS assays are labour intensive and not conducive to high-throughput techniques. Consequently, they are not suitable for a busy routine laboratory.
Liquid chromatography-tandem mass spectrometry (LC-MS/MS) is considered to be the best alternative to GC-MS for the analyses of small molecules, and clinical biochemistry laboratories are increasingly investing in this technology.
In this manuscript, we report comparative data of urinary cortisol concentrations determined by GC-MS, LC-MS/MS and two immunoassay techniques. The data concerning the interference of ring-A cortisol metabolites in immunoassay methods are also included.
Materials and methods
Chemicals/consumables
All common laboratory reagents were of Analar grade (VWR International, Poole, UK). Aqueous reagent solutions were prepared with tissue culture grade deionized water.
Acetone, acetonitrile chloroform, cyclohexane, dichloromethane (DCM), ethyl acetate, methanol and toluene, all HPLC grades, were obtained from Fisher Scientific UK Ltd., Loughborough, UK, and used without further purification. Dichlorodimethysilane (DMDS) was purchased from Sigma–Aldrich Co. Ltd., Poole, UK. All disposable and re-usable glassware was silanized before use. The glassware was soaked in a 10% solution of DMDS in toluene for 3–5 min. The silanized glassware was then first washed with toluene, twice with methanol and air-dried.
Heptafluorobutyric acid anhydride (HFBA) was obtained either from Sigma–Aldrich Co. Ltd., or from Perbio Science (Pierce Biotechnology) UK Ltd., Tattenhall, UK. Sephadex LH-20 was purchased from GE Healthcare (Amersham Bioscience), Little Chalfont, UK.
Analytes
High-purity cortisol (Sigma Reference Standard, Product Code: H5885) and 5α-androstane (etioallocholane) were obtained from Sigma-Aldrich Co. Ltd. Internal standard 1,2-d2 -cortisol was purchased from C/D/N Isotopes Inc., Pointe-Claire, Quebec, Canada via QMX Laboratories Ltd. Thaxted, UK. Cortisol metabolites 5α-(allo) and 5β-dihydrocortisol, 3α5α-(allo), 3α5β- and 3β5α-tetrahydrocortisol were obtained from Steraloids Inc., Newport, Rhode Island, USA.
Stock standard solutions (A, B, C) of cortisol, d2 -cortisol and cortisol metabolites were prepared gravimetrically in methanol; the concentrations of these stock standards solutions were 100 mg/L (A), 1 mg/L (B) and 100 μg/L (C). Only one stock standard solution (1 g/L) was prepared from 5α-androstane in methanol.
All stock standard solutions were stored at −20°C or below and allowed to equilibrate at room temperature (20–22°C) for at least 1 h before use.
Standards
The standards used in the GC-MS and LC-MS/MS assays were prepared from the methanolic stock standards solutions A,B and C, respectively.
GC-MS standards were prepared in silanized reaction vials (2 mL) containing 5α-androstane (50 μg) by addition of varying amounts of stock solutions B and C to give concentrations of 0, 10, 30, 60, 90 and 120 ng/vial (equivalent to 0, 28, 83, 166, 248 and 331 nmol/L) cortisol. Internal standard (50 ng; 138 nmol/L) was then added to each vial. Vials containing both normal and deuterated standards were dried under a gentle stream of nitrogen at 30°C before derivatization.
LC-MS/MS standards, at similar concentrations to those prepared for GC-MS, were prepared in a steroid-free urine sample. This was achieved by using reverse-phase solid-phase extraction (SPE) columns (Supelco Discovery® DSC-18, 6 mL, 1 g. Sigma–Aldrich) conditioned with methanol (5 mL) and deionized water (5 mL). Urine sample (5 mL) was applied to each column and the eluates were collected and pooled. SPE columns containing the bound steroid were discarded. Pooled urine eluates were applied once more to freshly conditioned SPE columns to ensure absence of cortisol. A 20 mL aliquot of steroid-free urine was used to prepare each standard. Urinary cortisol standards were then dispensed (1.2 mL) into 2 mL cryovials (NalgeNunc International, via Fisher Scientific UK Ltd.) and stored at −20°C or below, until used.
Samples
Urine samples (n = 60) used in the study were collected from normal male (n = 42) and female (n = 18) subjects. All volunteers provided written consent to participate in the study. Subjects collected morning (08.00–10.00 h) and evening (16.00–22.00 h) spot urine samples into plain universal containers. The samples were divided into three aliquots, labelled and stored at −20°C or below until analysed by the respective assay procedure. Samples were assayed blind by three laboratories where none of the laboratories knew the results until they were collated.
Twenty-four hour urine samples from female (n = 83) and male (n = 35) patients (n = 118) were randomly selected and used in the study. These samples were generally from regional and supra-regional requests for UFC measurement. Following analysis with Coat-A-Count immunoassay, samples with adequate volume were stored at −20°C or below until assayed by LC-MS/MS. The study was registered with the Local Ethics Committee and according to their advice, patients’ samples were used in the study following the Cardiff and Vale National Health Service (NHS) Trust's Research and Development Department's guidelines.
Samples for the assessment of interference of the cortisol ring-A metabolites were prepared by spiking a random male urine sample. A set of samples were prepared for each compound containing 0, 100, 300 and 500 nmol/L of respective metabolite. These were treated as normal samples and stored at −20°C or below until assayed.
Gas chromatography-mass spectrometry
GC-MS procedure for the determination of urinary cortisol is based on the reference method developed and validated by the Reference Laboratory for the WEQAS endocrine scheme. The only difference was that the bracketed standard curve in the reference procedure was replaced with a conventional dose–response curve to allow the samples to be assayed blindly. Urine samples were thawed at room temperature, centrifuged (2000 rpm, 5 min) to remove sediment and particulate matter and dispensed (1 mL), in duplicate, into ground-glass-stoppered tubes (Quickfit, NS 14/23). The samples were then diluted with 2 mL of saline (0.9% NaCl) and the internal standard stock B solution (60 μL) was added to each tube using a microlitre syringe. The tubes were briefly vortex-mixed, equilibrated for 2 h at room temperature or overnight at 4°C. After equilibration, the extraction solvent (DCM, 7 mL) was added. Tubes were stoppered and agitated using a multivortex mixer for 5 min, centrifuged (2500 rpm, 10 min) and the aqueous phase (top phase) discarded. Extracts were decanted into labelled silanized glass tubes (13 × 100 mm), placed in a heating block and evaporated to dryness under a gentle stream of nitrogen at 30°C.
The sample extracts were cleaned-up further by LH-20 chromatography. The LH-20 (0.4 g per column per sample) was weighed into a ground-glass-stoppered conical flask (50 mL) and soaked overnight at room temperature in approximately 40 mL of chloroform–cyclohexane–methanol (100:80:15, v/v) solvent mixture. Silanized Pasteur pipettes (15 cm) were plugged with silanized glass wool and packed with overnight swollen LH-20 to give a column height of 4 cm (equivalent to 0.4 g of dry LH-20) for each sample extract. The columns were washed with 3 mL of fresh solvent mixture and dried sample extracts were dissolved in solvent mixture (200 μL) and transferred into the corresponding LH-20 column with a clean silanized Pasteur pipette. Tubes were washed once more with the same amount of solvent mixture and the washings were again transferred into the columns. Columns were washed with the solvent mixture (1 mL) and the cortisol was then eluted with 1.3 mL of solvent mixture into clean snap cap, conical bottom reaction vials (Chromacol Ltd., Welwyn City Gardens, UK) containing 50 μg of 5α-androstane to reduce deterioration of cortisol 21 and evaporated to dryness under a stream of nitrogen at 30°C.
Acetone (30 μL) and HFBA (30 μL) were added to each vial and the reagents were mixed briefly to initiate the derivatization reaction. After 45 min at room temperature, the contents of the vials dried under nitrogen, and cyclohexane (50 μL) was added.
A MD800 mass spectrometer coupled with a CE8000 series gas chromatograph and an AS 800 auto sampler (Thermo Electron Corporation, Basingstoke, UK) was used for GC-MS assay. The GC column (J&W, DB-5 ms; 15 m long; 0.32 mm internal diameter; 0.25 μm film thickness) was from Agilent Technologies UK Ltd., Stockport, UK.
Heptabutyril derivative of cortisol was injected (2 μL) to the GC column via a split/splitless injection system at 230°C. The sample was injected at 100°C (column head temperature) and the GC oven temperature was ramped up at a rate of 30°C/min to a final temperature of 270°C, and held for 9 min. Helium (grade A, >99%; British Oxygen Company, Bristol, UK) was used as a carrier gas and maintained at a constant flow with a column head pressure of 35 kPa (5 psi). The temperature of the GC-MS transfer line (interface) and the source was 275°C and 250°C, respectively. The MS was set-up to perform under electron impact (70 eV) and selective-ion monitoring conditions by the control of MassLab data system. Ions were monitored at m/z 489 for cortisol and m/z 491 for d2 -cortisol, respectively. Retention time of the derivatized cortisol was 7.3 min. The chromatogram peaks were then integrated to determine peak areas and the ratios of the peak areas for cortisol and d2 -cortisol were calculated using the GC-MS data system.
A set of quality-control samples containing high (approximately 160 nmol/L) and low (approximately 80 nmol/L) cortisol concentrations and a sample tube containing only saline as a procedural blank were also included in every run and processed identically to the study samples.
Immunoassays
Two immunoassay procedures, DPC, Coat-A-Count® Cortisol (Diagnostic Products Corporation, Llanberis. UK) and ADVIA Centaur® Cortisol (Bayer HealthCare, Diagnostic Division, Newbury, UK) were used. Coat-A-Count® cortisol is a manual assay and employs antibody-coated tubes and a radioiodinated label. ADVIA Centaur® cortisol is a fully automated random access immunoassay and uses paramagnetic solid-phase coupled antibody and acridinium-based tracer for the chemiluminescence endpoint determination. In both assays, DCM was used for the extraction of urine samples. Both assays were performed according to the manufacturers’ instructions.
Liquid chromatography-tandem mass spectrometry
Urine samples were extracted with Waters Oasis® HLB (1 mL, 30 mg) Extraction Cartridges (Waters Ltd., Watford, UK). Aliquots of urine samples (1 mL) containing 83 nmol/L (30 μL out of methanolic stock B) of d2 -cortisol were applied to conditioned (first 1 mL of methanol followed by 1 mL of deionized water) columns. The columns were fitted into a sample-processing manifold and the washings and the fractionations were carried out under vacuum. Following application of the samples, the columns were washed with 1 mL of 5% methanol in deionized water (v/v). Bound cortisol fractions were eluted with methanol (1 mL) into clean glass test tubes (12 × 75 mm), which were then evaporated to dryness at 30°C under a stream of nitrogen and reconstituted with 250 μL of 50% aqueous methanol (v/v); 20 μL of this extract was injected to LC-MS/MS for analysis.
The LC-MS/MS instrument was a Quattro™ Micro triple quadrupole tandem mass spectrometry (Waters Ltd., Watford, UK) operating with electro-spray ionization mode and coupled to a Waters™ 2795 Alliance HT LC System. The column was an XTerra® C18 (2.5 μm, 4.6 × 50 mm), Waters Ltd. Chromatographic mobile phases were (a) deionized water and (b) methanol, both containing ammonium acetate (2 mmol/L) and formic acid (0.1%, v/v) and delivered at a flow rate of 0.6 mL/min. At this flow rate, the mixture of 45% solution A and 55% of solution B was delivered for 3 min. The flow rate was then increased to 1 mL/min for 30 s with a mixture consisting of 5% solution A and 95% solution B, followed by 30 s at 1 mL/min with the original mixture. Retention times for cortisol and d2 -cortisol was 2.5–2.6 min and the analysis time for each sample was 4.5 min.
In the multiple reaction monitoring (MRM) mode, the instrument was set to monitor m/z 363.3 to m/z 121.1 (363.3 > 121.2) and m/z 365.3 to m/z 122.2 (365.3 > 122.2) transitions for cortisol and d2 -cortisol, respectively. Source probe temperature was 140°C, desolvation temperature 350°C, cone voltage 26V, collision energy 25 eV and the desolvation nitrogen gas flow 10 L/min. Data acquisition and quantitation of cortisol concentrations were achieved by using Waters MassLynx 4.0 and QuanLynx software.
Statistics
Statistical analysis of the results was carried out using the GraphPad Prism (version 4.03) scientific graphing, curve fitting and statistical software (GraphPad Inc., San Diego, CA, USA). Method comparisons included Bland–Altman 22 plots and Deming 23 regression analysis.
Results
Gas chromatography-mass spectrometry
The calibration curve for UFC, covering the range 0–331 nmol/L, was constructed by plotting the peak area ratios of analyte to internal standard versus concentrations using the GraphPad Prism or Multi-Calc (PerkinElmer LAS (UK) Ltd., Beaconsfield, UK) data reduction software and a regression curve fit model. Although we use bracketed standards in our reference method, use of an ordinary calibration curve has not affected the results. Identical results were achieved by re-assaying some of the urine samples with bracketed standards.
Cortisol is more prone to deterioration than the other steroids during the sample preparation process. 21 To minimize deterioration, small numbers of samples were included in each assay run. However, the precision of the method was excellent. This was assessed by establishing two urine pools of high and medium/low concentrations of cortisol. Twelve aliquots of each pool, processed in one assay, gave the intra-assay coefficients of variation (CV) of 2.09% and 0.42% at concentrations of 84.5 and 163.8 nmol/L, respectively. These pools were subsequently split into aliquots, stored at −20°C or lower and used as quality controls for subsequent routine assays, giving the inter-assay variance. The inter-assay CV (n = 14) were 3.34% and 2.47% at 86.7 and 164.7 nmol/L, respectively.
Liquid chromatography-tandem mass spectrometry
Calibration curves were constructed by plotting ratios of peak areas for cortisol and d2 -cortisol versus concentrations using the QuanLynx software. The curves obtained were always linear. As given under materials and methods, each sample and calibration standard contained 83 nmol/L of deuterated internal standard. A small non-deuterated cortisol peak was visible in the zero standard, equivalent to approximately 0.2 nmol/L of cortisol. This was due to non-deuterated cortisol present in the internal standard. This amount was accepted as constant in all standards and samples and not incorporated in the calculation of the results.
The limit of quantification of the procedure, defined here as the least amount of cortisol concentration measurable with <10% CV, was 2 nmol/L. This was achieved by diluting a urine sample with steroid-free urine matrix to give approximately 2, 3, 4, 6 and 10 nmol/L cortisol concentrations and measuring them in replicates (n = 6) with LC-MS/MS. All samples had CV <10% and 2 nmol/L was chosen as the sensitivity of the assay.
The imprecision of the method was assessed by assaying the same internal quality urine pools established for GC-MS procedure. The intra-assay CV (n = 12) was 3.7% and 4.3% at 82.2 and 162.3 nmol/L, respectively. These pools were included in every assay to assess the between-batch variation. The inter-assay variation (n = 9) of the method was 4.9% and 4.2% at mean cortisol concentrations of 81.9 and 161.6 nmol/L, respectively.
The linearity of the LC-MS/MS procedure was checked by assaying varying volumes of a urine sample containing high concentrations (309.3 nmol/L) of cortisol. GC-MS result of this sample was 306.9 nmol/L. The data (Table 1) indicate that the agreement between the expected and measured concentrations of cortisol is excellent.
Determination of UFC by liquid chromatography-tandem mass spectrometry (LC-MS/MS) in varying volumes of a sample containing high concentration of cortisol
Comparison of the LC-MS/MS method with the GC-MS procedure indicated excellent correlation (r 2 = 0.9937) between the two methods. The slope of regression line was not significantly different from one, or the intercept from zero (LC-MS/MS = 1.0036GC-MS − 0.0841). The Bland–Altman difference plot, presented in Figure 1, also showed that the bias between the two methods was minimal.
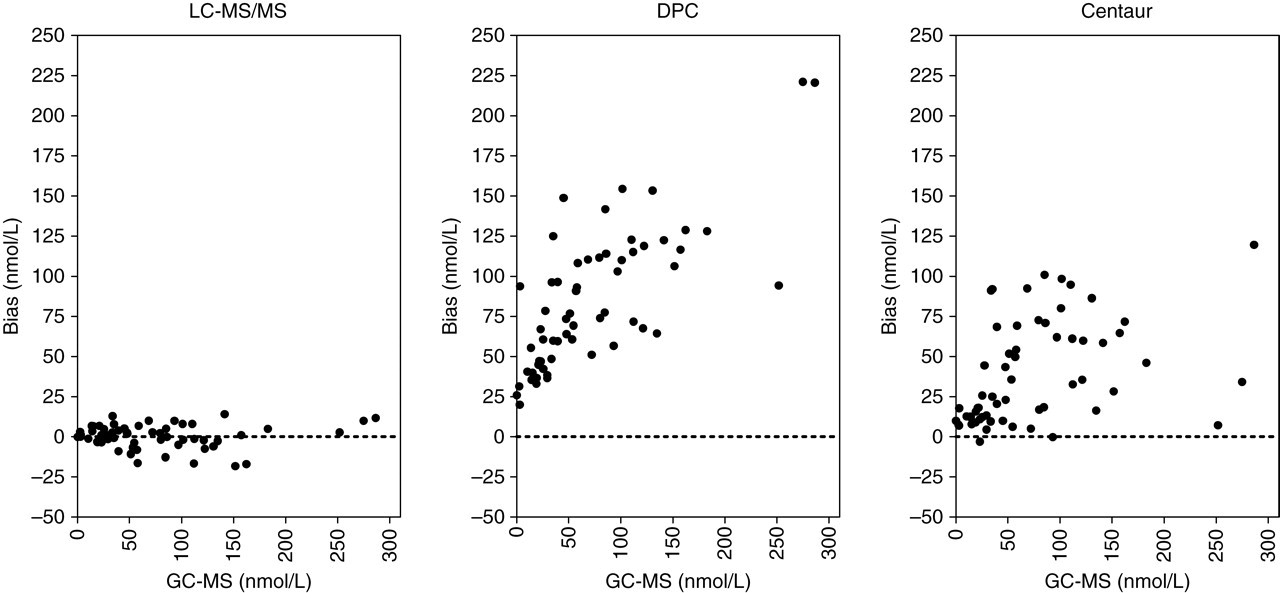
Bland–Altman bias plots of urinary cortisol determined by the liquid chromatography-tandem mass spectrometry, DPC and Centaur immunoassays compared with gas chromatography-mass spectrometry results. (Spot samples from healthy subjects)
The difference between the morning (median 103 nmol/L; range 24–298 nmol/L) and evening (median 31 nmol/L; range 3–118 nmol/L) UFC values, assessed with paired t-test, was significant (P < 0.0001).
Immunoassays
In our Department, the current routine procedure for the determination of UFC is Coat-A-Count® immunoassay. The ADVIA Centaur® assay is also available. Both assays grossly overestimated the UFC concentrations compared with GC-MS. This difference is clearly indicated by the Bland–Altman plots in Figure 1. Although results from both assays compared with GC-MS gave good correlation coefficients (r 2 values; 0.9311 for Coat-A-Count assay and 0.9340 for Centaur assay) the slope of the regression lines deviated significantly from one (Coat-A-Count = 1.7873GC-MS + 28.1971 and Centaur = 1.5196GC-MS + 5.808, respectively). The overestimation was approximately 1.9-fold with Coat-A-Count and 1.6-fold with the Centaur assay compared with GC-MS results. Furthermore, a paired t-test indicated that the difference between the UFC results of GC-MS and Coat-A-Count (P < 0.0001) and the results of GC-MS and Centaur (P < 0.001) were significant.
Interference studies
A set of samples were prepared for each cortisol ring-A metabolite by spiking a urine pool at concentrations of 100, 300 and 500 nmol/L. These samples were then subsequently assayed for cortisol by GC-MS, LC-MS/MS and Centaur and Coat-A-Count immunoassays. The results of the immunoassays are presented in Table 2. The interference of 5α-dihydrocortisol was the highest in both immunoassays. The concentrations were over four-fold and over five-fold higher with DPC and Centaur assays, at 500 nmol/L concentration in relation to base line concentrations, respectively. There was also a considerable interference of 5β-dihydrocortisol in the Centaur method compared with the Coat-A-Count assay. The interference of tetrahydrocortisol metabolites was not as high as the dihydrocortisol isomers. In both assays the basal concentrations were increased approximately two-fold at the highest concentration of 3α5α- and 3β5α-tetrahydrocortisol. The 3α5β-tetrahydrocortisol was found to be the least interfering compound in both immunoassays.
Assessment of interference in urine free cortisol (UFC) immunoassays following addition of varying concentrations of cortisol ring-A metabolites to a urine sample
These samples were also assayed by GC-MS and LC-MS/MS. There was no interference in both assays and the results were similar to basal concentration at all concentrations of metabolites. The mean ± SD result of all samples (n = 16) was 23.6 ± 1.3 nmol/L with LC-MS/MS and 24.9 ± 0.9 nmol/L with GC-MS, respectively. In addition to cortisol ring-A dihydro- and tetrahydro-metabolites, we have not observed interference of prednisolone, 11-deoxycortisol, cortisone, desoxycorticosterone, 21-deoxycortisol and dexamethasone in the LC-MS/MS method.
There was no ion suppression or enhancement due to sample matrix as evaluated by the post-column infusion method 24 at the retention time of cortisol.
Patient samples
These urine samples (n = 118) were routinely assayed by Coat-A-Count immunoassay. Cortisol concentrations were also determined by the LC-MS/MS method. Gross overestimation of UFC concentrations by immunoassay when compared with LC-MS/MS method was apparent as indicated by Bland–Altman plot in Figure 2. The differences between the two methods increase at higher UFC concentrations. The regression line comparing the two methods was Coat-A-Count = 1.7920LC-MS/MS + 49.1468 and the correlation coefficient was r 2 = 0.8517. The results of the two samples, which were not included in the statistical analysis, were greater than the top standard (1380 nmol/L) of the Coat-A-Count assay. The corresponding LC-MS/MS result for the one sample was 31 nmol/L. We could not achieve a result for the other sample with LC-MS/MS. There was an unidentified overlapping peak close to cortisol retention time at the m/z 365.3 > 122.2 transitions (Figure 3). Therefore, no integration was possible to calculate the cortisol concentration. Further investigation revealed that the patient was on budesonide, salbutamol, rabeprazole, co-amoxiclav and folic acid treatment during the collection of urine sample. The source of the peak was not assessed.
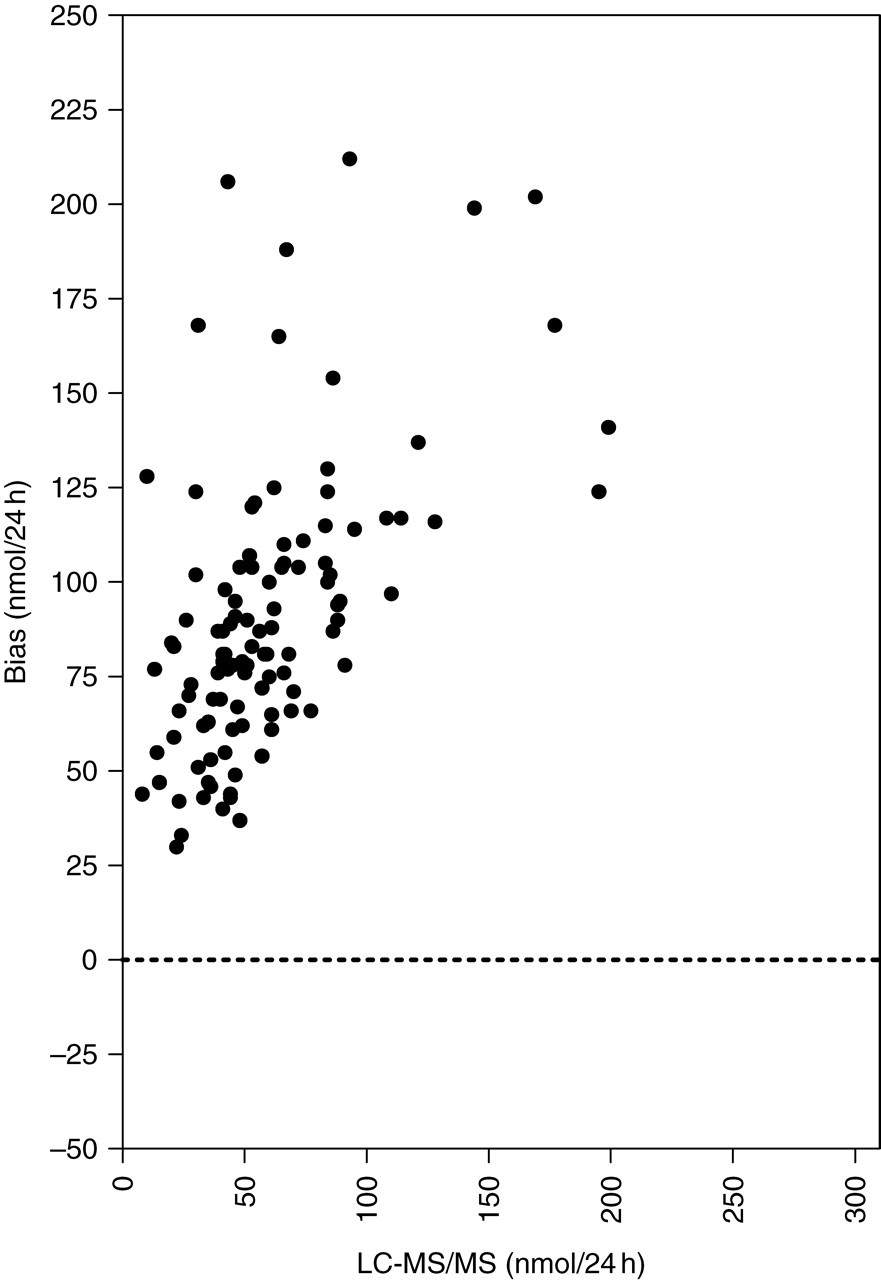
Bland–Altman bias plots of urinary cortisol results in patient's samples determined by liquid chromatography-tandem mass spectrometry and DPC Coat-A-Count immunoassay. (24-h collections of routine patient samples)
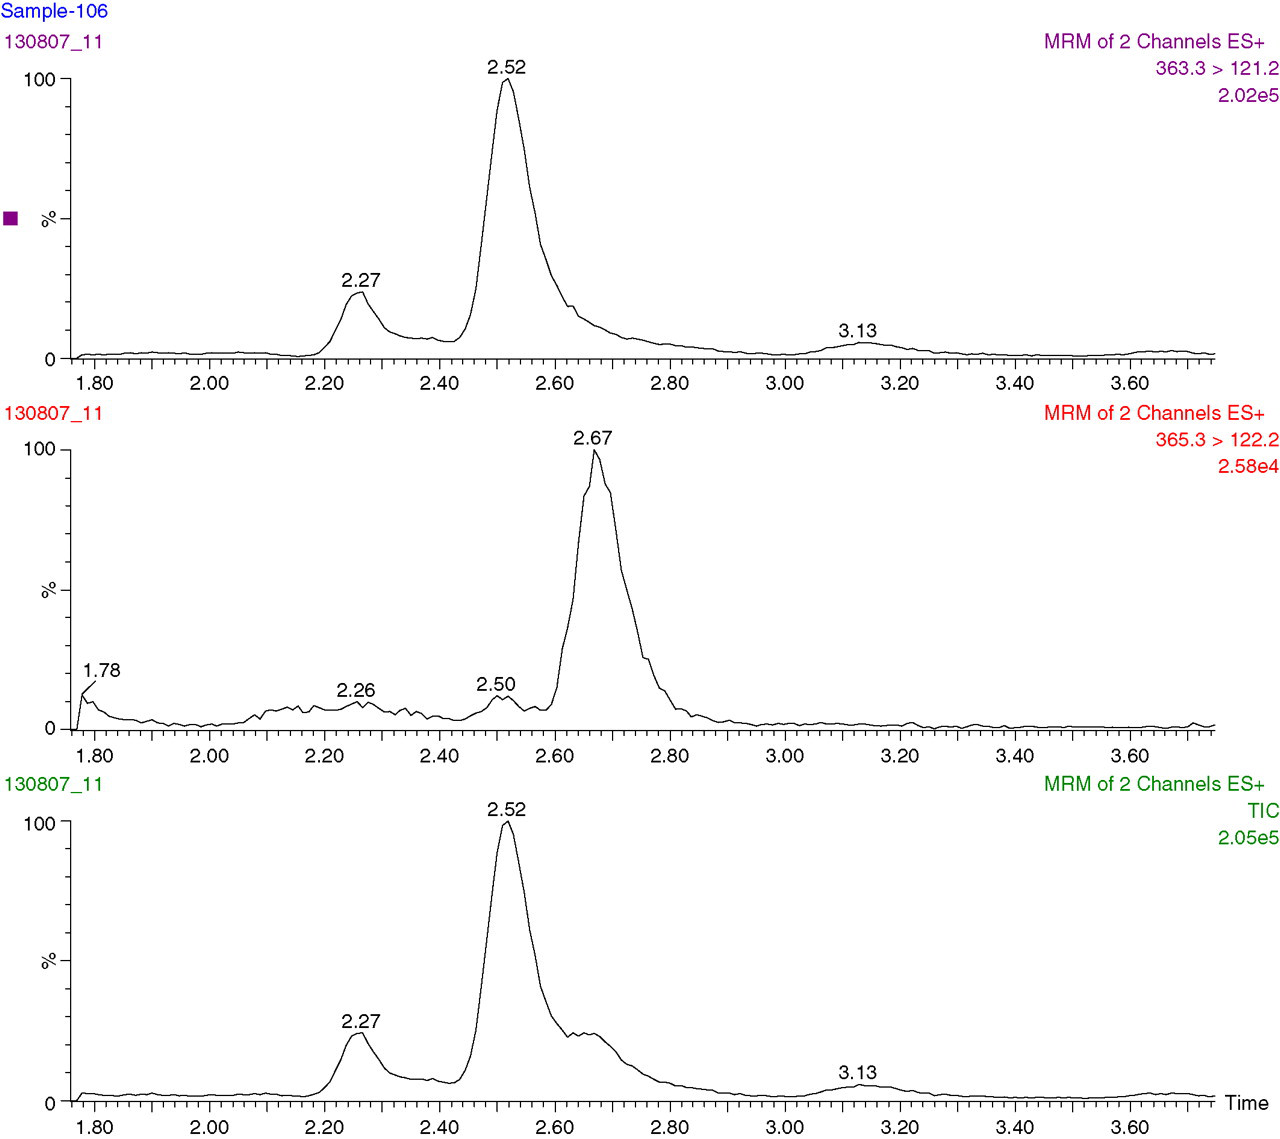
Liquid chromatography-tandem mass spectrometry chromatogram from a urine sample collected from a patient on budesonide, salbutamol, rabeprazole, co-amoxiclav and folic acid treatment. Cortisol concentration could not be calculated due to the overlapping peak at m/z 365.3 > 122.2 transitions
Discussion
The GC-MS procedures, because of their inherent specificity, precision and accuracy, are generally accepted as reference methods for the determination of steroid hormone concentrations in biological fluids. The GC-MS method we used in this study had IFCC-recommended performance characteristics and accuracy for the determination of samples generated by clinical investigations. 25 Precision studies revealed that the intra- and inter-assay CV never exceeded 4% in each quality-control sample, and there was no interference from the structurally related compounds, solvents or biological or non-biological matrices tested. The sample preparation was prolonged, i.e. equilibration of samples with internal standard, solvent extraction, LH-20 chromatography and derivatization before injection to the GC-MS. These procedures require 6–7 h to process a 20–30 sample batch, including standards, for an experienced GC-MS operator. Furthermore, using a short 15 m column, the run-time (injection-to-injection) for each sample was 23 min. It is therefore not surprising to find that over the years immunoassay procedures became the method of choice for a busy clinical biochemistry laboratory, because they are relatively easy to perform, cost-effective and a large number of samples can be processed in one batch.
Despite their popularity, however, there are large discrepancies between the immunoassay methods in terms of reporting the values for patient samples and reference ranges. These differences are mainly due to the susceptibility of the antibodies to interferences or cross-reactions by the structurally related steroids of cortisol. It is well known that steroids are haptenic molecules and require conjugation to a carrier protein to enhance an immune response in the host animal. However, the antibodies raised, due to stearic hindrance, cannot recognize the changes in the steroid structure where the site is used to link to carrier protein. Cortisol-3-(o-carboxymethyl)-oxime/carrier protein derivatives are the most commonly used immunogen to raise cortisol antibodies. Although not disclosed by the manufacturers, due to interference of cortisol ring-A metabolites, we believe that the antibodies used in the Coat-A-Count and Centaur immunoassays are also both raised from the C-3 position. Cortisol is irreversibly reduced to 5α- and 5β-dihydrocortisol by the 5α- and 5β-reductase enzymes. These dihydro-metabolites are reduced further by 3α-hydroxysteroid dehydrogenases to form tetrahydro-metabolites. Depending on the age, gender and metabolic rate of the individual, concentrations of these ring-A reduced metabolites range from 1.8 to 12.4 μmol/24 h. 10,26 High concentrations of these metabolites contribute significantly to overestimation in UFC immunoassays using antibodies prepared from the C-3 position of cortisol derivatives. Our interference studies indicated that when a urine pool was spiked with ring-A reduced cortisol dihydro- and tetrahydro-metabolites, there was a great deal of overestimation in both Coat-A-Count and Centaur immunoassays (Table 2). Baseline concentrations of UFC was increased over 4-fold in Coat-A-Count and over 5-fold in the Centaur assay when 500 nmol/L of 5α-dihydrocortisol was added to a urine sample. Interference of both 5α- and 5β-dihydrocortisol was higher than the tetrahydro-metabolites. The least interfering compound in both assays was the 3α5β-tetrahydrocortisol. The cross-reactions provided by the manufacturers include tetrahydrocortisol data. Although which isomer of tetrahydrocortisol was used was not indicated, the cross-reaction of this compound was stated as 0.34% for Coat-A-Count and not detectable for the Centaur assays. Cross-reactivity of 4.60% for 3α5α (allo)–tetrahydrocortisol was also included in the specificity data of Centaur assay. Recently, it was reported that the glucuronide conjugates of the ring-A reduced cortisol metabolites also interfere in UFC immunoassays. 27 Clearly, current immunoassays employing antibodies raised against C-3 conjugates measure more than UFC. It was suggested that unless an analytical method is used, the terminology for the immunoassay result should be designated as ‘urinary free corticoids’ or ‘immunoassay-reactive material’ or ‘cortisol-like material’ or ‘urinary glucocorticoid index’ rather than UFC. 12,28 Another problem associated with the immunoassays is that any change of an assay component may change the results. During our interference studies, the manufacturer of the Centaur assay replaced the light reagent necessary for the determination of chemiluminescent endpoint. This resulted in slight overestimation of serum cortisol concentrations but significantly higher UFC concentrations. Study urine samples collected from volunteers indicated that the Coat-A-Count assay overestimates UFC concentrations approximately 1.9-fold and Centaur assay 1.6-fold higher than the GC-MS results. The updated Centaur assay, in which, according to the manufacturer, there has been a change in the light reagent, now measures UFC concentrations higher than the Coat-A-Count assay. The baseline UFC concentration for urine pool used for interference studies (Table 2) was 64 nmol/L with Coat-A-Count assay and 129 nmol/L with the Centaur assay, respectively. GC-MS result for the same pool was 24.9 nmol/L. We were not able to repeat the study samples with the new assay component because Centaur is not the routine UFC assay within the laboratory. In addition, the manufacturer is in the process of re-evaluating the assay and re-establishing the reference values.
The intra- and inter-assay CV of the LC-MS/MS method was <5% at UFC concentrations of approximately 80 and 160 nmol/L. The precision is better than the other published procedures. 29–31 This may well be due to the differences in the sample volumes taken into the assays. We have processed 1 mL of urine sample for the quantification of UFC concentrations. McCann et al. 29 reported that when processing 300 µL sample, the CV was <10% at concentrations of 25.0, 49.6 and 344 6 nmol/L. When 500 μL of urine sample was used, Taylor et al. 31 reported that the intra- and inter-assay CVs ranged from 7.2% to 12% at cortisol concentrations ranging from 6 to 726 nmol/L. In the study of Kushnir et al. 30 direct injection of the urine sample (200 µL) without pre-assay purification but using only a C18 guard cartridge, the overall within- and between-assay imprecision was <8.5%. The precision may be comparable to our method, but the major problem with direct injection is the increased chance of interference of structurally related compounds. They reported that prednisolone and the lipid-lowering drug fenofibrate interferes in approximately 1% of the patient samples at m/z 363 > 121 transitions. This interference was not present at m/z 363 > 97 transitions. They suggest that monitoring at least two MS/MS transitions allows detection of interferences. When an interference was observed at m/z 363 > 121 transitions the quantification was performed on the m/z 363 > 97 transition. This requires assessing every peak for each sample at m/z 363 > 121 transitions to monitor interference. We have not observed any interference among the drugs and steroids tested at m/z 363.3 > 121.2 transitions following SPE sample clean-up procedure and injecting a small volume (20 μL) of sample to LC through a C18 guard cartridge and C18 column. However, there was an unidentified peak close to cortisol retention time at m/z 365.3 > 122.2 transitions (see Figure 3) in one sample from a patient on budesonide, salbutamol, rabeprazole, co-amoxiclav and folic acid treatment. Evidently, one of the compounds or a combination of compounds or one of their metabolites is the source of the unidentified peak. We have not investigated the source of the interference yet.
Comparison of UFC results (n = 60) obtained by LC-MS/MS and GC-MS revealed that there was an excellent agreement between the two methods (r 2 = 0.9937). The regression line between the LC-MS/MS and GC-MS results was LC-MS/MS = 1.0036GC-MS − 0.0841. The deviation of the slope from one and the intercept from zero of the regression line was insignificant. According to our knowledge, this is the first study comparing extensively the UFC results achieved by LC-MS/MS and GC-MS procedures.
In summary, the LC-MS/MS method described in this communication has satisfied generally accepted performance criteria in term of sensitivity, linearity, precision and accuracy for the measurement of cortisol in urine samples. The assay is relatively easy to perform and suitable for the determination of a large number of samples generated by clinical investigations. We are now in the process of establishing method-dependant reference values before we offer this assay as part of our routine clinical steroid service.
Footnotes
ACKNOWLEDGEMENTS
The authors wish to acknowledge the Cardiff and Vale NHS Trust Research and Development Office for the provision of a Project Grant (ID: 04/dtd/3091). They also thank to Mrs Annette Thomas, Director of WEQAS, for her continuous encouragement and support.