
Abstract
Abstract
Background
There is no agreed system for the reporting, classification and grading of the severity of quality failures in the clinical biochemistry laboratory.
Methods
A ‘Quality Query’ reporting system was set up to log all quality failures identified by staff and service users. Quality failures were classified into three major groups of the preanalytical, analytical and postanalytical phases with appropriate subcategories in each group. The severity of each quality failure was graded using a five-point scoring system incorporating both actual (‘A’) and potential (‘P’) score elements. The ‘A’ score measured the actual adverse impact of the quality failure on patient care, while the ‘P’ score measured the ‘worst case’ potential outcome that might have resulted. The system was assessed over a 19-month period.
Results
Three hundred and ninety-seven Quality Query reports were completed (0.085% of all requests). Breakdown by cause: pre-analytical phase – 88.9%, analytical phase – 9.6%, post-analytical phase – 1.5%. The quality failure severity ‘A’ scores were skewed towards a low adverse impact on patient care: 72.7% allocated an ‘A’ score of 1 (least severe grade). The ‘P’ scores were skewed towards a high potential impact on patient care: 65.9% allocated a ‘P’ score of 5 (most severe grade).
Conclusions
The Quality Query reporting system proved easy to integrate into routine laboratory practice. Although the great majority of quality failures had minimal adverse impact on patient care, the potential for adverse outcomes was much higher. This system generates important information on laboratory performance and helps inform risk management priorities.
Introduction
Clinical biochemistry laboratories provide data from the analysis of body fluids (principally blood and urine) to support the diagnosis and management of patients. The result (qualitative or quantitative) generated by the laboratory and accompanied by an interpretation where necessary is returned to the requesting clinician. The pathway beginning with test selection and ending with the return of a timely, accurate and correctly interpreted result to the clinician is a complex one. Its component elements include selection of the correct test, collection of the correct sample at the correct time from the correct patient, timely transportation to the laboratory under suitable conditions, appropriate and timely pre-analytical and analytical processing within the laboratory to generate a test result of suitable accuracy and timely transmission of this result to the requesting clinician with an appropriate degree and accuracy of interpretation. Error at any step in this complex pathway might result in adverse patient management and patient harm.
Robust quality management is now an integral component of good laboratory practice and is a requirement of laboratory accreditation schemes. 1–3 Quality management programmes largely focus on systematic audit as a method of detecting suboptimal performance. Such programmes have rarely incorporated specific attempts to identify and monitor laboratory errors in any systematic way. This may reflect, in part, the challenges of identification and definition of laboratory errors. Even the terminology in this area is unclear: the terms ‘blunder’, ‘error’, ‘mistake’ are all variously used with no agreed definition as to what they mean. 4–14 [The term ‘quality failure’ is preferred here over alternatives such as ‘error’ or ‘blunder’ as the latter carry connotations of failure on the part of an individual rather than focusing on weaknesses in systems. For the purpose of this paper, a ‘quality failure’ in relation to a laboratory test is defined as any failure to meet the required output quality necessary for optimal patient care. This includes problems occurring in the pre-analytical, analytical or post-analytical phases.] There is no agreed system for classifying quality failures by cause or grading their seriousness. Furthermore, there is no obvious method for the systematic identification of quality failures. This will depend in great part on the vigilance of laboratory staff or service users and their willingness to identify and report perceived problems. It is very likely that many quality failures go unrecognized and even if recognized go unreported to senior laboratory staff with the result that opportunities to take corrective action are missed.
Despite these uncertainties, the problem of quality failure is nevertheless a real one with current evidence from prospective studies suggesting a failure rate of between 0.012 and 0.6% of all laboratory test results. Although it is unclear to what extent and in what ways laboratories attempt to monitor quality failures as part of routine practice, it is likely that many, if not most, laboratories investigate and log more serious failures within a risk management framework with the aim of preventing further lapses.
The benefits of a structured approach to the identification of quality failures in the laboratory are obvious. This would provide the laboratory with an additional tool for identifying weakness in policies and procedures and allow it to formulate and prioritize corrective action with the overall aim of quality improvement. Such an approach would form a useful adjunct to the existing quality management procedures based largely on systematic audit.
The aim of this study was to develop a structured approach to the identification, classification and grading of quality failures within a biochemistry laboratory which could be incorporated into routine practice.
Methods
Laboratory setting
This study was performed in the clinical biochemistry laboratory of a district general hospital. The laboratory provides a broad and standard range of clinical chemistry tests to both hospital and community users (including a 24 h emergency service) and analyses some 290,000 requests (samples) per year. The laboratory has modern automated equipment. For the period reported upon, test requests were made using a hard copy test request form, the details of which were entered manually onto the laboratory database. Results were transmitted directly from analysers to the laboratory computer database with <0.01% of test results being entered manually. After analytical validation, all results falling outside pre-set limits (‘clinically remarkable’ and ‘credibility’ limits) or differing significantly from previous results on that patient (‘delta check limits’) were reviewed by senior laboratory staff prior to authorization. 15
Quality Query report form
Following an initial period of observation, a ‘Quality Query Report’ form was developed and distributed among all workstations in the laboratory. This contained the following headings: description of problem identified, reason for quality lapse, action to be taken. All staff were instructed to complete the ‘Description of problem identified’ section of the report form for any perceived actual or potential quality lapse anywhere in the pathway from test selection to the timely return of a report to the requesting clinician. Quality Query reports were to be completed even if the quality failure had been detected and corrected at an early stage within the laboratory. All members of staff irrespective of role or grade were authorized to complete Quality Query reports. Any actual or potential quality failures reported by a service user were also logged using a Quality Query report. Discussion on the rationale and mechanism for completing Quality Query report forms took place at staff meetings. The discussion stressed that identification of quality failures was part of a standard process of quality improvement and that all reporting would take place in a blame-free environment. All Quality Query reports were investigated initially by a senior member of the laboratory (usually the chief biomedical scientist) and where appropriate by liaison with clinical staff to assess the effect of any quality failure on patient care. The quality failure was then classified by cause and graded by seriousness on the basis of actual or potential adverse impact on patient care (see below) by senior laboratory staff. This was followed by a review of any relevant policies and procedures with corrective action taken as appropriate. Quality Query reports were discussed at the monthly meeting of the laboratory quality committee, which monitored trends in quality failures by cause and seriousness.
Quality failure classification system
A system for classifying quality failures on the basis of the major causative factor was developed (Box 1). This used the three major categories of the pre-analytical, analytical and post-analytical phases with a number of subdivisions in each so that each quality failure could be allocated a code relating to the specific cause of the failure. Code allocation was performed by a senior member of staff following completion of all the relevant investigations.
Categories of quality failure by cause*
1a Incorrect sample type
1b Incorrectly labelled sample/form
1c Incomplete or missing requestor location ID
1d Sample spillage in transit to laboratory
1e Sample spillage in laboratory
1f Sample transposition in laboratory
1g Incorrect entry of patient/test request data on the laboratorycomputer system
1h Sample did not reach laboratory
2a Incorrect analytical result generated (quality control satisfactory)
2b Error in transmission of result from analyser to laboratory IT system
2c Result issued despite failing internal quality control
3a Inappropriate delay in authorizing result
3b Failure to phone urgent or clinically remarkable result
3c Non-arrival of hard copy result
3d Inappropriate insertion (or omission) of interpretive comment
3e Incorrect manual entry of result
*This list is not exhaustive and includes only the more frequently occurring quality failures
Quality failure severity scoring system
Each quality failure was given a severity grading on the basis of both the actual (‘A’ score) or potential (‘P’ score) impact on patient care as outlined below. An identical five-point severity ranking scale was used for both ‘A’ and ‘P’ scores (Box 2). An adverse patient outcome was defined as any patient-related outcome that fell short of the optimum anticipated outcome. Examples might include: delay in discharge, need for additional venepuncture to repeat a test, morbidity as a result of inappropriate clinical management, mortality. The ‘A’ score described the actual clinical impact of the particular quality failure on the patient. The ‘P’ score described the ‘worst case’ potential impact of this type of quality failure. This is best illustrated by an example. Two patient samples are incorrectly labelled in a clinical area through sample transposition. This error was recognized at the result validation stage in the laboratory because of significant differences in results from the previous day for both patients. The results were not issued and new samples were requested on each patient. This resulted in a delay in availability of the test results and both patients were subjected to an additional venepuncture. It was not considered that the delay had had any major detrimental effect on patient management and therefore an ‘A’ score of 3 was allocated because of the requirement for additional venepuncture. However, the potential for patient harm as a result of this type of sample labelling error is considerably higher. It might have gone undetected had there been no previous laboratory results for the patients or if laboratory staff had been less vigilant. Therefore, a ‘P’ score of 5 was allocated to reflect the potentially very serious consequences of this type of quality failure on patient care. Severity scores were allocated by senior members of laboratory staff following liaison with clinical staff where appropriate.
Grading of quality failures by seriousness
1 Quality failure resulted in no change in clinical management and no adverse patient outcome
2 Quality failure resulted in minor clinical management change but no adverse patient outcome, e.g. delay in reporting test result caused a short delay in diagnosis but patient outcome was not affected
3 Quality failure resulted in minor adverse patient outcome, e.g. need for additional venepuncture
4 Quality failure resulted in moderate adverse patient outcome, e.g. patient started on lipid-lowering therapy on the basis of an incorrect cholesterol result
5 Quality failure resulted in significant adverse patient outcome, e.g. significant morbidity, mortality
The actual [‘A’] score records what the actual adverse outcome was for the patient. The potential [‘P’] score records the ‘worst case’ potential adverse outcome
To investigate between-observer consistency of ‘A’ and ‘P’ score allocation, 100 Quality Query reports were assessed and scored independently by two senior members of staff and the results compared.
Duration of study
The functioning of the Quality Query reporting system was studied over a period of 19 months (April 2005–October 2006).
Results
Frequency of Quality Query reports and breakdown by source
Over the 19-month study period, 397 Quality Query reports were completed against a background of 468,285 requests received by the laboratory, i.e. 0.085% of total requests. The mean number of Quality Query reports completed per month was 20.9, but showed large variability (range 3–43 per month). Three-quarters (75.8%) of all reports were initiated by laboratory staff and the remainder by service users. One hundred and forty-nine (37.1%) of Quality Query reports related to quality failures which were detected within the laboratory (through a combination of existing quality checks and staff vigilance) prior to release of the test result to the requesting clinician.
Breakdown of Quality failures by cause
The great majority (88.9%) of quality failures occurred in the pre-analytical phase (Table 1). Of these, the three most common causes were incorrectly labelled sample/form (23.6% of total quality failures), incomplete/missing requestor ID (22.9%), incorrect entry of patient/test request data onto the laboratory IT system (25.2%). Examples of other pre-analytical phase quality failures included: incorrect sample type, sample spillage, sample did not reach the laboratory. Only 9.6% of Quality Query reports related to the analytical phase and 1.5% to the post-analytical phase.
Breakdown of quality failures by cause
Between-observer consistency of ‘A’ and ‘P’ score allocation
Of 100 quality failure reports reviewed independently by two observers, there was complete concordance in allocation of ‘A’ and ‘P’ scores in 88 cases. The ‘P’ scores allocated differed for 11 reports (by 2 points in 3 cases and by 1 point in 8 cases), while the ‘A’ scores differed for one report [by 1 point]. The kappa statistics for agreement between the two observers were 0.98 (‘A’ scores) and 0.78 (‘P’ scores).
Plots of ‘A’ score against ‘P’ score for the three most common causes of quality failure (incorrectly labelled specimen/request form, incomplete/missing requestor ID information, incorrect entry of patient/test request data) showed different clustering patterns (Figure 1). This reflected the generally lower ‘P’ scores allocated for ‘incomplete/missing requester ID’ and the generally higher ‘A’ scores allocated for ‘incorrectly labelled sample/form’ failures.
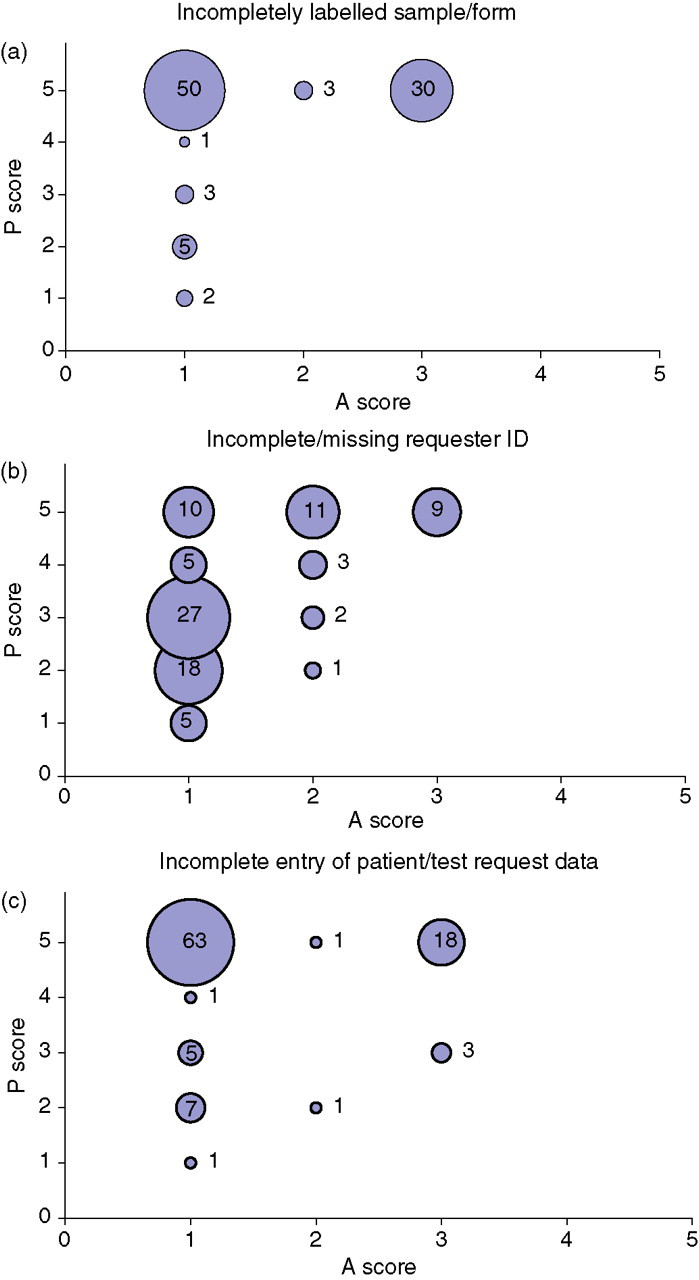
Plots of ‘A’ scores against ‘P’ scores for three common quality failure types.
Breakdown of Quality Query reports by actual or potential severity
The ‘A’ severity scores were strongly skewed in the direction of low scores (Table 2): 72.7% of quality failures were scored as ‘A’ Grade 1 (i.e. the quality failure resulted in no adverse patient outcome and no change in clinical management). The next most common ‘A’ score (20.8% of total) was Grade 3 (a minor adverse patient outcome) and for the most part of these reflected the need for the patient to undergo additional venepuncture. No quality failures had an ‘A’ score greater than 3.
Distribution of quality failure severity grade ‘A’ and ‘P’ scores (% of total quality failures)
The actual [‘A’] score records what the actual adverse outcome was for the patient. The potential [‘P’] score records the ‘worst case’ potential adverse outcome
In contrast, the ‘P’ severity scores were strongly skewed in the direction of high scores: 65.9% of quality failures were scored as ‘P’ Grade 5 (i.e. a potentially significant adverse patient outcome). Only 0.3% of quality failures were graded as ‘P’ Score 1.
Discussion
This paper describes a system that facilitates the identification, reporting, classification and grading of quality failures in the laboratory. A culture of openness with an emphasis on constructive learning rather than apportioning of blame is essential. This approach is reflected in the use of the term ‘quality failure’ in preference to alternatives such as ‘error’, ‘mistake’ or ‘blunder.’ Furthermore, the term ‘quality failure’ as defined has a broad scope and includes failures at any stage in the pathway from test selection to the return of an appropriately interpreted report to the clinician, which might result in suboptimal patient management.
The Quality Query reporting system proved easy to implement and popular in that it gave an opportunity to all staff (regardless of seniority) to report actual or potential quality failures and contribute directly to service improvement. Notwithstanding the ease of implementation however, the monthly frequency of Quality Query reports varied independently of workload. As it is probable that the frequency of quality failures (both identified and unidentified) remains broadly constant, the observed fluctuation may reflect a variability in the rigour of identification and reporting.
The frequency of reported quality failures was 0.085% of all laboratory requests. This is slightly lower but broadly similar to frequencies reported previously of 0.12–0.6% for a variety of laboratory settings. 4–14 In the absence of any definitive methods for the identification of all quality failures and given the observed monthly variability in reporting rates it is probable that there was incomplete identification and/or under-reporting of quality failures. The identification of quality failures depends on two factors. The first of these is the vigilance of laboratory staff and users in spotting anomalies and suboptimal performance. The second factor is the extent to which existing policies and procedures facilitate identification. These would include procedures such as delta checking and other verification steps, which can expose problems that would have occurred at earlier stages of the process. However, it also seems probable that recognizing a quality failure that has occurred does not necessarily result in this being reported to senior staff who have the authority to investigate and implement remedial action. The reasons for this are various and may include: the quality failure was corrected at an early stage and did not result in patient harm; a perception that a given quality failure is too trivial to merit reporting; reluctance to report a quality failure that might be seen to reflect adversely on staff and, finally, apathy.
The identification of quality failures is only of value if it prompts investigation to define the underlying cause and results in corrective action to minimize the possibility of recurrence. A simple system was used for classifying the cause of quality failures. This used the three broad categories of the pre-analytical, analytical or post-analytical phases, each of which was further divided into a series of subcategories. The specific subcategories described inevitably reflected those types of failures occurring over the course of the study. These are likely to vary with time and between laboratories depending on working practices. Previous studies have suggested that the majority of quality failures occur in the pre-analytical (reported range 31.6–75%) and analytical (reported range 13.3–31.6%) phases with a slightly lower proportion in the post-analytical phase (reported range 9–30.8%) in a variety of settings, which included stat, molecular genetics and entire multidiscipline laboratories. 4–14 This study found a much higher proportion of quality failures occurring in the pre-analytical phase (88.9%). The reasons for this are unclear but may reflect a quality failure reporting bias or the fact that previous studies dated from the period 1993–1998, and improvements in laboratory technology since then have reduced the proportion of analytical and post-analytical failures.
To be of maximum value, any classification system should grade quality failures on the basis of severity. The importance of this is obvious in helping to prioritize corrective actions and for monitoring the overall performance of the laboratory. However, many quality failures are detected at an early stage through the systematic checks that form part of standard laboratory practice and through the vigilance of staff. While most laboratories have an array of such systematic checks in place, their sensitivity for the detection of quality failures is unknown. Furthermore, significant quality failures (indicative of flawed processes) may not necessarily result in actual adverse patient outcomes. A ‘near miss’ therefore is just as important in identifying system weaknesses that might in future lead to preventable patient harm. Thus, it is desirable that any system for grading the severity of quality failures measures not only the actual adverse impact on the patient, but also the ‘worst case’ potential adverse impact if the same type of quality failure were to be repeated. Consequently, the severity scoring system developed here therefore included the actual (‘A’) and potential (‘P’) components to reflect this dual requirement.
A simple five-point grading system was used to score the actual and potential adverse effect of the quality failure on patient care. The grading system which focused on patient outcome and inappropriate changes to patient management, ranged from a score of 1 (no adverse outcome for the patient and no change in clinical management) to 5 (serious adverse outcome, e.g. death or significant morbidity). As with any categorical scoring system there is inevitably an element of subjectivity in its application. It often proved difficult and time consuming to establish exactly what effect a quality failure had on patient outcome. This was particularly the case in distinguishing between ‘A’ grade 1 (no management change and no adverse outcome) and ‘A’ grade 2 (minor management change but no adverse outcome). An example of this was where a delay in sample analysis might have been a factor (among others) in delaying discharge by 2 h. For higher grade quality failures, allocation of an ‘A’ score was usually more straightforward. Despite these difficulties, the scoring system worked well and with experience it was generally easy to allocate scores in a consistent manner with a high level of agreement between observers. The different cluster patterns observed with the most common quality failure types (Figure 1) also support broad consistency in ‘A’ and ‘P’ score allocation.
The distribution of ‘A’ and ‘P’ scores differed in that the former was skewed towards lower scores and the latter towards higher scores (Table 2), i.e. it was uncommon for individual quality failures to result in significant adverse patient outcomes, but it was perceived that the potential for this was high. This very different distribution of the ‘A’ and ‘P’ scores reflects both staff vigilance in detecting and rectifying quality failures at an early stage and the fact that the laboratory has a range of systematic procedures (e.g. clinically remarkable, credibility, delta check limits) and other checks in place for maximizing the possibility of early quality failure detection. For the most part, these systems appear to function well and potentially serious quality failures are avoided. However, the preponderance of high ‘P’ scores also suggests that in many cases procedures were not sufficiently robust and that adverse patient outcomes are avoided by good luck. The identification of quality failures with low ‘A’ scores/high ‘P’ scores provides an opportunity critically to review relevant laboratory systems, as well as reinforcing the importance of constant vigilance. 16–18
The ability to summarize quality failures using codes to indicate cause and numerical scores to describe seriousness makes it very easy to monitor laboratory performance, identify recurring problems and plan corrective action. An example of corrective action taken was the introduction of request form scanning technology in response to the large numbers of quality failures arising from incorrect entry of patient/test request data onto the laboratory database through inaccurate transcription from the laboratory request form. As a result, the incidence of this type of quality failure fell by more than 90% in the first three months following the introduction of request form scanning. Other types of corrective action included the development of revised procedures for sample handling in specimen reception and analytical quality control.
The quality query reporting system was additional to the Trust's pre-existing clinical incident reporting system. Over the period of this study, 16 Quality Query reports were also filed as Trust clinical incident reports (4.2% of all Quality Query reports). These generally related to more significant quality failures that had a direct impact on patient care, or where there were implications for the wider Trust outside the laboratory, e.g. sample labelling issues, transport problems. The great majority of Quality Query reports were therefore processed exclusively within the laboratory. It is, perhaps, a strength of the system that it allowed the identification and logging of problems that might not otherwise have been captured by the pre-existing clinical incident reporting system.
In conclusion, a simple and consistent method is described for identification, classification and grading of quality failures that can be easily incorporated into the routine work of the laboratory. The system provides information on the cause of the quality failures and on the actual or potential consequences of the failure on patient care. Such information is easily recorded and provides a useful adjunct to other quality monitoring techniques, such as audit in assessing laboratory performance and in helping prioritize corrective action.