
Abstract
Simultaneous experimental measurements of stress, strain and electrical resistivity were carried out by exposing two carbon black filled cross-linked elastomers and two nanocomposites of thermoplastic polyurethane and multiwalled carbon nanotubes to a series of cyclic strain histories. It was found that the resistivity–strain relationships of the materials exhibited different hysteresis and dependence on prestrain. The resistivity of the nanotube filled elastomers changed dramatically with prestrain, making them suitable for memory sensor applications. During cyclic loading, the carbon black filled elastomers exhibit a lower resistivity during the loading part of the cycles than during the unloading part; the opposite effect was seen in the nanotube filled elastomers. The phenomena can be explained in terms of plastic flow processes in the thermoplastics, and of cohesive forces between carbon black particles in the cross-linked elastomers. Bending and buckling of the nanotubes give rise to a region of strain at constant resistance, making them unsuitable for real time sensing.
Introduction
There are at least two types of engineering applications that demand highly deformable materials able to conduct electricity in various states of deformation. One such class of applications is that of gaskets and shields for EMI shielding. 1 Here the demand on the material is for adequate conductivity under a generally static deformation. Another class of applications with more demanding material properties is that of flexible strain sensors. 2 What is required here is a piezoresistive effect, where the electrical resistance of the material changes with stress or deformation in a controlled and predictable manner, and typically by a factor greater than that resulting from the geometric change alone. Different types of flexible strain sensors are being developed for robotic applications, 3 embedded in textiles for kinaesthetic systems,4, 5 and for medical devices for surgery, 6 injury rehabilitation 7 and health monitoring.8–10
Although some metals are employed in shielding applications, elastomeric polymers have generally dominated both gasket and strain sensor applications because of their ability to deform elastically to large strains while still providing some degree of electrical conductivity. The majority of polymers are electrical insulators, and although electrically conductive polymers with special chemistry exist (aromatic cyclic groups or double bonds along the main chain), they are challenging to process and generally not in the elastomeric state at room temperature. 11 Electrical conductivity in elastomers is more commonly achieved by the addition of conductive particles to ordinarily insulating matrixes. The process by which conduction is achieved depends somewhat on the size of fillers. In systems with relatively large fillers, such as carbon black or metallic particles, conduction takes place through the existence of electrical pathways arising from a percolating network of conductive particles. In nanocomposite systems, a percolating network can be supplemented by tunnelling effects if sufficiently good dispersion of the nanoparticles can be achieved. Filler particles are generally stiffer than the elastomeric matrix, and therefore they are subjected to spatial rearrangements and rotations, and possibly also to damage when an elastomer is macroscopically deformed. Irrespective of the size and shape of conductive filler particles, the electrical conductivity of filled elastomers is affected by macroscopic deformation because of changes in interparticle distances.
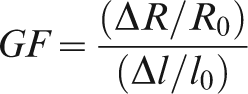
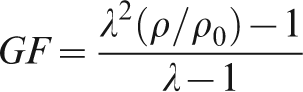
One of the most important requirements for a good strain sensing material is that, in order for the signal to be easily measurable, the change in electrical resistance ΔR relative to the resistance R0 at zero strain with respect to the change in length Δl relative to the original length l0 (equal to the applied strain ϵ) should be as large as possible. This is commonly expressed in terms of the gauge factor GF when referring to strain gauges
A second, equally important class of requirements for strain sensing materials is for the electrical response to be repeatable and monotonic with strain, or failing that, sufficiently well understood to allow computation of strain based on a measurement of resistance. There are several ways in which the response has been observed to deviate from this. The effect of prestrain is known to alter the electrical response, in a similar manner to the way in which the Mullins effect alters the mechanical response. Hysteresis, or dependence of either the electrical response itself, or of the mechanical response on the loading path, has also been observed. Depending on the magnitude of the effect, it can severely limit the applicability of these materials as sensors, either intrinsically or indirectly as a result of the temperature change arising from energy dissipation. Time dependent response is also not uncommon, particularly at higher filler load fractions. 19 Although signal processing has been successfully employed to account for time dependence, the complexity renders real time measurements challenging. 5 Last, there may be additional considerations for particular sensor applications that affect repeatability of measurement, such as the roles of temperature, 20 pressure, humidity, fatigue and susceptibility to damage on the electrical response.
The aim of this paper is to study two relatively unexplored aspects of the electrical response on two classes of conductive elastomers by performing a series of simultaneous measurements of electrical resistivity, stress and strain during cyclic saw tooth deformations. The aspects that will be considered are the role of prestrain and the effect of hysteresis.
Experimental method
Materials
The materials studied in this work consist of two permanently cross-linked elastomers and two thermoplastic elastomers. The thermosetting elastomers were an accelerated sulphur cross-linked carbon black filled (50 phr) oil extended ethylenepropylenediene (EPDM) rubber, and a commercial conductive grade of Wacker Chemie Elastosil LR 3162 silicone rubber, also filled with carbon black. The thermoplastic elastomers were Noveon Inc. Estane 58311 ether based polyurethane elastomers, melt compounded with 4 and 5 wt-% Nanocyl NC7000 multiwalled carbon nanotubes (MWCNTs) using a twin screw extruder. 21
Sheets of EPDM rubber approximately 0·5 mm in thickness were compression moulded using a picture frame mould in a heated press for 13 minutes at 160°C. The two part Elastosil silicone elastomer was mixed, cast into rectangular moulds, and cured at room temperature overnight following the manufacturer's instructions, producing sheets approximately 0·5 mm in thickness. The precompounded extruded Estane CNT granules were dried and compression moulded using a picture frame mould for 10 min at 170°C, followed by cooling to room temperature at a rate of ∼10–15°C min−1, producing sheets 0·5 mm in thickness. Rectangular test specimens approximately 100 mm in length and 10 mm in width were carefully cut from all the elastomeric sheets using a template and a sharp bladed cutter.
Piezoresistive experimental set-up
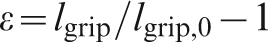
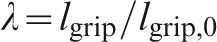
Uniaxial tensile testing was performed using an Instron 5569 testing machine at room temperature, at constant crosshead displacement rate corresponding to a nominal strain rate of 0·03 s−1. The reported strain ϵ was calculated from the grip separation distance lgrip as
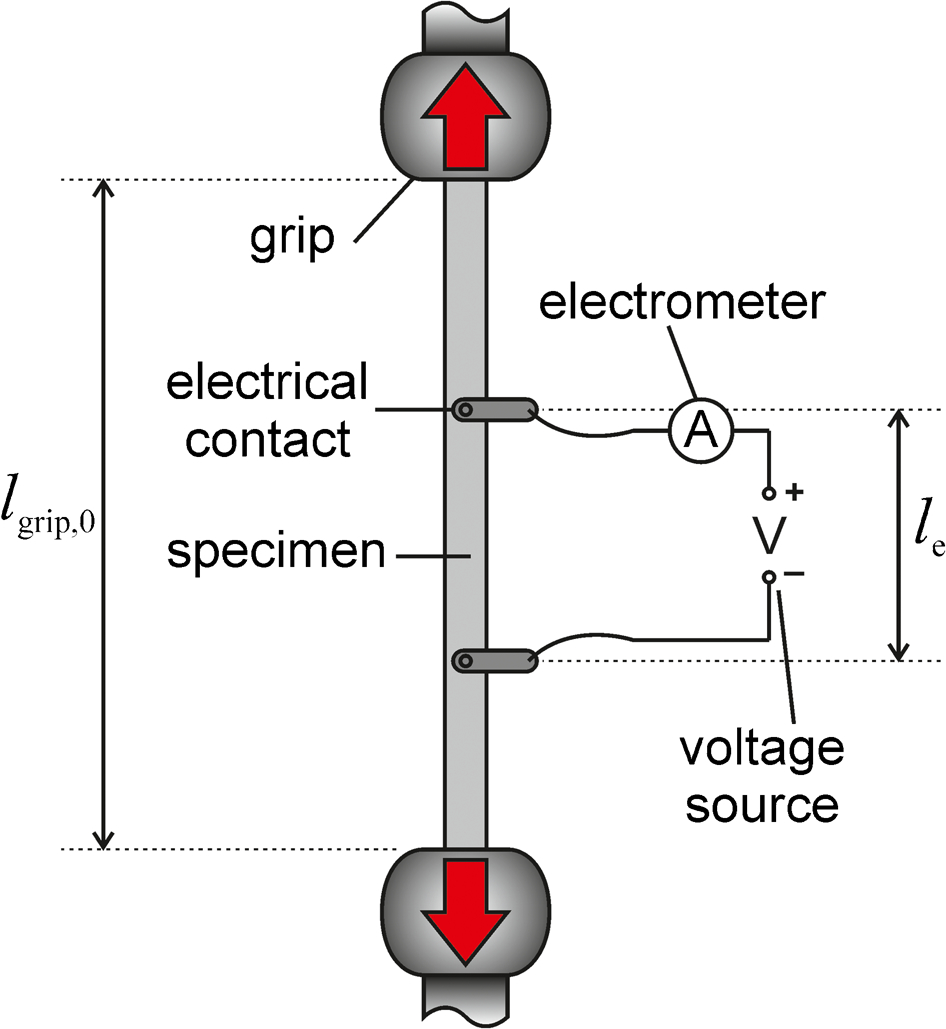
Schematic representation of electrical and mechanical equipment used in simultaneous measurement of electrical and mechanical properties
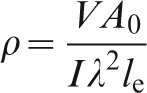
The current I through the circuit was measured using the very sensitive electrometer. The instantaneous resistivity ρ was computed from the measured resistance and the sample dimensions and stretch ratio, assuming isochoric deformation, as
The experimental programme was divided into three phases, following three experimental protocols. The first phase recorded the response to continuous deformation at constant nominal strain rate through to failure. The second phase consisted of pseudocyclic load–unload deformations at constant nominal strain rate, loading to successively larger strains in each cycle. The third phase consisted of the application of four load–unload cycles of deformation to a fixed strain level (typically 100% strain), followed by further load–unload cycles between different strain levels within this envelope, all at constant nominal strain rate, referred to as cyclic tests. Typical imposed strains during the three phases are illustrated in Fig. 2 as a function of time.
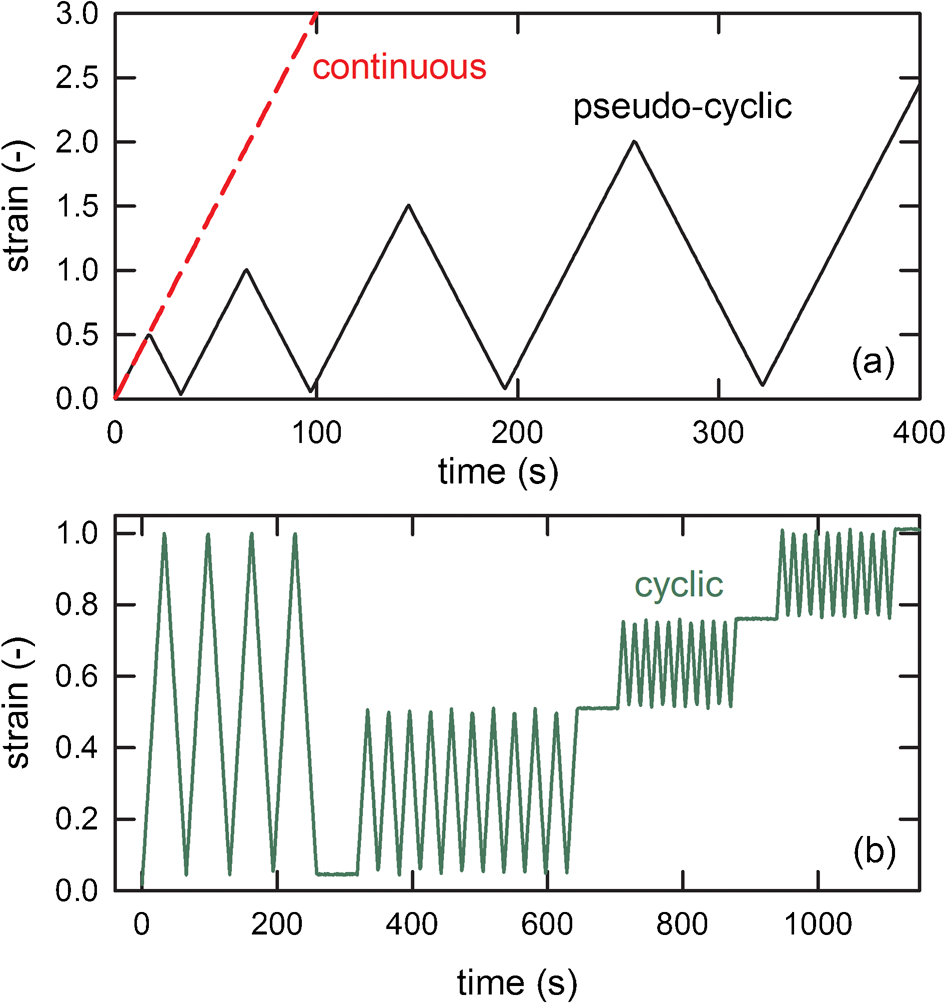
a continuous and pseudocyclic strain as function of time; b cyclic strain as function of time
Results
Continuous and pseudocyclic experiments
Figure 3 illustrates the continuous and pseudocyclic stress–strain responses of the four materials. All the materials studied exhibited the Mullins stress softening effect, and the pseudocyclic curves approximately rejoined the continuous loading curves when the applied strain exceeds the previously reached maximum strain. An observable difference between the carbon black filled cross-linked elastomers EPDM and Elastosil, and the Estane CNT filled elastomers is the degree of permanent deformation-whereas the permanently cross-linked thermosetting elastomers exhibited almost complete recovery upon unloading, there was as much as 150% permanent strain after unloading the thermoplastics.
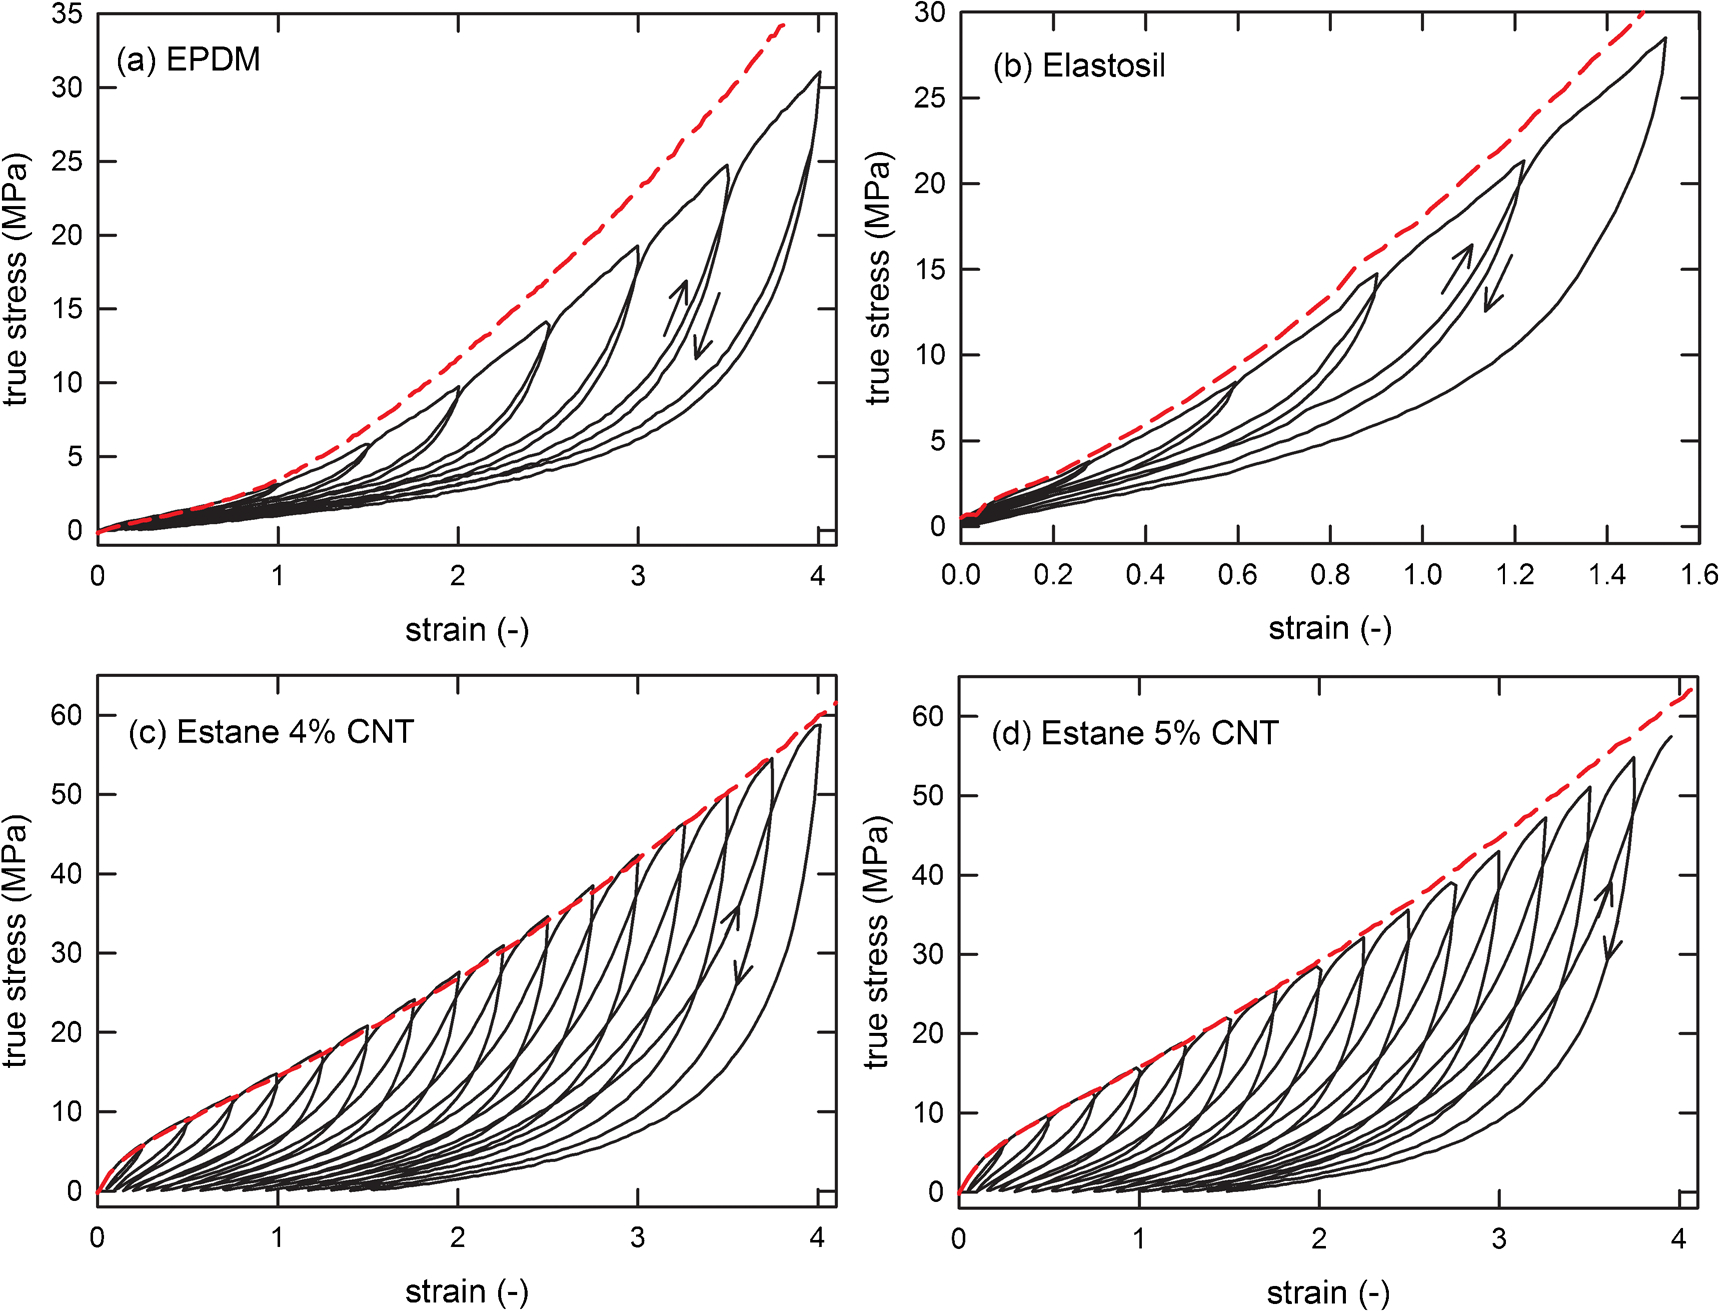
Continuous (dashed lines) and pseudocyclic (solid lines) stress–strain responses of a EPDM rubber filled with carbon black, b Elastosil filled with carbon black, c Estane with 4% CNTs, and d Estane with 5% CNTs, all deformed at strain rate of 0·03 s−1
Figure 4 illustrates the continuous and pseudocyclic resistivity–strain response of the same materials. EPDM was exposed to 30 V, while Elastosil and Estane CNT nanocomposites were exposed to 100 V. The electromechanical response of the EPDM rubber was hysteretic in that all of the unloading segments exhibited a larger resistivity than both the first loading and the subsequent segments. The precise values depended on the maximum strain the material has previously been exposed to. Differently to the stress–strain response, the reloading segments were relatively unaffected by the previously reached maximum strain, i.e. the resistivity was almost the same as that in the continuous loading curve apart from an initial approach towards it. Very similar behaviour was found with the Elastosil silicone elastomer. Here the subsequent reloading segments rejoined the continuous loading curve very quickly, at ∼20% strain for all cycles. Both of these elastomers were filled with particulate carbon black.
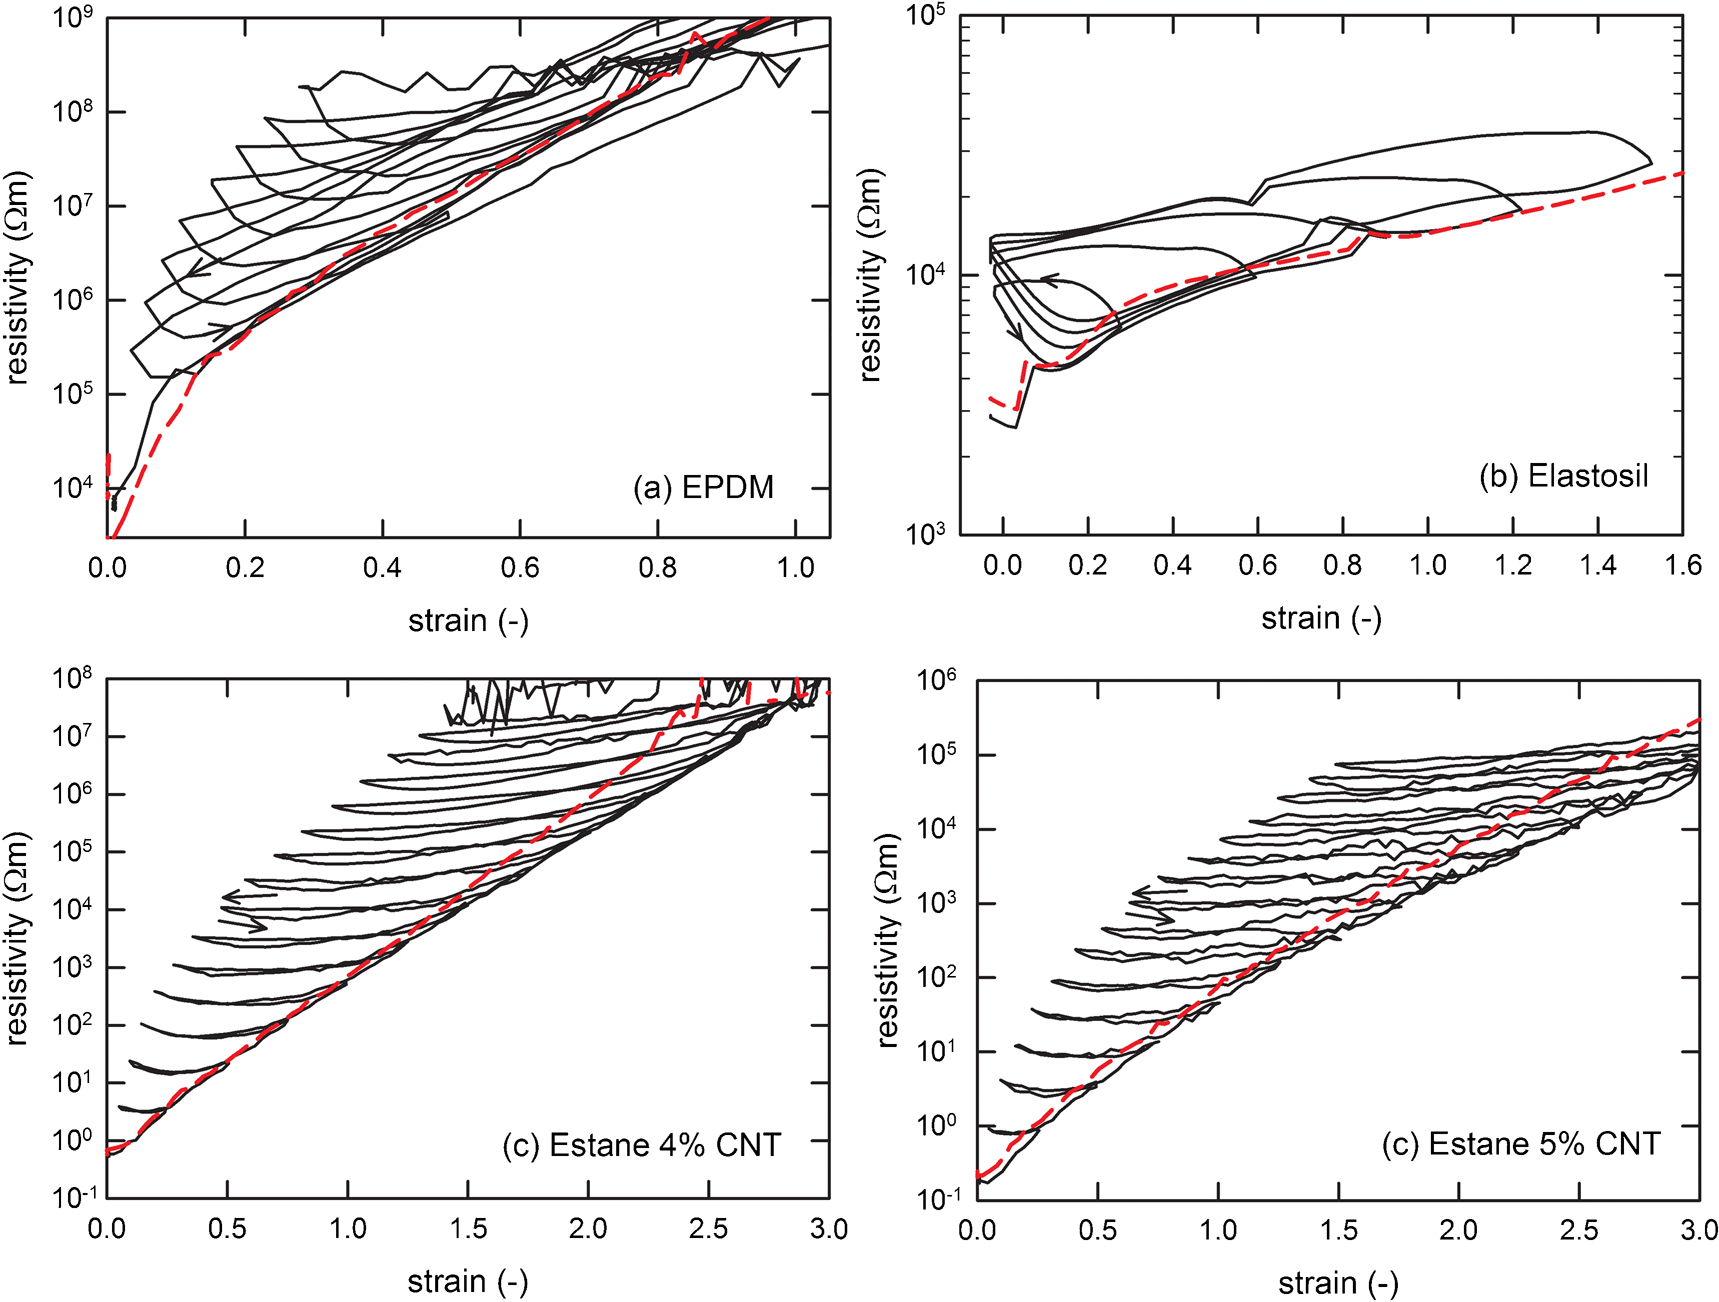
Continuous (dashed lines) and pseudocyclic (solid lines) resistivity–strain responses of a EPDM rubber filled with carbon black (100 V), b Elastosil filled with carbon black (30 V), c Estane with 4% CNTs (30 V) and d Estane with 5% CNTs (30 V), all deformed at strain rate of 0·03 s−1
The electromechanical response of the CNT filled Estane thermoplastic elastomers was visibly different. The resistivity during the unloading and reloading segments depended almost exclusively on the maximum strain the material had previously been exposed to, and they exhibited little hysteresis compared with the carbon black filled materials. When the strain exceeded the previously reached maximum, the resistivity followed the continuous loading curve, through to large strains. The increased filler content of the 5% CNT grade resulted in a reduction of resistivity across all strain levels, and the reduction was greatest at the largest strains.
Cyclic deformation
By performing a range of cyclic experiments, the electromechanical response during repeated loading was explored in greater detail. Materials were first exposed to preconditioning consisting of four cycles of loading and unloading to ϵmax = 1 (except Elastosil, to ϵmax = 1·5). Subsequently, they were exposed to several strain cycles, all within this envelope of maximum strain, as shown in Fig. 2b. Figure 5a illustrates the strain history and resistivity (measured at 100 V) as a function of time during cyclic loading between strains of 0·5–0·75 on EPDM rubber. The resistivity was considerably time dependent, taking several cycles before settling to a repeatable loop, as can be seen in Fig. 5b. Once settled, the resistivity was lower in the loading part of the cycle than in the unloading part.
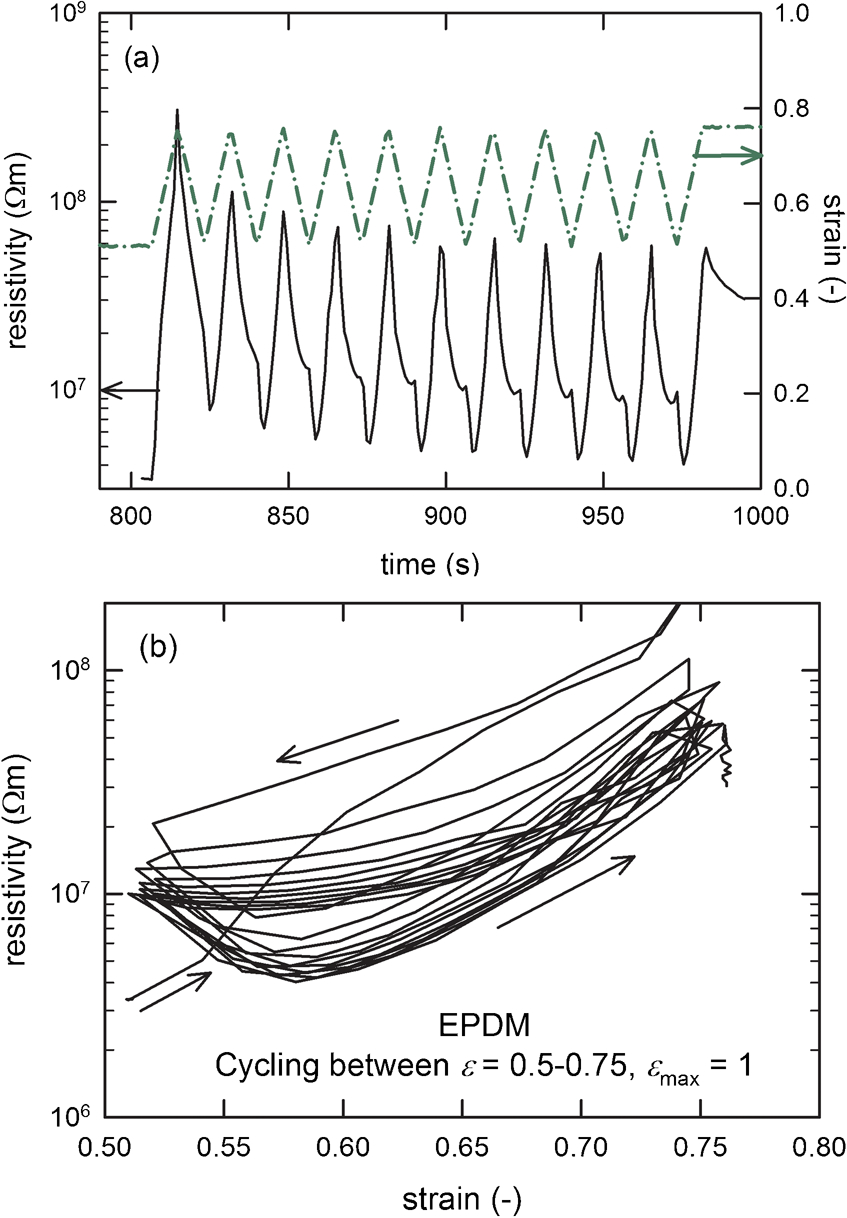
a resistivity measured during cyclic loading between strains of 0·5–0·75 on EPDM rubber at 100 V, after initial maximum strain of 1 (solid line); strain history (dot–dash line); b resistivity as function of strain for same data
Figure 6a illustrates the same strain and resistivity history, and Figure 6b shows resistivity–strain relationship during cyclic loading (measured at 100 V), now between no load and a strain of 1, again following four cycles to a prestrain of 1. Here the evolution of the electrical response with increasing number of cycles was much smaller (in relative terms), and the loops were more repeatable. The resistivity was again lower on the loading part of the cycle, dipping just after the resumption of loading. A variety of different strain ranges, all within the preconditioning strain envelope, were explored experimentally. Provided that a sufficiently large strain amplitude was applied, a hysteretic behaviour could be observed throughout the experiments, whereby the resistivity on loading was lower than that on unloading, near the minimum of the cycle (irrespective of whether this was at no load or at a finite strain value). The response appeared instead virtually monotonic near the maximum strain of the cycle.
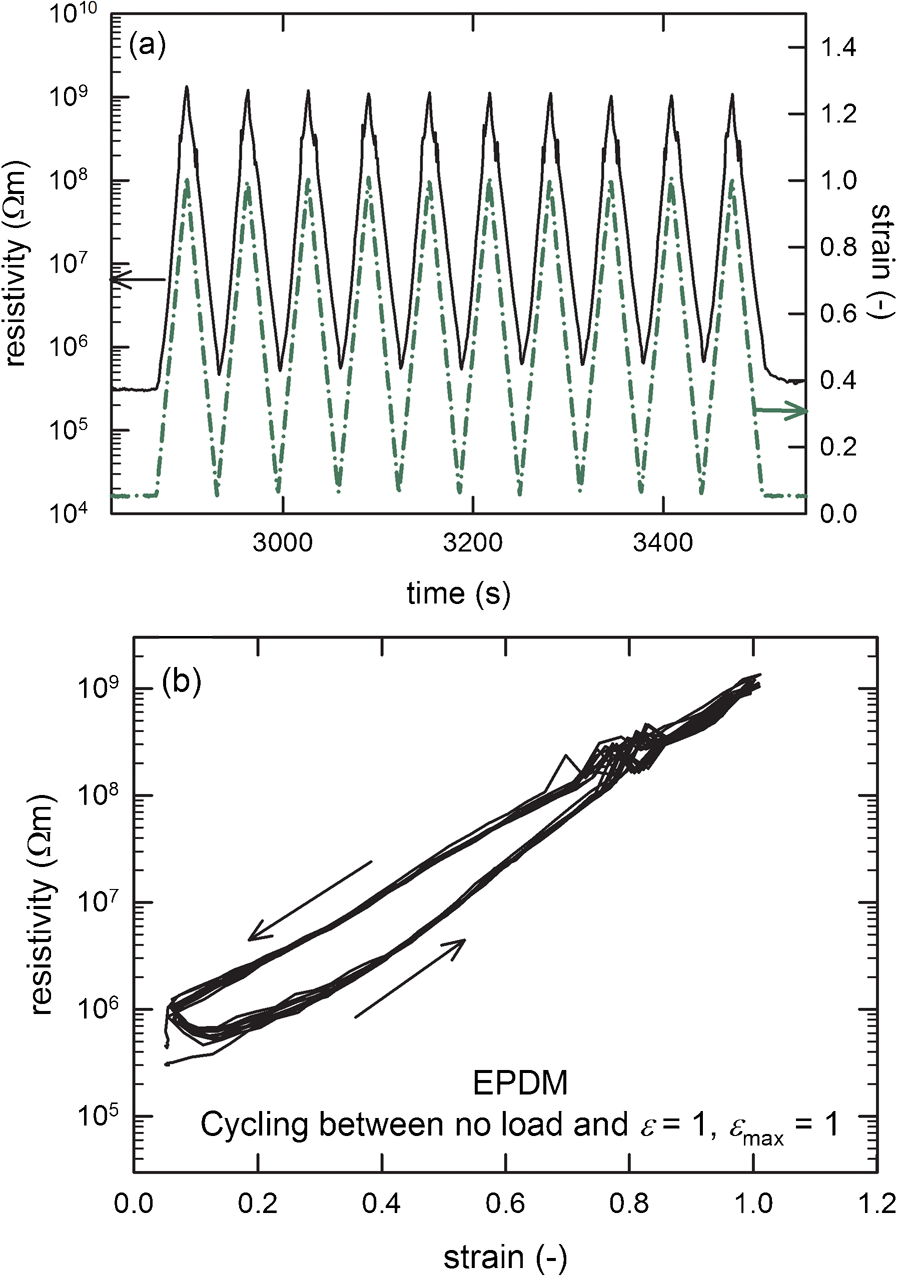
a resistivity measured during cyclic loading between no load and strain of 1 on EPDM rubber at 100 V, after initial preconditioning (four cycles) to maximum strain of 1 (solid line); strain history (dot–dash line); b resistivity as function of strain for same data
One example of a cyclic resistivity–strain relationship (measured at 10 V) for deformations between no load and a strain of 0·6 for Elastosil material previously subjected to four cycles of preconditioning to a strain of 1·5 is shown in Fig. 7. Similarly to the EPDM, resistivity on loading was lower than on unloading. Although the response was highly repeatable after the first cycle, there was noticeable hysteresis throughout the cycle, and the response was not monotonic anywhere in the cycle.
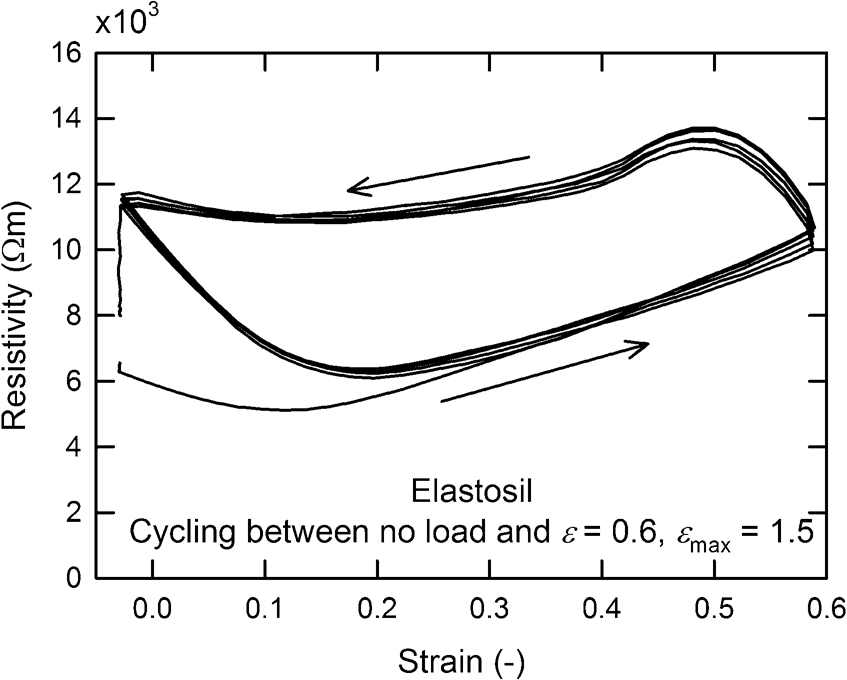
Resistivity as function of strain measured during cyclic loading between no load and strain of 0·6 on Elastosil at 10 V, after initial maximum strain of 1·5
Figure 8a illustrates the strain and resistivity (measured at 100 V) as a function of time, and Fig. 8b shows the resistivity–strain relationship during cyclic loading between strains of 0·5–0·75 on Estane filled with 5% CNTs previously strained to 1, following the same strain history as in Fig. 5. Here the time dependence of the response was again substantial, but once the response settled (after a few cycles), the loading and unloading parts of the response were hard to distinguish. A virtually identical response was observed in the Estane filled with 4% MWCNTs (not shown), only at a marginally higher resistivity.
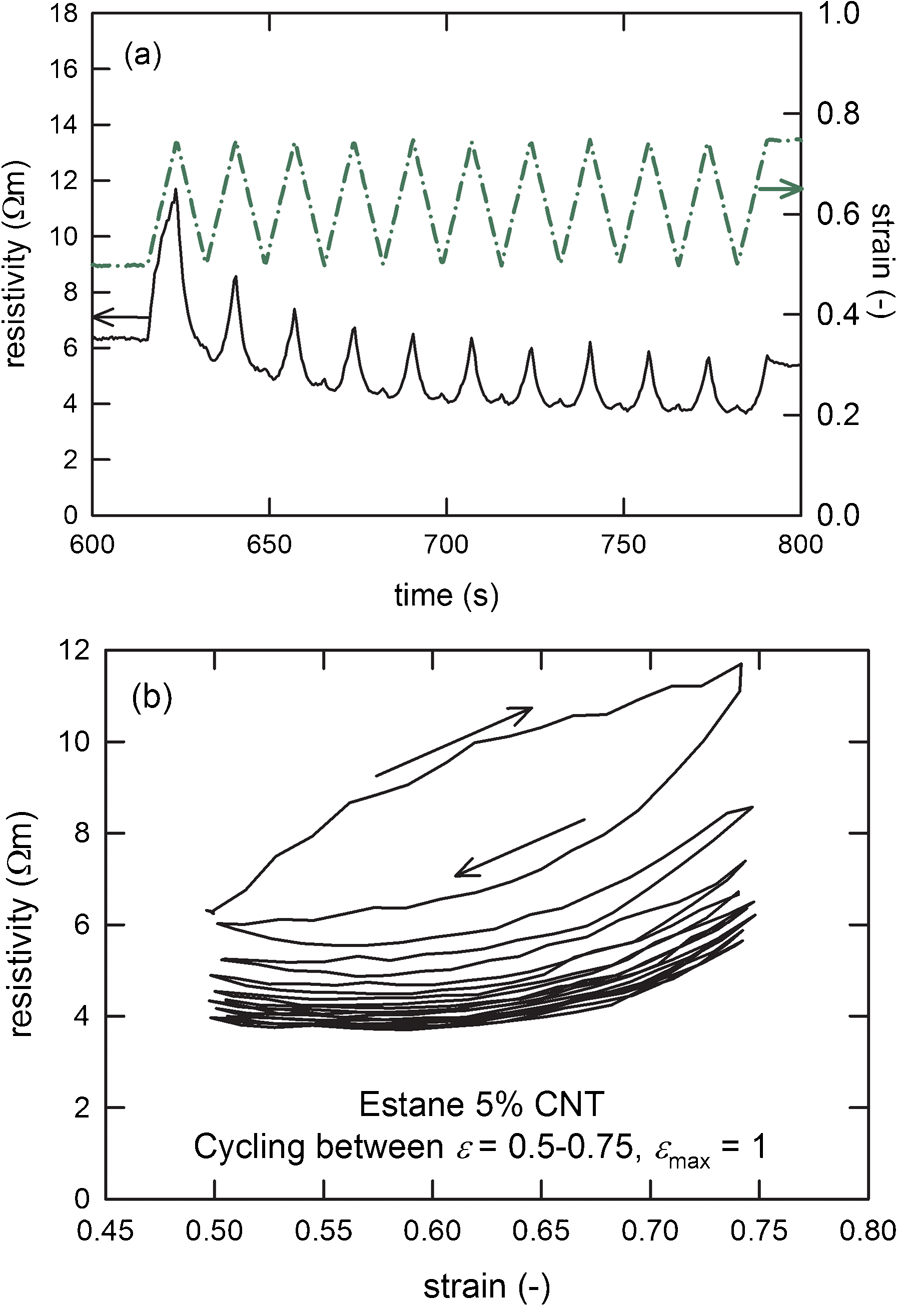
a resistivity measured during cyclic loading between strains of 0·5–0·75 on Estane filled with 5% CNTs at 100 V, after initial maximum strain of 1 (solid line); strain history (dot–dash line); b resistivity as function of strain for same data
Figure 9 illustrates the strain and resistivity as a function of time, and resistivity–strain relationship of Estane filled with 5% MWCNTs subjected to the same larger strain amplitude history as in Fig. 6. Here again the time dependence of the electrical response was much smaller, and the loops were highly repeatable after the first loading. However, the resistivity was higher during the loading part of the cycle than during the unloading part. Both parts of the cycle exhibited a minimum in resistivity at an intermediate strain level within the cycle. Again, a virtually identical response was observed in the Estane filled with 4% CNTs (not shown), only at a marginally higher resistivity. A wider set of experiments were carried out to explore the response to cyclic loading across a broader range of strain amplitudes within the preconditioning strain envelope. Similarly to the EPDM, when the strain amplitude was kept to within 0·25, the material did not exhibit measurable hysteresis, but for all strain amplitudes greater than or equal to 0·5, the hysteresis was clearly defined. In all cases where hysteresis was present, resistivity was observed to be higher during the loading path than during the unloading path.
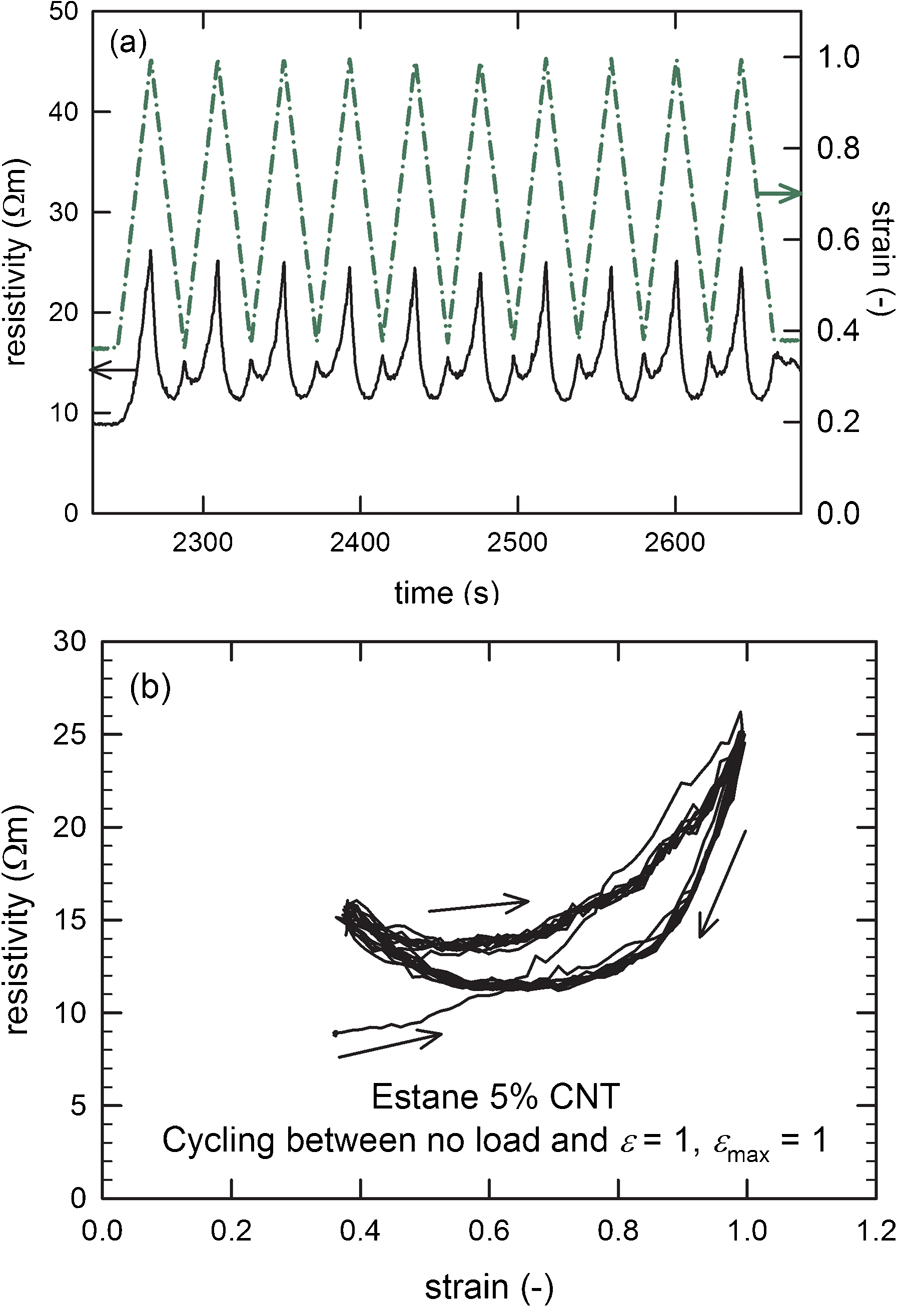
a resistivity measured during cyclic loading between no load and strain of 1 on Estane filled with 5% CNTs at 100 V, after initial maximum strain of 1 (solid line); strain history (dot–dash line); b resistivity as function of strain for same data
Discussion
Figure 3 has shown that all four materials exhibited clear evidence of the Mullins effect, suggesting that their microstructure was being affected by the degree of prestraining. As could be expected, the cross-linked elastomers were able to recover almost completely after straining, whereas the thermoplastic elastomers exhibited a noticeable degree of permanent deformation.
The pseudocyclic experiments shown in Fig. 4 provided a fingerprint of the electrical response of the materials when subjected to different prestraining regimes. There were several differences in the precise shape of these responses, probably related to a range of microstructural features. The most striking difference was in the path taken by the resistivity in the reloading part of the pseudocyclic loading. In both the EPDM and the Elastosil, this path approximately followed the original continuous loading curve; in the CNT filled Estanes, it closely followed the previous unloading curve, and only rejoined the continuous loading curve when the strain exceeded the previously reached maximum. Therefore, it is possible to think of the CNT filled Estanes as one shot, or memory sensors, which are able to remember the maximum deformation they have been exposed to via a permanent change in their electrical properties. Although there are indications that a fraction of this effect may recover over time (similarly to recovery of the Mullins effect 22 ), the greater part of the change in resistivity with prestrain appears to be permanent. More experiments are needed to quantify and confirm this.
The cyclic experiments reported in Figs. 6–9 were intended to explore the applicability of these materials as strain sensors, by observing if there existed ranges of deformation in which the electrical response to an applied strain was repeatable (i.e. not dependent on the number of cycles), and non-hysteretic, or path independent.
The electrical response typically became repeatable after a few cycles, in a manner similar to the mechanical response. Experiments performed on EPDM and on Estane CNT elastomers suggested that the response to a smaller strain amplitude requires a greater number of cycles to settle than that to a larger strain amplitude. There is insufficient experimental evidence to state conclusively if this also applies to Elastosil, since in this material the response settled very quickly for all probed strain amplitudes.
Hysteresis in the electrical response is generally present in strain amplitudes greater than or equal to 0·5, but not in strain amplitudes of 0·25. However, a striking difference between the materials is clearly present in the large amplitude cycles (Figs. 6, 7 and 9). In the EPDM and Elastosil, the resistivity is lower during the loading part of the cycle than during the unloading part. This can be seen also in the pseudocyclic experiments. However, the reverse is true in both the 4 and 5% CNT filled Estane. Here the resistivity is higher during the loading part of the cycle than during the unloading part. This same behaviour was also observed in both materials in strain cycles between strains of 0·5 and 1, and between no load and 0·75 (not shown).
One possible explanation for the unexpected difference in the nature of the piezoresistive hysteresis of the materials lies in the geometry of the filler particles. The carbon black fillers are generally globular, whereas the CNTs have aspect ratios of ∼150. Whereas the nanotubes will behave as rigid rods when subjected to tension, they are prone to bending and buckling when compressed. Although the macroscopic strains explored in this study are not compressive, it is possible that, locally, some areas of the nanocomposites experience small degrees of compressive stress, especially if some plastic flow has taken place near the fillers. These bent, or buckled nanotubes may be constrained by the presence of other nanotubes, and hence more encouraged to form a conductive network during the unloading part of the cycle than during the loading part. During the loading part of the cycle they straighten again due to the tensile stresses imposed by the surrounding elastomer, and are pulled away from one another. This picture could account for three observations. The first observation is that when smaller strain amplitudes are probed, the effect does not manifest itself. It is likely that small strain amplitudes do not give rise to sufficient plastic flow, and hence to deformation that requires the nanotubes to bend or buckle. This is supported by mechanical experiments showing that the mechanical hysteresis is smallest at the smaller strain amplitudes, and hence that the plastic flow is smallest. The second observation is that near the end of an unloading cycle, the resistivity is rising with decreasing strain, and near the beginning of a reloading cycle it is falling with increasing strain. In fact, upon closer inspection, the values of resistivity are relatively path independent in this region. This effect could arise if sufficient nanotubes come into contact upon unloading when a sufficiently small strain is reached, and proceed to bend with decreasing strain. Upon loading, they first restraighten before being separated. It is straightforward to test this assumption. If there is no change in nanotube separation and network topology, but only a bending and rotation of electrically conductive particles, we expect the system to maintain a constant resistance when deformed in this region. Therefore, a plot of resistance normalised by the value measured at the lower inversion point of the cycle, R/R′, should be equal to unity in the minimum strain region of the cycle. This is shown in Fig. 10 for three strain amplitudes for Estane 5% CNT. In the largest strain amplitude, no load to ϵ = 1, R/R′ is equal to unity for ∼0·1 strain on unloading, and as much as 0·2 strain on loading; in the second largest strain amplitude, ϵ = 0·5−1, a similar effect can be seen; in the smallest strain amplitude, no load to ϵ = 0·75, the ratio starts to deviate from 1, suggesting that the mechanism may not be fully applicable for smaller strain ranges. This same effect was seen in Estane 4% CNT, but interestingly not in EPDM or Elastosil, suggesting that it is an effect limited to high aspect ratio fillers. The reduction in resistivity observed in the same data plotted in Fig. 9 is purely a geometric effect arising from the changes in length and cross-section, giving rise to ρ∝λ−2. This is, of course, not a desirable consequence for application of these materials as strain sensors, as such a region of constant resistance renders determination of strain by measurement of resistance impossible in this region.
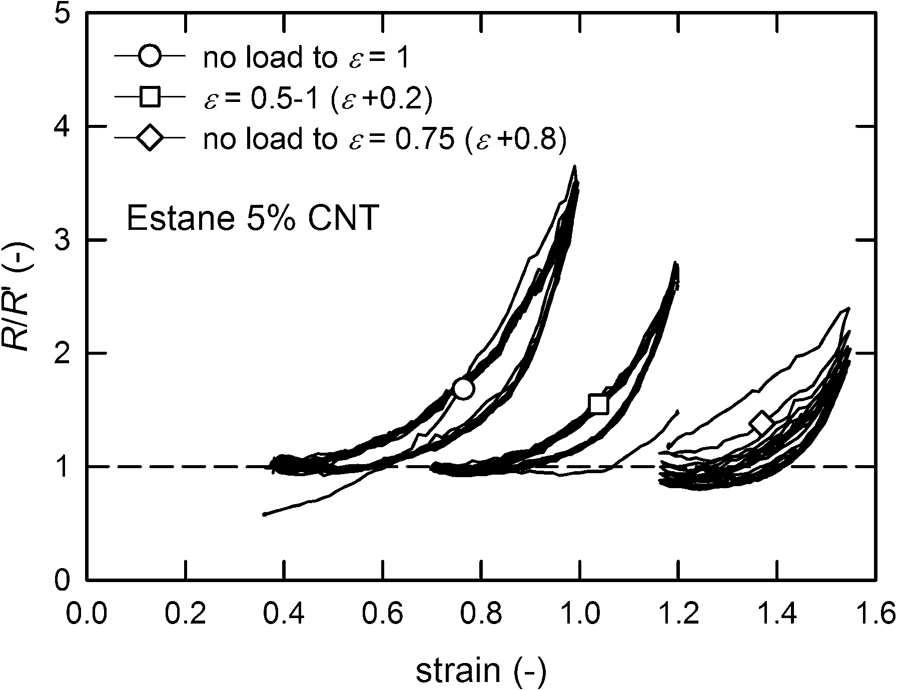
Normalised resistance during cyclic strain amplitude loops as function of strain in Estane 5% CNT, showing that resistance remains approximately constant in leftmost region of loop: two curves are offset in strain for clarity as marked
Careful observation of Figs. 8 and 9 reveals that the resistivity–strain curves of Estane 5% CNT exhibit a local minimum. Several other strain ranges were explored: from no load to 0·5 strain, no load to 0·75 strain, 0·5 strain to 1 strain, and 0·75 strain to 1 strain: all of these also exhibit a minimum, sometimes after a small number of cycles, sometimes immediately. The same observations were made on the Estane 4% CNT material on the same set of strain ranges: in all of these cycles, the resistivity–strain curve exhibits a minimum somewhere within the cycle, irrespective of straining direction. This is unexpected, and suggests that the configuration of the nanotube network may be adapting, or evolving with deformation, to best conform to the strain range that is imposed upon the material. It is possible that this is a consequence of the high longitudinal stiffness of the fillers in tension, but low apparent stiffness in compression (because of bending and buckling). Therefore, the adaptation may be a manifestation of a degree of plastic flow in the vicinity of the nanotubes. The minimum in resistivity could arise because of two competing effects: in the region of smallest strain resistivity falls with increasing strain and ρ∝λ−2 because of nanotube contact and bending of nanotubes. However, as nanotubes straighten with increasing strain, the interparticle distance begins to increase, and hence resistivity rises with strain in the region of higher strain, giving rise to a minimum within the cycle.
This minimum in resistivity within a cycle only appears in the loading loops in EPDM and Elastosil, but not in the unloading loop. It is possible to speculate that the reason for this hysteresis in the carbon black filled materials may be connected with cohesive forces maintaining partial contact between filler particle fragments upon loading at the smaller strains within a cycle, but not being present during the unloading cycle. Therefore, the contact only arises again when particles are brought sufficiently close together during unloading.
Conclusions
This study has presented simultaneous experimental measurements of stress, strain and electrical resistivity during continuous, pseudocyclic, and cyclic loading on four elastomers: a carbon black filled EPDM rubber, a carbon black filled Elastosil silicone elastomer, and two grades of Estane thermoplastic polyurethane elastomer, melt compounded with 4 and 5% MWCNTs.
In all materials studied, the resistivity–strain relationship exhibits history dependence in the form of the maximum strain previously reached, in a manner similar to the way in which the Mullins effect influences the stress–strain relationship. There is a substantial difference between materials with different filler types. In the carbon black filled elastomers, the piezoresistive loading path was relatively independent of prestrain, whereas the unloading path depended strongly on prestrain. In the CNT filled elastomers, the piezoresistive loading path and the unloading path were relatively close to each other, but were a strong function of prestrain, changing by several orders of magnitude across prestrains from 0 to 2·5. This is believed to be associated with different forms of damage occurring on the fillers, and suggests that the nanotube filled elastomers may be effective one shot, or memory strain sensors, remembering the maximum strain they have been exposed to via a dramatic, possibly permanent change to their electrical response.
When the materials were cycled repeatedly between no load and a strain of 1, the response of all materials settled quickly with time, and was hysteretic but repeatable. When materials were cycled between smaller strain amplitudes (smaller than the prestrain), the response was more time dependent and took several cycles to settle. However, the most striking difference between the materials was that whereas in the carbon black filled materials the resistivity was lower during loading than during unloading, the reverse was true for the nanotube filled elastomers. A possible explanation for this unusual behaviour is believed to be related to effects arising from the very different aspect ratio of the filler particles. Bending and buckling of nanotubes dominates the response during the low strain portion of a given strain amplitude, giving rise to a constant resistance–strain region. A resistivity inversely proportional to the square of stretch ratio arises from a geometric effect. The consequence of this is that sensors made from such materials would be incapable of reporting deformation within this region. Within any strain sequence of sufficient strain, elastic deformation takes place before flow processes eventually occur in the vicinity of nanotubes, giving rise to greater interparticle separation, and hence resistivity, on loading than on unloading. Cohesive forces acting between carbon black particles could be responsible for the reverse effect observed in the carbon black filled elastomers. When particles come into contact, cohesion delays their separation upon reloading, giving rise to a decrease in resistivity relative to the unloading path at the same strain.
Finally, in the CNT filled materials, the resistivity was observed to reach a minimum within the cycle, for a wide variety of strain ranges. This effect can be explained by considering that resistivity is first inversely proportional to the square of the stretch ratio, and hence decreasing with strain, as a result of bending and rotation of nanotubes, and later increasing with strain as a result of greater interparticle separation.
Footnotes
Acknowledgements
The authors wish to acknowledge the contributions of Dr T. Alshuth of the German Institute of Rubber Technology (DIK) in supplying the EPDM rubber material; of Dr C. Y. Lew of Nanocyl in supplying and compounding the Estane and nanotube materials; of Dr A. Tognetti of the University of Pisa in supplying and moulding the Elastosil material; and of Professor D. De Rossi of the University of Pisa for inspiring some of this work following a visit to Nottingham in 2009. This work was originally presented in: S. Jerrams & N. Murphy (eds), Constitutive Models for Rubber VII. 2012 Taylor & Francis Group, London, UK and subsequently peer-revised and extensively revised for publication in Plastics, Rubber and Composites: Macromolecular Engineering.