
Abstract
A new multistage stochastic mine production scheduling approach is developed and tested in a large operating gold mine. The approach takes short scale orebody information in the form of grade control data into account. As simulated orebodies used in stochastic long term mine planning are based on sparse exploration data while grade control data are unavailable at the time of production scheduling, the short scale information is simulated stochastically. Stage 1 of the approach simulates high density future grade control data based on exploration data and grade control in previously mined out parts of a deposit. In stage 2, the technique of conditional simulation by successive residuals enables preexisting simulated orebody models to be updated using the simulated future grade control information. Stage 3 is based on a stochastic programming mine scheduling formulation that handles jointly multiple simulated orebody models from stage 2, and accommodates both maximising net present value (NPV) and minimising deviations from expected production targets. Stage 4 includes quantification of risk in the production schedules generated, comparisons and reporting. The application at a large operating gold mine demonstrates that the proposed approach is practical, and adds value to the operation. The approach is shown to deliver additional ore (3·6 Mt more) and metal (2·6 Mg more) which matches the mines reconciliations, unlike the conventional schedule, and results in a cumulative NPV which is on average 7·7 million AUD higher than that of a stochastic schedule without the simulated grade control data. The NPV is 230 million AUD higher compared to the NPV from the actual schedule of the mine. An additional key contribution of the proposed approach is the compliance of short- to long term production schedules and performance, leading to higher probability of meeting production targets and increased productivity. Given the capital intensity of mining projects, this contribution can be critically important to mining operations.
Introduction
Stochastic mine planning is a relatively recent development aimed at addressing uncertainty in ore supply from an orebody, commodity prices and metal demand, and also extends to other issues of uncertainty in mine planning. The existing work focuses largely on open pit mine design and production scheduling with uncertain grades/metal content and geological conditions, and is based on initial work and technical issues raised first in the 1970s (David et al., 1974) and again in the 1990s (Ravenscroft, 1992; Dowd, 1994, 1997). It includes life of mine (LOM) production scheduling based on optimal mining rates and simulated annealing (Godoy and Dimitrakopoulos, 2004), simulated annealing with constant mining rates and assessment of various inputs (Leite and Dimitrakopoulos, 2007; Albor and Dimitrakopoulos, 2009), stochastic integer programming (SIP) formulations including a stochastic stock pile (Menabde et al., 2007; Ramazan and Dimitrakopoulos, 2012), further tests of this last approach (Leite and Dimitrakopoulos, 2013) and expansion for multiple elements (Benndorf and Dimitrakopoulos, 2013), pushback design (Albor and Dimitrakopoulos, 2010), efficient SIP solutions based on metaheuristics (Lamghari and Dimitrakopoulos, 2012), and more. The two key aspects of all these approaches and example case studies are that the derived long term production schedules have substantially higher present value than the traditionally used approaches, with differences between 20 and 30%; and minimise the potential deviations from production targets set given the available drilling and orebody models. Recent work further considers integrating market uncertainty in choosing from different mine designs which also consider geological uncertainty (Abdel Sabour et al., 2008). The effects of optimising pits in a new approach that assesses the combined effect of metal and price uncertainties using a stochastic network flow approach (Meagher et al., 2009; Asad and Dimitrakopoulos, 2013) show once again the value of stochastic approaches and the integration of key uncertainties in mine planning. Notable also is the effort to integrate uncertainty in mining and processing costs (Richmond, 2011).
The work above is all based on two elements, in addition to new stochastic mine design and scheduling methods. The first is the ability to simulate sets of equally possible representations of the orebody being assessed. This set of orebodies is the input to the above mentioned stochastic optimisers and represents the geological uncertainty and local grade variability of the orebody, as understood from the available drillhole data; this drastically differs from the conventional single estimated (smoothed out or average type) input to conventional mine design and optimisation methods, and is the major reason for improved results from the stochastic scheduling methods discussed. The second is the ability to assess cash flows using evaluation methods based on multiple simulated realisations of the related commodity price, rather than single average and typically constant, over the LOM and metal price forecasts. Both this second element and the use of uncertainty in metal content lead to improvements in the last two studies noted above.
A limit of both stochastic and conventional long term planning and optimisation of production planning is that short term schedules may frequently deviate from the expectations of long term ones. While long term production scheduling is used to maximise the net present value (NPV) of a project, short term production scheduling focuses on meeting short term production demand within the long term plan, given the processing capacity of the mill, and managing the quality of ore being processed. Both short and long term schedulings are usually based on exploration scale orebody models, whereas the actual short term production performance is controlled by local, blasthole scale data used for grade control and ore/waste selection, usually not available at the time of scheduling. As a result, short term production sequences deviate from the long term plans and are adjusted to meet mill demand or the production performance may substantially deviate from forecasts. In short, discrepancies occur between what is forecasted and what is actually mined.
A solution to the above is to consider production scheduling approaches that are capable of reflecting short scale behaviour of the orebody beforehand, that is, at the planning stage and through grade information available before the actual grade control drilling. High density grade control information offers tighter controls on geology and mineralisation characteristics, and predicts qualities and quantities closer to what is actually being mined. Although not available before blasthole drilling, grade control data can be simulated in different ways. Simple random sampling errors added to simulated realisations from exploration data have been used to assess production schedules reported in a feasibility study (Guardiano et al., 1995), and a more sophisticated approach is considered for assessing mineral resources and reserves (Journel and Kyriakidis, 2004); in operating mines, errors from field duplicates or from nearest paired grade control holes and drillholes have been used to simulate realisations of future grade control data and assess short term production schedules at Escondida Copper Mine, Chile (Khosrowshahi et al., 2007). Multiple simulations of correlated sampling errors using data from previously mined parts of the deposit have been used at Morila Gold Deposit, Mali (Peatie and Dimitrakopoulos, 2009) with excellent results in reconciliations. All existing work in this area assesses potential risks in production schedules or potential reserves and actual reserves; however, it does not address the major question: How to improve or reduce deviations of forecasts from actual production at the time of planning while maximising the present value of an asset? This can be effectively addressed only by technically integrating short scale orebody variability and grade control and short and long term LOM production planning into one approach.
Short scale information is the core element in the above mentioned integration. As this information is unavailable and needs to be stochastically simulated at the time of LOM planning, the way to utilise a range of possible scenarios is through the stochastic optimisation formulations used in stochastic mine planning as reviewed above. This paper contributes a new multistage approach to production scheduling, incorporating short scale deposit information and related grade uncertainty into the scheduling process, thus allowing for the realistic integration of short and long term mine production schedules, as well as the generation of more reliable mine production forecasts. A case study at an operating gold deposit demonstrates the approach, provides comparisons between the traditional schedules of the mine, accounts for stochastic schedules before and after simulated dense grade control information and quantifies the expected monetary value of the method. In the next sections, the proposed approach is first outlined, the case study is presented, results are analysed and conclusions follow.
A new multistage approach to production scheduling
The multistage approach to production scheduling proposed here is a sequence of steps employing separate techniques for each stage and is based on the stochastic mine planning optimisation methods mentioned above (Albor and Dimitrakopoulos, 2010; Ramazan and Dimitrakopoulos, 2012; Benndorf and Dimitrakopoulos, 2013; Leite and Dimitrakopoulos, 2013). The approach differs conceptually from the traditional approaches (current non-stochastic ‘best practices’) in many aspects. The major difference is that, similarly to previous stochastic mine schedule optimisation, the proposed multistage approach requires multiple, equally probable representations of the orebody, which are generated from spatial Monte Carlo simulation methods (Goovaerts, 1997), but at two different and distinct levels. The first level, and the one used in past work, is that of exploration type datasets and information; the second level is that of grade control data. This simulation based framework assists in quantifying and generating risk managing schedules as well as accommodating the interaction of information at different scales in space and time. Different scales in space refer to the local variability of the deposit and local classification of materials selected as ore and waste through a grade control process; and physical parts of the orebody that are mined over long periods of time as individual pit units (pushbacks) and parts of individual pit units that correspond to the parts of pushbacks mined over short periods of time from the same mining front. Different scales in time refer to the yearly time units on which the long term plans are reported and relatively shorter time periods in short term planning (weekly, monthly or quarterly). As a result of the ability to link information at different scales in space and time, short scale variability and short and long term schedules are integrated. The proposed approach or process has four stages shown in Fig. 1, which also shows how this compares to the steps followed in the existing stochastic LOM planning:

Schematic presentation of proposed multistage mine scheduling approach
Generate high density future grade control data for incorporation into the production scheduling process. These data are not yet available at the time of planning and are simulated using stochastic methods.
Update preexisting simulated orebody models using the simulated future grade control information and a suitable stochastic simulation technique.
Generate production schedules using a stochastic optimisation method handling multiple simulated orebody models from stage 2, while accommodating the need to both maximise NPV and minimise deviations from production targets.
Quantify grade risk in the produced schedules, compare schedules with and without simulated short scale orebody information and report mine schedules as needed.
These four stages are discussed next in greater detail.
Stage 1: Generation of future grade control drilling data
High density future grade control data can be simulated using several approaches, such as those reviewed in the introduction. A more elaborate and effective method is outlined here and is used in the case study that follows. The method, schematically shown in Fig. 2, assumes that there are mined out parts of an orebody with grade control information of comparable quality and characteristics that can be assumed in the remainder of the orebody being studied. Exploration drilling and grade control data from a mined out section or bench of a deposit are used to quantify the special relationship between the two types of data. As it is not physically possible to have exploration and grade control information available at the same location, their spatial cross-correlation (relationship) is quantified through the so called pseudo cross-variogram (Myers, 1991). Having quantified this spatial relationship, a method such as the sequential Gaussian cosimulation of two variables (Goovaerts, 1997) can be used to generate the future grade control data in unmined sections of an open pit. The cosimulation approach ensures that the simulated future grade control data have the same distribution as past grade control information and the same auto- and cross-correlation (with exploration data).
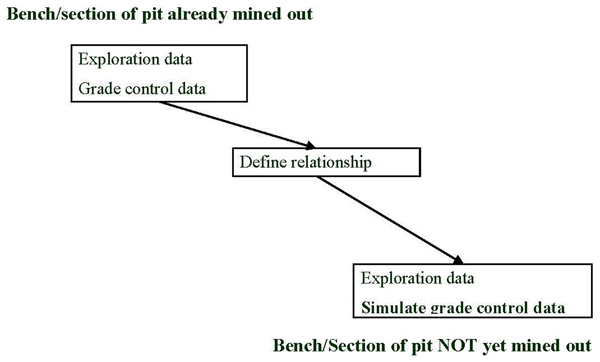
Simulating future grade control data
Stage 2: Updating of existing simulations with future grade control data
The second stage of the production scheduling approach presented herein involves the updating of preexisting simulated orebody models. This is because orebodies under study have frequently already been simulated for other purposes, or because there can be more than one scenario of possible sets of future data to consider, and so on. Generally the ability to update preexisting realisations of an orebody is useful in improving the efficiency of the process. The only known simulation technique that is capable of providing updating capabilities to accommodate the updating of preexisting simulations with new data such as grade control is the technique of conditional simulation by successive residuals or CSSR (Vargas–Guzman and Dimitrakopoulos, 2003; Jewbali and Dimitrakopoulos, 2011). The CSSR is a simulation method based on the column decomposition of the covariance matrix, which leads to the expression of the simulation process as a series of conditional covariance matrices.
More specifically, for the simulation of a grid G with K nodes, conditioned on a dataset D with R points (data locations), the simulation equation using the column decomposition and generating the simulated values [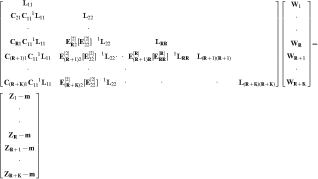
 contain the simulated values,
  contain the R data values available and
  contain the independent N(0,1) random numbers, and
  are residual covariances of the sth order and are calculated through
  for s>2. For s = 2, the residual second order covariances are calculated through
 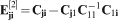 .
.
The above equation can be seen to separate data influences which make updating of existing orebody models possible by permitting a recalculation of only those influences that change when new information becomes available. For example, if new data become available at the location of the first node, which occupies the (R+1)th row in the matrix
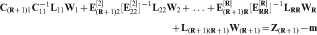
 is now known, this allows for the calculation of
  .
.
Then, the next node [(R+2)th row] is given by equation (3)

 component of the equation, i.e. the only part of the equation that changes when node 1 becomes a data location, the simulated value at node 2 is updated. The end result of the use of CSSR is a set of simulated orebody models that are conditioned on both the known exploration data and the simulated future grade control data. Note that new information for updating may also be additional data from near mine exploration drilling or in-fill drilling.
Stage 3: Stochastic integer programming formulation
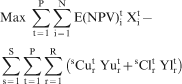
To generate production schedules based on a group of simulated realisations (scenarios) of an orebody, a stochastic optimisation formulation based on SIP is used. Note that the use of stochastic optimisers allows the scheduling process to capitalise on knowing the joint local uncertainty of the economic values of the mining blocks composing the representation of the orebody at hand. The formulation, described next, is a simpler version of the one developed in Ramazan and Dimitrakopoulos (2012). The objective function of this formulation attempts to maximise expected discounted cashflows while minimising the cost of deviating from the set production targets and it is
 is a binary variable indicating block i mined in period t (1 = mined/0 = not mined),
  is the expected NPV if block i is mined in period t,
  is the excess amount produced compared to the target (grade/tonnage) r in period t for orebody model s,
  is the unit cost to penalise
  in period t,
  is the deficient amount produced in relation to target (grade/tonnage) r in period t for orebody model s and
  is the unit cost to penalise
  in period t.
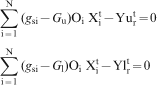
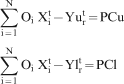
The first component in equation (4) maximises the total discounted cashflow. The expected NPV is determined by calculating economic values for each simulated model, and then averaging them. This first component reflects the conventional goal of optimising total discounted cashflow over the LOM. The second component minimises the deviations between expected productions as these are described by simulated orebody models used as input and a set of mine production targets, and minimises the risk of not meeting targets due to grade uncertainty. The deviations are calculated over the set of simulated orebody models and are penalised with costs. This second component reflects the goal of short term production scheduling and its use together with the first component provides the means to integrate long- and short term planning, in the context of the approach proposed herein. It should be noted that a novelty of this formulation is that the costs of deviating from production expectations can be discounted for each subsequent period using a geological discount rate. As a result, the cost related to not meeting mill requirements can be set higher in the first period than in subsequent periods, allowing the risk distribution between production periods to be managed. The related constraints are shown below.
Grade constraints


Stage 4: Quantification of uncertainty
Stage four aims to quantify grade risk in the produced schedules that have been generated. Any schedule can be assessed against possible scenarios of orebodies, be they constructed from exploration datasets only or in combination with future grade control data. This allows comparisons and assessments, including an evaluation of effects from potential short scale orebody variability.
Case study at a Sunrise Dam Gold Mine
The deposit and mine
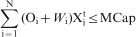
For this case study, data from the Sunrise Dam mine, an open pit gold mine which lies ∼220 km north of Kalgoorlie and 80 km south of Laverton, WA is used. It sits on the edge of Lake Carey, in the northeastern corner of the eastern Goldfield province of Western Australia. The mine contains both the Cleo and Sunrise deposits, which are separated by an ownership boundary. The Sunrise/Cleo gold deposit lies along a shear zone and the general trend of the gold mineralisation parallel to this zone with the detailed geological description is presented in Newton et al. (1998). Gold mineralisation can be both secondary and primary. Secondary mineralisation is related to iron oxidation fronts and water tables and to aggregation within paleochannels, while primary mineralisation can roughly be related to high strain shear zones and low strain stockwork vein zones. Based on the deposit geology, 17 domains are inside the open pit (sections of which are shown in Fig. 3). Mining is done using four excavators which load into 25 rear dump trucks. Since opening, the mine has produced more than 2 million ounces of gold. The pit is 2·1 km long and 1·1 km wide with a final depth of 450 m to be reached at end of its life. The total amount of waste mined in 2004 was ∼43 Mt, which drops to ∼26 Mt in 2005 and again to 11 Mt in 2007. This will necessitate a resizing of the equipment fleet sometime in mid-2005. Figure 3 depicts the long term (yearly) production schedule in use at the mine. This is derived from an estimated model [multiple indicator Kriging or MIK (Goovaerts, 1997)] in use at the mine site. The mine's schedule proceeds one layer at a time and indicates that the pit will be exhausted by the end of the fifth year. At this mine, blasting occurs on 7·5 m benches and grade control is done using reverse circulation drilling on 5×7 m spacing. The plant capacity is 3·6 Mtpa and the mill circuit consists of crushing and grinding after which the gold is recovered through a carbon in leach circuit. A specific characteristic of Sunrise Dam mine relevant to the present study is its long history of large positive reconciliations when comparing resource models and related production forecasts to grade control, ore production and mill reconciliations. This is due to the presence of small short scale mineralised structures, too small in scale to be picked up by exploration drilling, but detected by grade control.
East–west sections of yearly schedule at Sunrise Dam Gold Mine at the time of the study presented herein
Generation of future grade control data
Within the mined out section of the pit, 75 789 grade control drillholes were available. These were separated based on the geological domain they belonged to. In addition, 3934 exploration diamond and reverse circulation holes were available within the same section of the pit. These were also divided based on geological domains. For each geological domain, these two sets of information were used to derive the relationship between exploration and grade control data. This relationship can then be extended to unmined sections of the pit where only exploration data are available. For the purposes of this study, 20 future grade control data simulations were generated, using the sequential cosimulation method discussed earlier, on 5×7×2·5 spacing in the unmined sections of the pit (the volume displayed in Fig. 3).
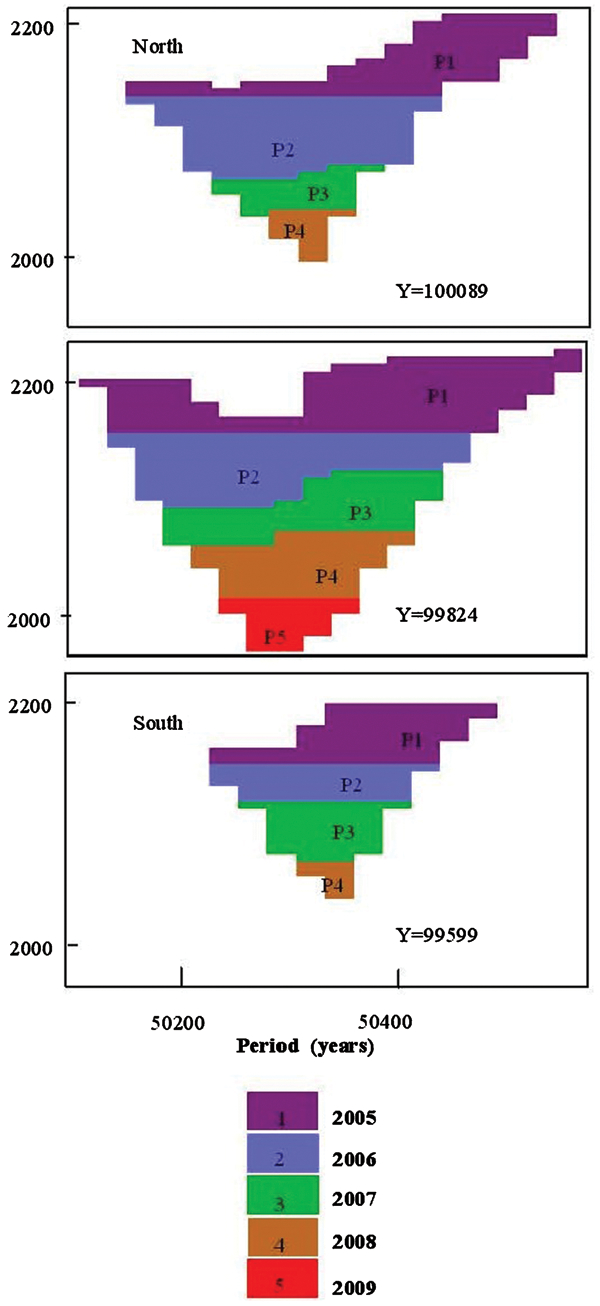
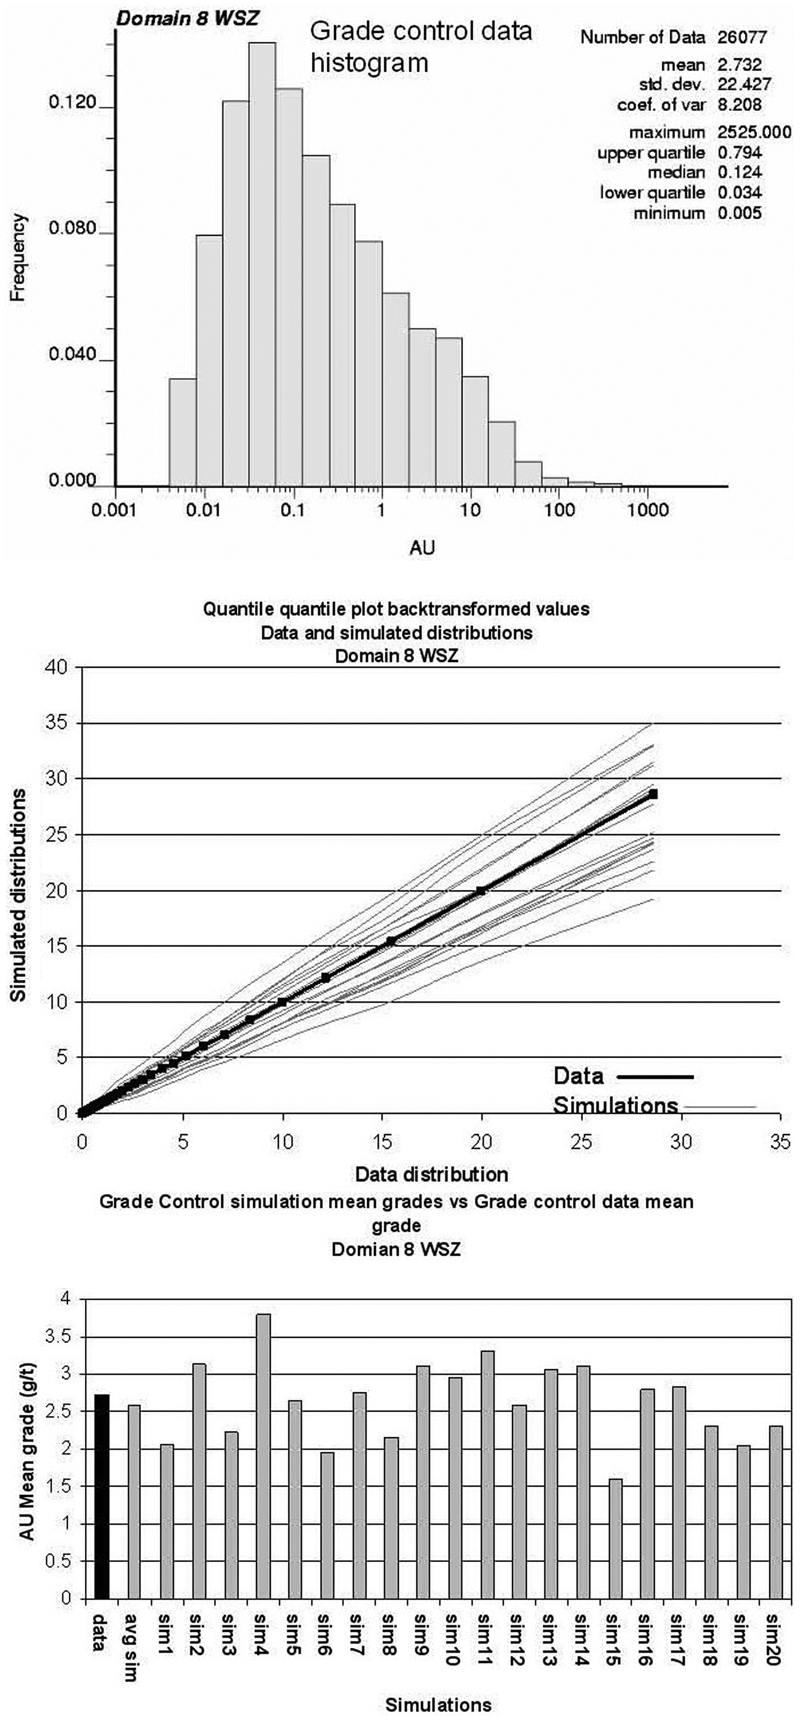
Figure 4 displays the histogram of grade control data for a mined out section of domain WSZ, one of the 17 domains within the pit. The figure also displays a comparison between the grade control data simulations for the unmined section of domain WSZ and the grade control data available from the mined out section of domain WSZ in the pit. As can be seen, the simulations closely approximate the grade control data histogram. Also shown is a comparison between the mean grades of the simulations and the mean grade of the WSZ grade control data. The mean grade of the simulations fluctuates around the mean of the grade control data. The grade control simulations also reproduce the grade control variogram model derived from grade control data (from mined out sections of domain WSZ). The relationship between exploration and grade control data in a mined out section of domain WSZ is given by the pseudo cross-variogram, which is reproduced by the grade control simulations for unmined sections of domain WSZ, as shown by Fig. 5. As it can be seen, statistical characteristics of the grade control data for a particular domain are derived from mined out sections of the pit and are reproduced in unmined sections of the pit for that same domain. Note that the statistical characteristics of grade control data versus exploration data are considered to be the same in the mined out part of domain WSZ and the part to be scheduled for mining; this is an assumption of the method and is validated as the operation proceeds and production reconciliation occurs.
Reproduction of grade control data histogram
Reproduction of grade control variogram (left) and pseudo cross-variogram (right) in three perpendicular directions (normal scores)
Updating existing simulations with future grade control data
Stage 2 of the production scheduling approach involves using conditional simulation by successive residuals to update preexisting orebody models. The 20 available simulations (on 2×2×2·5 m spacing and with a total of 17 million grid nodes per simulation) conditioned on exploration data were updated with the 20 simulated future grade control data, generating a set of 400 simulations that are conditioned on both the known exploration data and the simulated future grade control data scenarios. Twenty updated simulations are chosen at random for further study.
For reasons of comparison and processing, the simulations are reblocked to 15×30×7·5 m mining blocks, which is the block size used at the mine and the generation of grade tonnage curves. Grade tonnage curves are shown in Fig. 6. It is apparent from the figure that for the model based on exploration data, the average grade above cutoff is higher at all cutoffs. The amount of tonnes above cutoff is lower compared to the updated models. To facilitate understanding of the grade–tonnage curves in Fig. 6, it is important to recall that over the past production time of the deposit, exploration and grade control drilling showed the grade control data as having a higher proportion of higher grades. The main reason for this is that grade control picks up small short scale mineralised structures, too small in scale to be picked up by exploration drilling. As mentioned earlier, the mine has had a long history of strong positive reconciliation between resource model and grade control/mill and the grade tonnage curves in Fig. 6 reflect that, as they should. The opposite may be observed in other mines; that is, the resource/reserve model of the orebody overstates high grades and the grade control cannot find all these high grades.
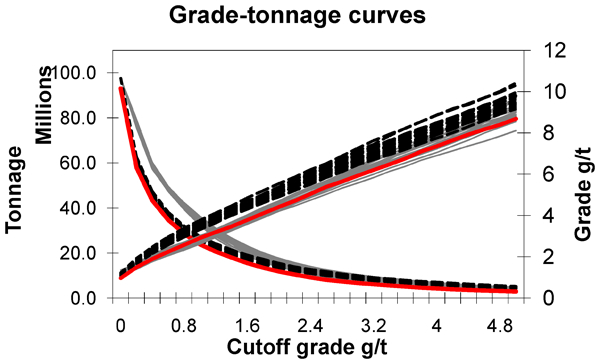
Grade tonnage curves for models based on exploration data (dotted lines), models updated with simulated future grade control data (thin solid lines) and mines MIK model (thick solid line)
Figure 7 displays the ore tonnes and metal recovered when mining is done according to the mine's yearly schedule (shown in Fig. 3), ore is identified according to the mine's MIK model of the orebody and short scale deposit information is taken into account (simulated future grade control data). The risk profiles were generated by running the 20 updated models through the mine's yearly schedule. During this process the tonnes of ore/metal produced and NPV generated by each updated model were recorded and plotted on Fig. 7. The updated models indicated that the amount of ore tonnes produced is not enough to fill the plant to capacity (3·6 Mtpa) for all the years from 2005 to 2009, if the mine's schedule is to be implemented and ore blocks are identified by the mine's MIK model of the orebody. They also indicate a 50% chance of negative NPV in 2005 when insufficient metal is produced.
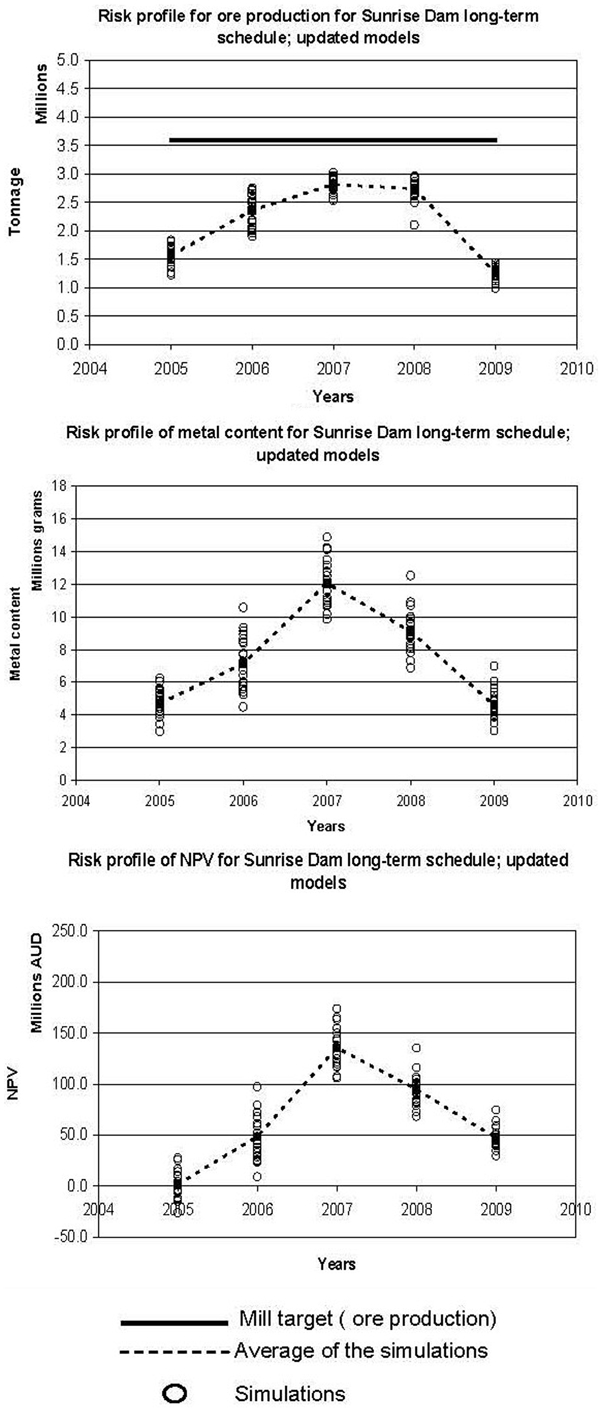
Performance of mine's yearly schedule when local orebody information is taken into account (simulated models updated with simulated future grade control data): note that ore blocks are defined from the mine's MIK orebody model
Deriving production schedules using the SIP formulation
The following section describes the process, as given in Fig. 1, used to derive the production schedules. First, the 20 simulated orebody models conditioned on exploration data are put through the SIP formulation in equation (4). Next, the 20 updated orebody models are run through the SIP formulation and a production schedule accounting for short scale orebody information is derived. This methodology allows for a comparison of the schedules derived using orebody models based on two sets of information. As a result, it provides a look at the consequences of not taking closer spaced grade control information into account when performing production scheduling. The discussion on why a group of 20 simulated models is used is deferred for a subsequent section.
The production schedules were generated for 4-month periods (short term schedules). The production capacity for each 4-month period was set at 1·2 MT and the targeted grade constraints between 2 and 7 g t−1. To make the schedules practical for equipment mobility and space, the schedules were smoothed. After smoothing, the simulated orebody models are run through their respective schedules to generate risk profiles for ore, metal and NPV. The risk profiles of the production schedule derived from the 20 exploration based models for ore, metal and NPV are shown in Fig. 8. As the figure shows, the quarterly production target of 1·2 Mtpa is met for 2005–2007. Note that this schedule predicts that the pit will be exhausted by 2008. The figure also displays the performance of the mine's MIK model when mining proceeds using the schedule derived from the exploration based orebody models. The MIK model predicts a shortfall in ore production after Q3 2007. The NPV predicted by the MIK model is almost always lower or towards the lower end of the risk profile as described by the simulations. The cumulative NPV predicted by the MIK model is 364 million AUD compared to the schedule from the simulations and SIP which is 552 million AUD.
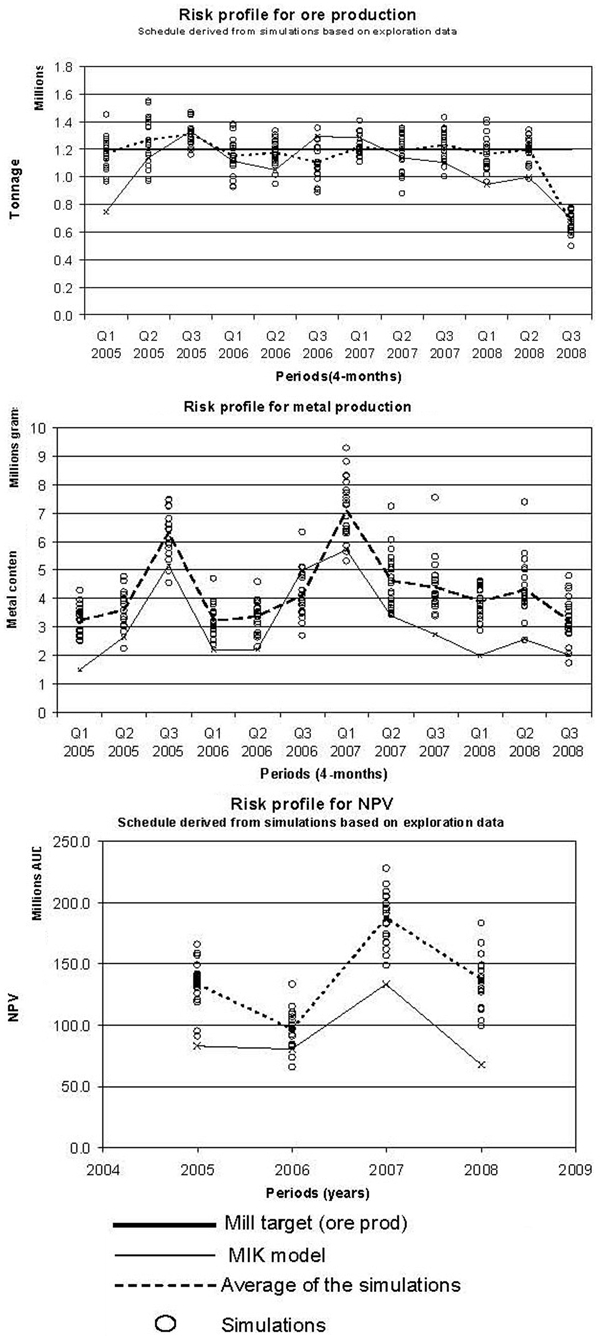
Risk profiles of ore, metal and NPV for production schedules derived from orebody models based on exploration data
Figure 9 describes the schedule derived from the updated models. This schedule extends the LOM by another year to 2009. As the figure shows, the short term schedule has no problem delivering 1·2 Mtpa of ore in all quarters except in Q3 2009, when the last of the ore will be mined. The figure also shows that according to the MIK model, there will be a shortfall in ore production for all the remaining mine life when mining proceeds according to the schedule derived from updated simulated models. The MIK model generates a cumulative NPV of 375 million AUD, while the cumulative average of the updated simulations is 561 million AUD. A summary of the cumulative averages of ore tonnes, metal and NPV is given in Table 1, below. The schedules based on updated models produce 3·6 Mt more ore and as a consequence 2·6 Mg more metal, which results in a cumulative NPV that is 7·7 million AUD higher.
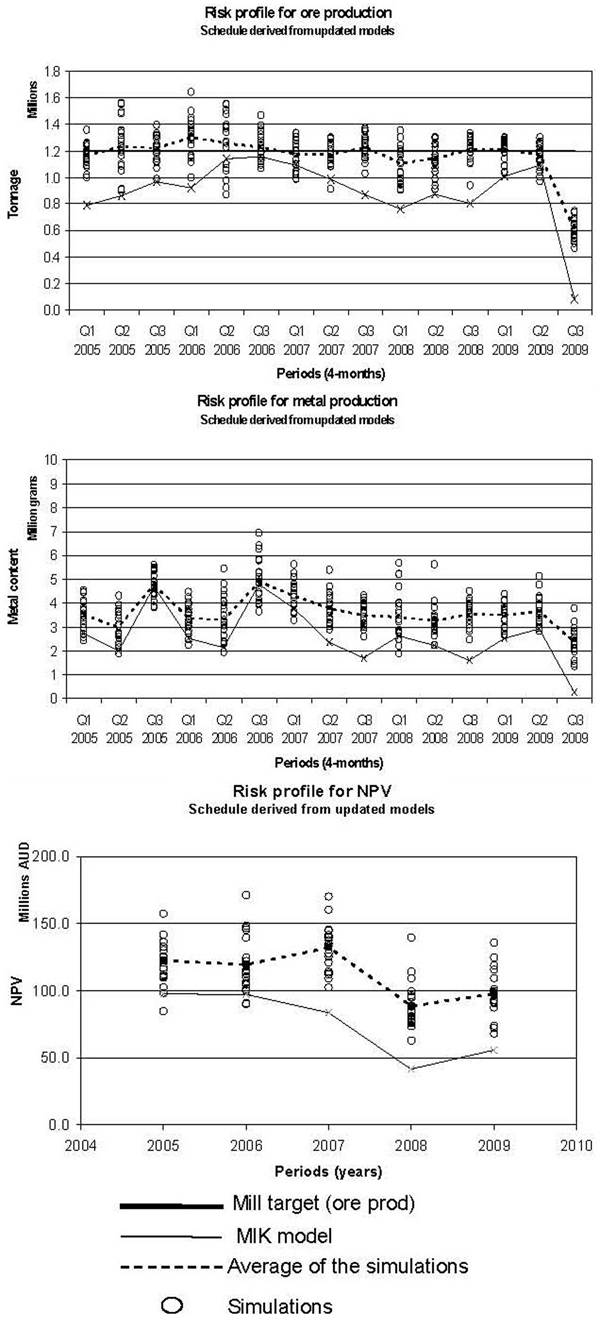
Risk profiles of ore, metal and NPV for mine's production schedule derived from orebody models displaying grade control characteristics
Cumulative averages for ore tonnes, metal and NPV over all simulated orebody models (both exploration data based and updated models)
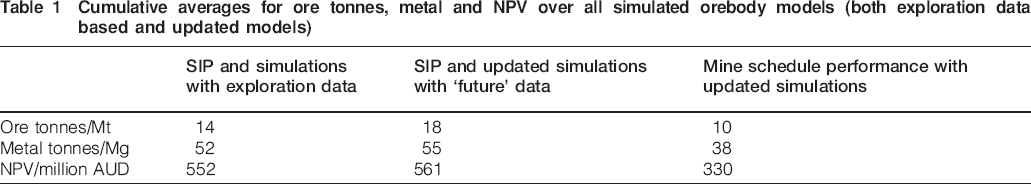
The production schedules based on orebody models derived from exploration data (that do not account for local orebody knowledge and characteristics) underestimate the actual tonnes of ore mined from the orebody. The derived exploration based schedules are a conservative option. Taking local grade control information into account indicates that there is probably sufficient ore to extend the LOM to 2009 compared to 2008 when only exploration data are used. Figure 8 displays the production schedules for the exploration based simulations and the updated simulations. As Fig. 9 shows, the two schedules are different in that different sections of the pit are mined out in different time periods. However, when compared to Fig. 3, both of the SIP derived schedules mine the pit out in a series of successive cones, while the mine's yearly schedule proceeds in layers.
Discussion on results
In assessing the results in the previous section, it is helpful to address some specific topics relevant to the methods employed herein, particularly stochastic optimisers developed for mine production scheduling such as the SIP in stage 3. The reason that 20 simulated scenarios were used in the case study at Sunrise Dam Gold Mine is that past work, for example in Albor and Dimitrakopoulos (2009), shows that starting from after ∼15 simulated representations of an orebody, the stochastic schedules generated converge to a stable final schedule and using, say, 20 versus 400 will not provide different results in terms of schedules and forecasts. This is not surprizing, as it is a volume support effect: while we simulate the grades of the blocks of a given size used to represent a mineral deposit and can measure any difference one wishes between simulated scenarios, an LOM production schedule is a grouping of a few thousand of these mining blocks in just one time (mining) period under various constraints. This means that the sensitivity of a schedule is not the sensitivity one observes at the scale of individual mining blocks; the support of an LOM schedule is orders of magnitude larger and this explains the insensitivity of the stochastic schedule to additional scenarios after a point. This is valid in the case study at Sunrise Dam for both stochastic schedules; the first generated using only simulations based on the original exploration data and the second generated using the updated simulations with scenarios of future simulated grade control data. Note that the sizes of the mining blocks are the same as well as the mining capacities used for both the SIP generated and LOM production schedules.
The NPV assessments between both stochastic schedules and the mine's are not surprising despite the fact it is in the order of 50% (Table 1). One observation relevant to this difference issue is evident in past work: LOM schedules from conventional approaches and estimated orebody models, no matter what methods are being used, will have a lower NPV assessment when compared to the corresponding schedules generated from stochastic optimisation methods. A main reason for this is that the scheduling process uses the joint local uncertainty of the economic values of the mining blocks in the orebody as provided by a group of simulated deposit scenarios used as the input (see for example the second part in equation (4) and the related stochastic constraints).
There is no theoretical reason why the NPV generated from the proposed multistage approach will be higher than the corresponding stochastic schedule without the simulated grade control data. This is specific to the Sunrise Dam mine and caused due to the differences seen in Fig. 6, discussed in the related section. In a different case study, if the resource/reserve model(s) of the orebody overstates high grades (higher proportion) and the grade control cannot find these high grades (lower proportion), the exact opposite will occur. Note that the use of stochastic optimisers allows the scheduling process to capitalise on knowing the joint local uncertainty of the economic values of the mining blocks composing the representation of the orebody at hand.
The main contribution of the multistage production scheduling approach presented in this paper is its ability to integrate short and long term production scheduling through the concept of simulated future grade control data. This means that the discrepancies between the LOM schedule and the operational short term schedule will be minimised, assuming that the past grade control and production reconciliations will maintain their relation. As shown in this paper, this leads to a higher probability of meeting production targets, thus increasing productivity. It should be stressed that the value increased productivity is not represented in the standard assessment of NPV and this can be accounted for when analysing LOM production schedules.
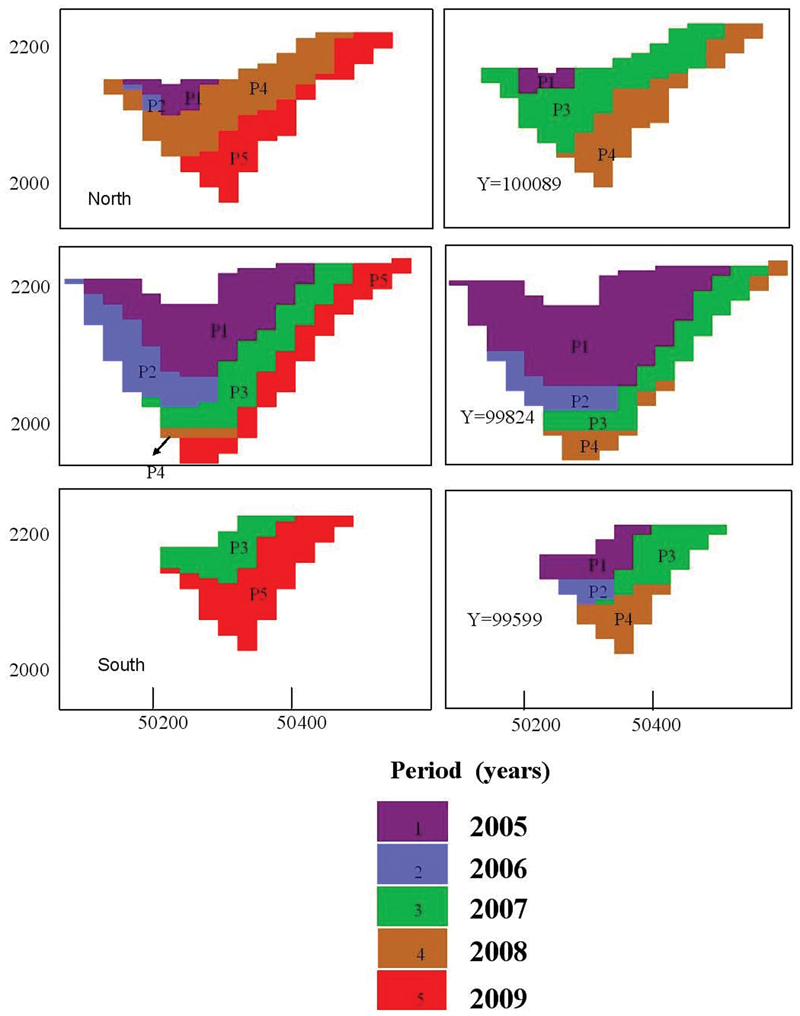
West–east sections of Sunrise pit displaying production schedules derived from simulation based on exploration data (right) and updated models (left)
Conclusions
A new multistage stochastic mine production scheduling approach presented herein includes four stages. Stage 1 generates high density future grade control data for incorporation into the production scheduling process. It is based on sequential Gaussian cosimulation of exploration and grade control data from previously mined out parts of a deposit. Stage 2 employs conditional simulation by successive residuals to update preexisting simulated orebody models with the simulated future grade control information from stage 1. Stage 3 uses an SIP mine scheduling formulation and balances both maximising NPV and minimising deviations from production targets. Stage 4 includes quantification of risk in the produced schedules generated and reporting.
The application at Sunrise Dam, a large operating gold mine, demonstrates that the proposed approach is practical, and adds value to the operation. The approach is shown to deliver 3·6 Mt of additional ore and 2·6 Mg more metal, which matches better with the mine's reconciliations. The approach also results in a cumulative NPV which is on average 7·7 million dollars higher than that of a comparable stochastic schedule without the simulated grade control data, and substantially higher (by 230 million AUD) when compared to the NPV from the actual schedule of the mine. It is important to note that the key contribution of the multistage production scheduling approach presented in this paper is its ability to integrate short and long term production scheduling through the concept of simulated future grade control data. This means that the discrepancies between the LOM schedule and the operational short term schedule will be minimised, assuming that the past grade control and production reconciliations maintain their relation. As shown in this paper, this leads to a higher probability of meeting production targets thus increasing productivity. It should be stressed that the value increased productivity is not represented in the standard assessment of NPV and this can be accounted for when analysing LOM production schedules. As capital intensity of mining projects is high, this last point may be critically important to mining operations. Last but not least, the additional technical work required in implementing the approach presented herein, compared to the present best mining industry practices, is insignificant when compared to the value of the operations or projects being supported. Generating mine production schedules that have a higher probability of delivering tonnes and grade is a positive contribution. Although in this case study short scale mineralised features which are picked up by grade control, but not by exploration data, lead to a history of positive reconciliation, the opposite may also happen in other mines; that is, when the resource model overstates high grades and the grade control cannot find all of the high grades.
Footnotes
Acknowledgements
The authors would like to acknowledge substantial financial contributions from Anglo Gold Ashanti, BHP Billiton, Rio Tinto and Xstrata Copper, as well as McGill's COSMO Stochastic Mine Planning Laboratory and NSERC Discovery Grant 239019-06.
This paper is part of a special issue on Strategic Mine Planning