
Abstract
In the traditional physical metallurgy approach, the microstructure evolves as the product of the interactions between composition and process parameters, controlled by thermodynamic and kinetic conditions. Thus, the approach is more evolutionary than constructive. An architecturally designed microstructure implies planning, design and construction of microstructure considering nature, size, morphology and distribution of the constituent phases on a suitably conceived topological framework. This investigation puts emphasis on performance driven construction of the microstructure with precise calculation of response of microstructural constituents under the given loading conditions. With the aforesaid motivation, the present study elucidates the principle involving microstructural generation by Voronoi tessellation and subsequent elastoplastic finite element simulation. In addition, the present study also explores the correlation between architecturing and initiation of instability in the microstructure through genetic programming.
Keywords
Introduction
The need of deterministic structure–property correlation demands the ‘a priori’ design of microstructures, in accordance with the demand of the properties. Recently, there has been a shift from experience based design to deterministic design of materials. Among the various approaches, ‘architectured approach’ is one of the recent, which concerns amalgamation of microstructure design, material combination and optimisation of geometry of the constituents to achieve the best combination of properties. 1 The development of architectured approach of material design has genesis in the design concept of hybrid materials, where two or more materials are assembled in a manner to achieve the properties, which are not achievable by any of the individual constituent. 2 The processing of architectured materials is one of the challenging problems in the material science. There have been several approaches for the development of architectured materials, namely, cocasting of two different alloys, 3 gas carburisation reactions to non-isothermal situations combined with masking technology, 4 surface deformation 5 or geometric induced strain hardening. 6
The concept of architectured materials is manifested by the presence of varying length scales in the structure ranging from macroscopic to microstructural level and/or engineered spatial distribution of the constituent phases. Hence, it aims at the development of engineered heterogeneous materials. The advantage may be understood in terms of the possibility of attainment of properties, which are fundamentally contradictory in nature. For example, the need of the increment of both strength and strain hardening may be met by architecturing of material to invoke the length scale between the microstructure and that of the components. 6
The architecturing in the materials may be defined on the basis of the parameter called ‘order of architecture’, which may be defined as the ratio of length scale of representative volume element (RVE) and length scale of architecturing (equation (1))
Figure 1 elaborates the estimation of order of architecture against the length scales. The ‘core–shell’ structure of the precipitates in the case of Fe–2·5Cu–2·1Al–1·5Mn alloys exemplifies the lowest level of architecturing, where the Cu core is incased by Ni (Mn, Al) shell structure and hence ultimately leads to the variation in the properties. 7 The second order of architecture is exemplified in the microstructural architecture, as seen in the case of compositionally graded materials, 8 while the third order of architecture is exemplified in sandwich panels of the aircraft, where architecturing lies in the design of honeycomb structure in the core depending upon the functionality. Last, the highest order of architecture is seen in the superstructures (i.e. macroscopic structures).
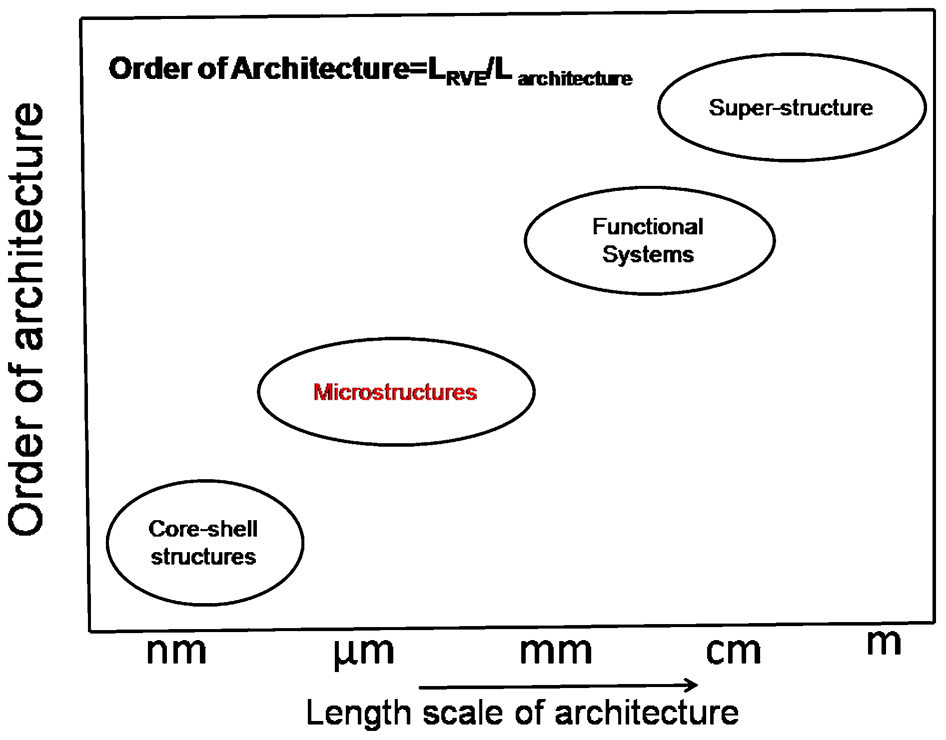
Schematic representation of variation order of architecture with length scale of architecture
In the present investigation, the dual phase (DP) steel has been chosen, as it principally contains both soft (ferrite) and hard (martensite) phases, where increment of volume fraction of martensite leads to the increment in the strength. 9 Mechanical behaviour of the DP steel has been extensively studied with emphasis on volume fraction10,11 and morphology of martensite. 12 The strength of the DP microstructure takes place up to certain critical volume fraction of martensite, above which the strength decreases due to carbon dilution, which is manifested in terms of the presence of two stages of strain hardening, in contrast to three stages of strain hardening usually observed in the case of DP steel having low volume fraction of martensite (i.e. <30). 13 Subsequently, it is reported that, even at the critical level of martensite content, the strength of the DP steel may be increased without sacrifice in elongation by varying the morphology of the martensite. 14 Thus, it is of interest to architecture the DP steel microstructure in a manner that the strength as well as the uniform elongation can be varied for the constant volume fraction of martensite and to assess the corresponding occurrence of the instability in the microstructure. As the degree of morphological continuity has significant impact on the stress/stress partitioning in the course of strain hardening, even at constant volume fraction second phase, 15 the connectivity of the individual phase may be quantified by the measure of the contiguity of the constituent phases. 16
For this purpose, ferrite contiguity parameter (FCP) and martensite contiguity parameter (MCP) have been defined by equations (2) and (3) respectively and shown schematically in Fig. 2 (where NFF, NFM and NMM represent the number of ferrite–ferrite, ferrite–martensite and martensite–martensite intercepted by straight line, as shown)
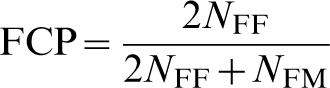
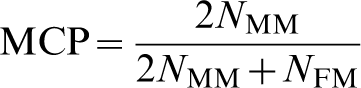
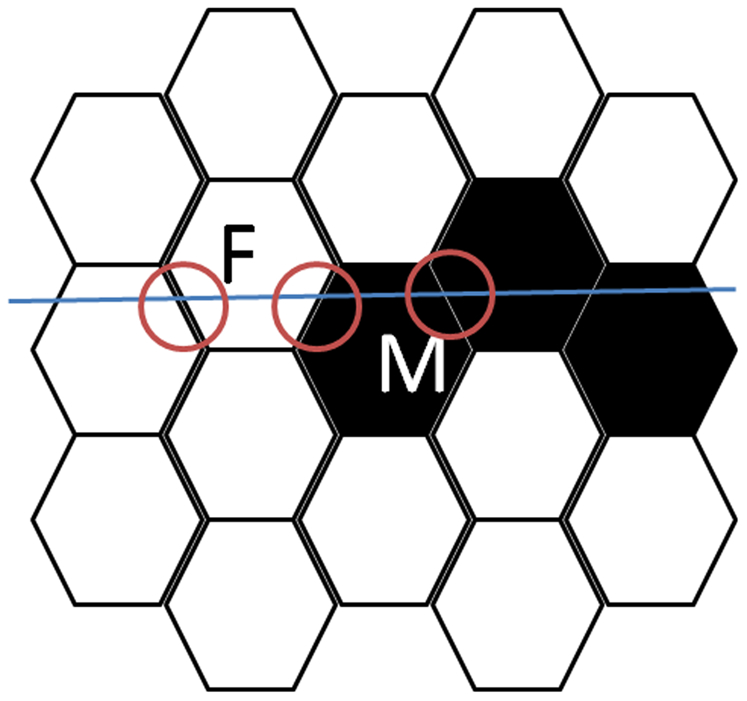
Schematic representation of definition of ferrite and martensite contiguity parameter (NFF, number of ferrite–ferrite interface intersections; NFM, number of ferrite–martensite intersections; NMM, number of martensite–martensite intersections)
Contiguity values may range from 0 to 1. When grains of the same phase do not connect at all in a certain direction, the contiguity value is zero in that direction, while the contiguity value of unity means that grains of that phase are connected in that direction without the interruption by the grains of the second phase. In the present study, directional contiguity for ferrite (FCP) and martensite (MCP) is calculated for along the loading direction. The main motivation to introduce contiguity parameter for DP steel microstructure is to quantitatively correlate the microstructural parameters with the strain partitioning and stress percolation in the course of workhardening.
Multilevel Voronoi
The mechanical performance of steel grades depends strongly on the microstructure. For accurate prediction of the mechanical performance, multiscale models must be built on RVE with very realistic geometric features. Important parameters are spatial distribution of the phases, volume fractions, and size and shape distributions of particles and grains. Standard Voronoi tessellations are widely used for this purpose and are powerful in creating different complex patterns. By applying different generating point fields (random Poisson, distorted grid, centre of mass, clustered, hard core, etc.), a wide range of different microstructures can be created. Details regarding the development of such algorithms and their geometric properties can be found elsewhere. 17
It is imperative to mention here that the shape of the constructing Voronoi cells is still limited to convex shape. To overcome this limitation, a new algorithm, multilevel Voronoi, has been developed. The basic principles have first been presented at the COMPLAS X conference. 18 In Fig. 3, the scheme is clarified in detail. At the first level, a point field is used to create a fine tessellation of Voronoi cells. This geometry is made periodic by copying the inner point field into eight directions. After that, the Voronoi structure of the complete point field is calculated. Only the Voronoi cells of the inner rectangle are then used to create a periodic structure. Finally, the cells that are sectioned by the edges of this rectangle are modified to fit exactly inside this rectangle. This has been followed by development of a second level of coarser tessellation with another less dense point field. This will serve as a master for the construction of complex shaped grains. Cells of the finer tessellation, where the generating sites are in a certain master cell, are grouped with the same grain identification as that of the master cell. By modifying point field densities of both levels, the user is able to generate a broad range of different shapes and sizes of grains. The new algorithm is called multilevel because this principle is not limited to two levels. The user may create as many levels as needed for his purpose. For the present purpose, two levels are just adequate. This algorithm is applied in two and three dimensions. The versatility of the algorithm for shapes and sizes has been further improved by substituting a weight to the distance of points to the generating sites of the Voronoi tessellation for the second level. More details about this weighted Voronoi principle can be found elsewhere. 18
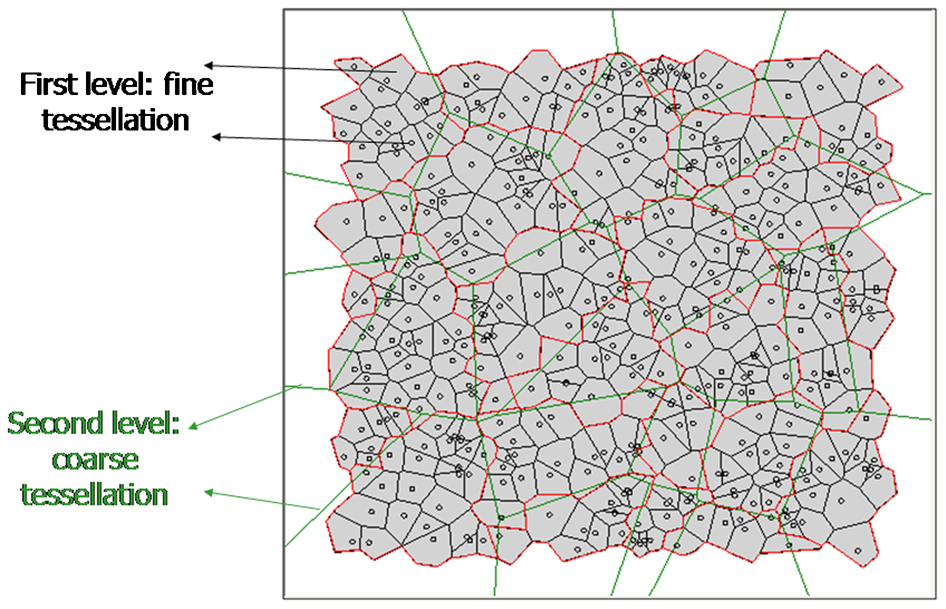
Schematic representation of principles of multilevel Voronoi tessellation
Depending on the spatial arrangement of generating point field, the edges of Voronoi cells can become randomly small. This will cause unwanted extreme mesh refinement in the subsequent finite element simulation. The larger the point field, the bigger chance that these disturbances will occur. In the present complex model microstructures, this will certainly happen many times. Therefore, a doubly connected half-edge data 19 structure has been used for building the geometry. With this data structure, an option of removing short edges below a user defined threshold has been incorporated. In practice, short edges below ∼5 of average edge length can be removed, without changing the geometry too much.
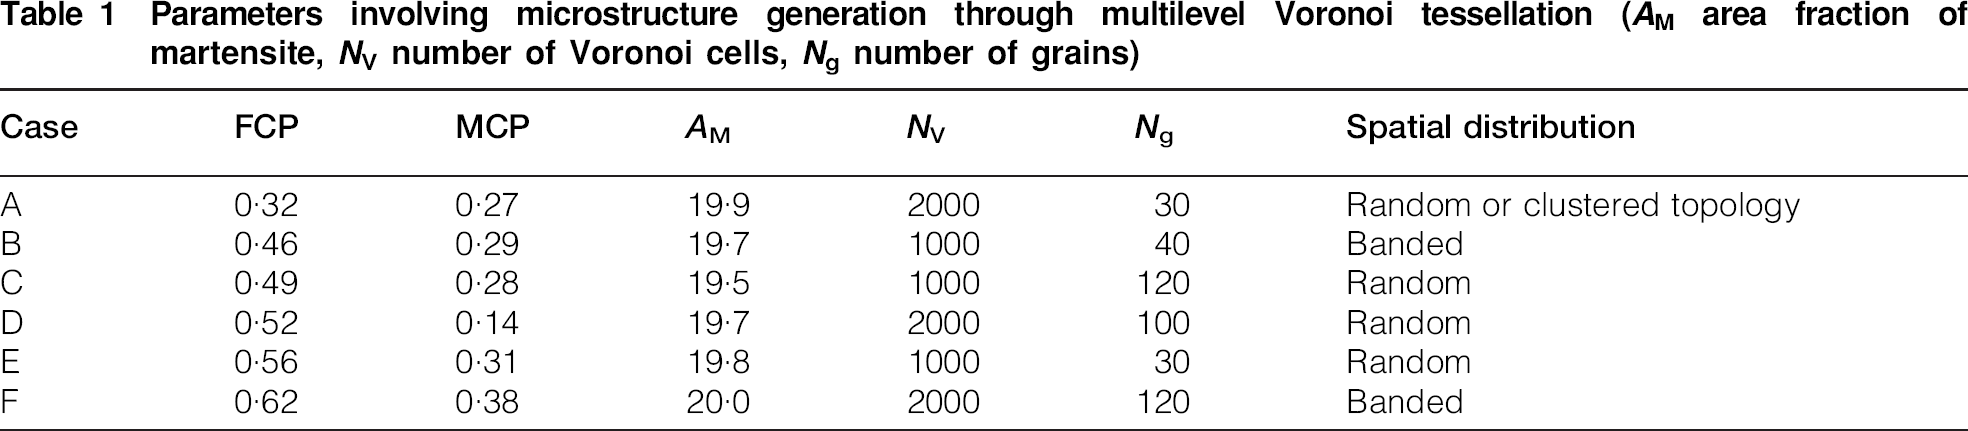
Different spatial distributions of the phases are created by assigning phase identifications to Voronoi cells. In the simulations described here, the ferrite phase property has been assigned to the second level grain identification. The hard martensite phase distribution is created in two steps: first, by assigning the phase properties randomly to the cells in the first level, and second, by allowing only those cells to get the phase property, which is situated at the grain boundary. We investigated two spatial distributions of second phase particles: a random distribution and a banded distribution. The banded distribution is created by defining a region in space and where second phase particles may occur. To get different degrees of ‘bandedness’, a user can assign different numbers of cells in this region, which will belong to the harder phase. By assigning different numbers of cells to the second phase, the user can create the targeted volume or area fraction of the second phase. Table 1 represents the parameters involving the generation of microstructures through the above stated multilevel Voronoi algorithm with corresponding topology, and Fig. 4 represents the microstructures, as generated through multilevel Voronoi algorithm and to be used as input for elastoplastic finite element analysis.
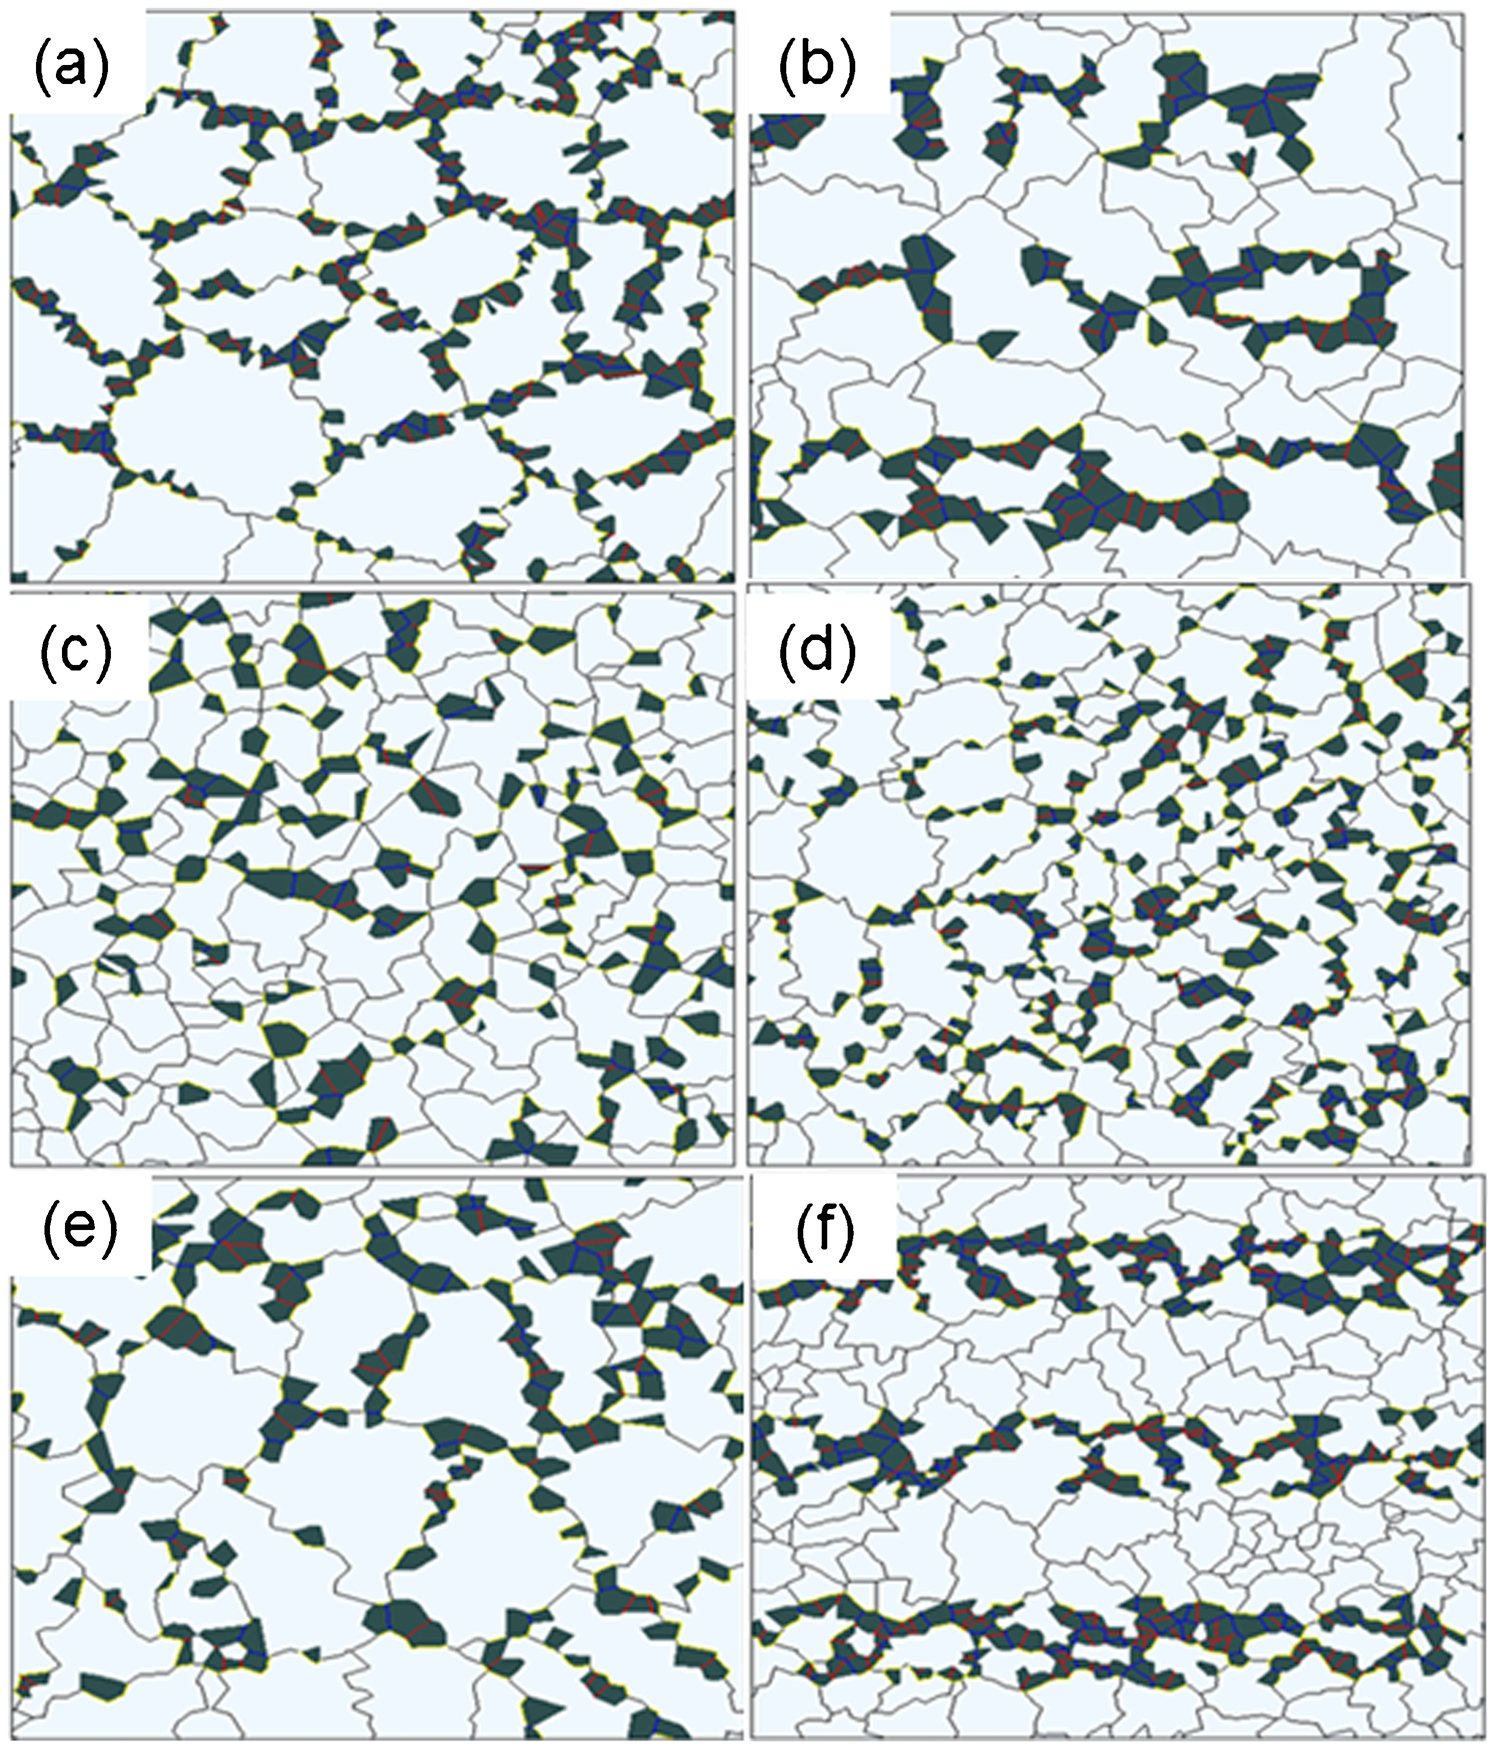
Microstructures of DP steel as obtained from multilevel Voronoi tessellation with a case A, b case B, c case C, d case D, e case E and f case F
Parameters involving microstructure generation through multilevel Voronoi tessellation (AM area fraction of martensite, NV number of Voronoi cells, Ng number of grains)
Elastoplastic finite element simulation
To elucidate the deformation behaviour of microstructure, the RVE is assumed to deform under generalised plane strain loading condition. The micromechanical model was analysed with finite element program ANSYS, with consideration of six node generalised linear strain triangle elements. In order to simulate the uniaxial loading condition, the boundary conditions were applied at extreme ends, where all the nodes of the right side of RVE are given the same displacement in the x direction and are allowed to move in the y direction, except the top node in the extreme left to avoid free body rotation. Both the phases of DP steel were modelled as isotropic continua, and the von Mises criterion has been employed to calculate the onset of the plastic deformation in each phase. Experimental stress–strain data are taken from the literature. 20 The properties of ferrite and martensite phase were taken equal to those of single phase steels. The selected elastic constants are as follows: Ef = 200 GPa, Em = 210 GPa, vf = vm = 0·3 (where Ef and Em represent elastic modulus of ferrite and martensite respectively, while vf and vm represent the Poisson's ratio). In addition, perfect bonding at the interface is assumed.
It may be seen in Fig. 5 that the martensite deforms insignificantly during the loading, while there is substantial deformation in ferrite, which varies with variation in the contiguity parameter. In case A (Fig. 5a), there is a presence of sporadic hotspots of the strain in the microstructure, but with increase in the FCP, further increase in the propensity of hotspots is clear (cases B, C and D), which are basically localised at the vicinity of the martensite–ferrite interface. The genesis of such hotspots may be understood in terms of inhomogeneity of strain distribution, which arise due to increasing contiguity of the weaker phase. 15
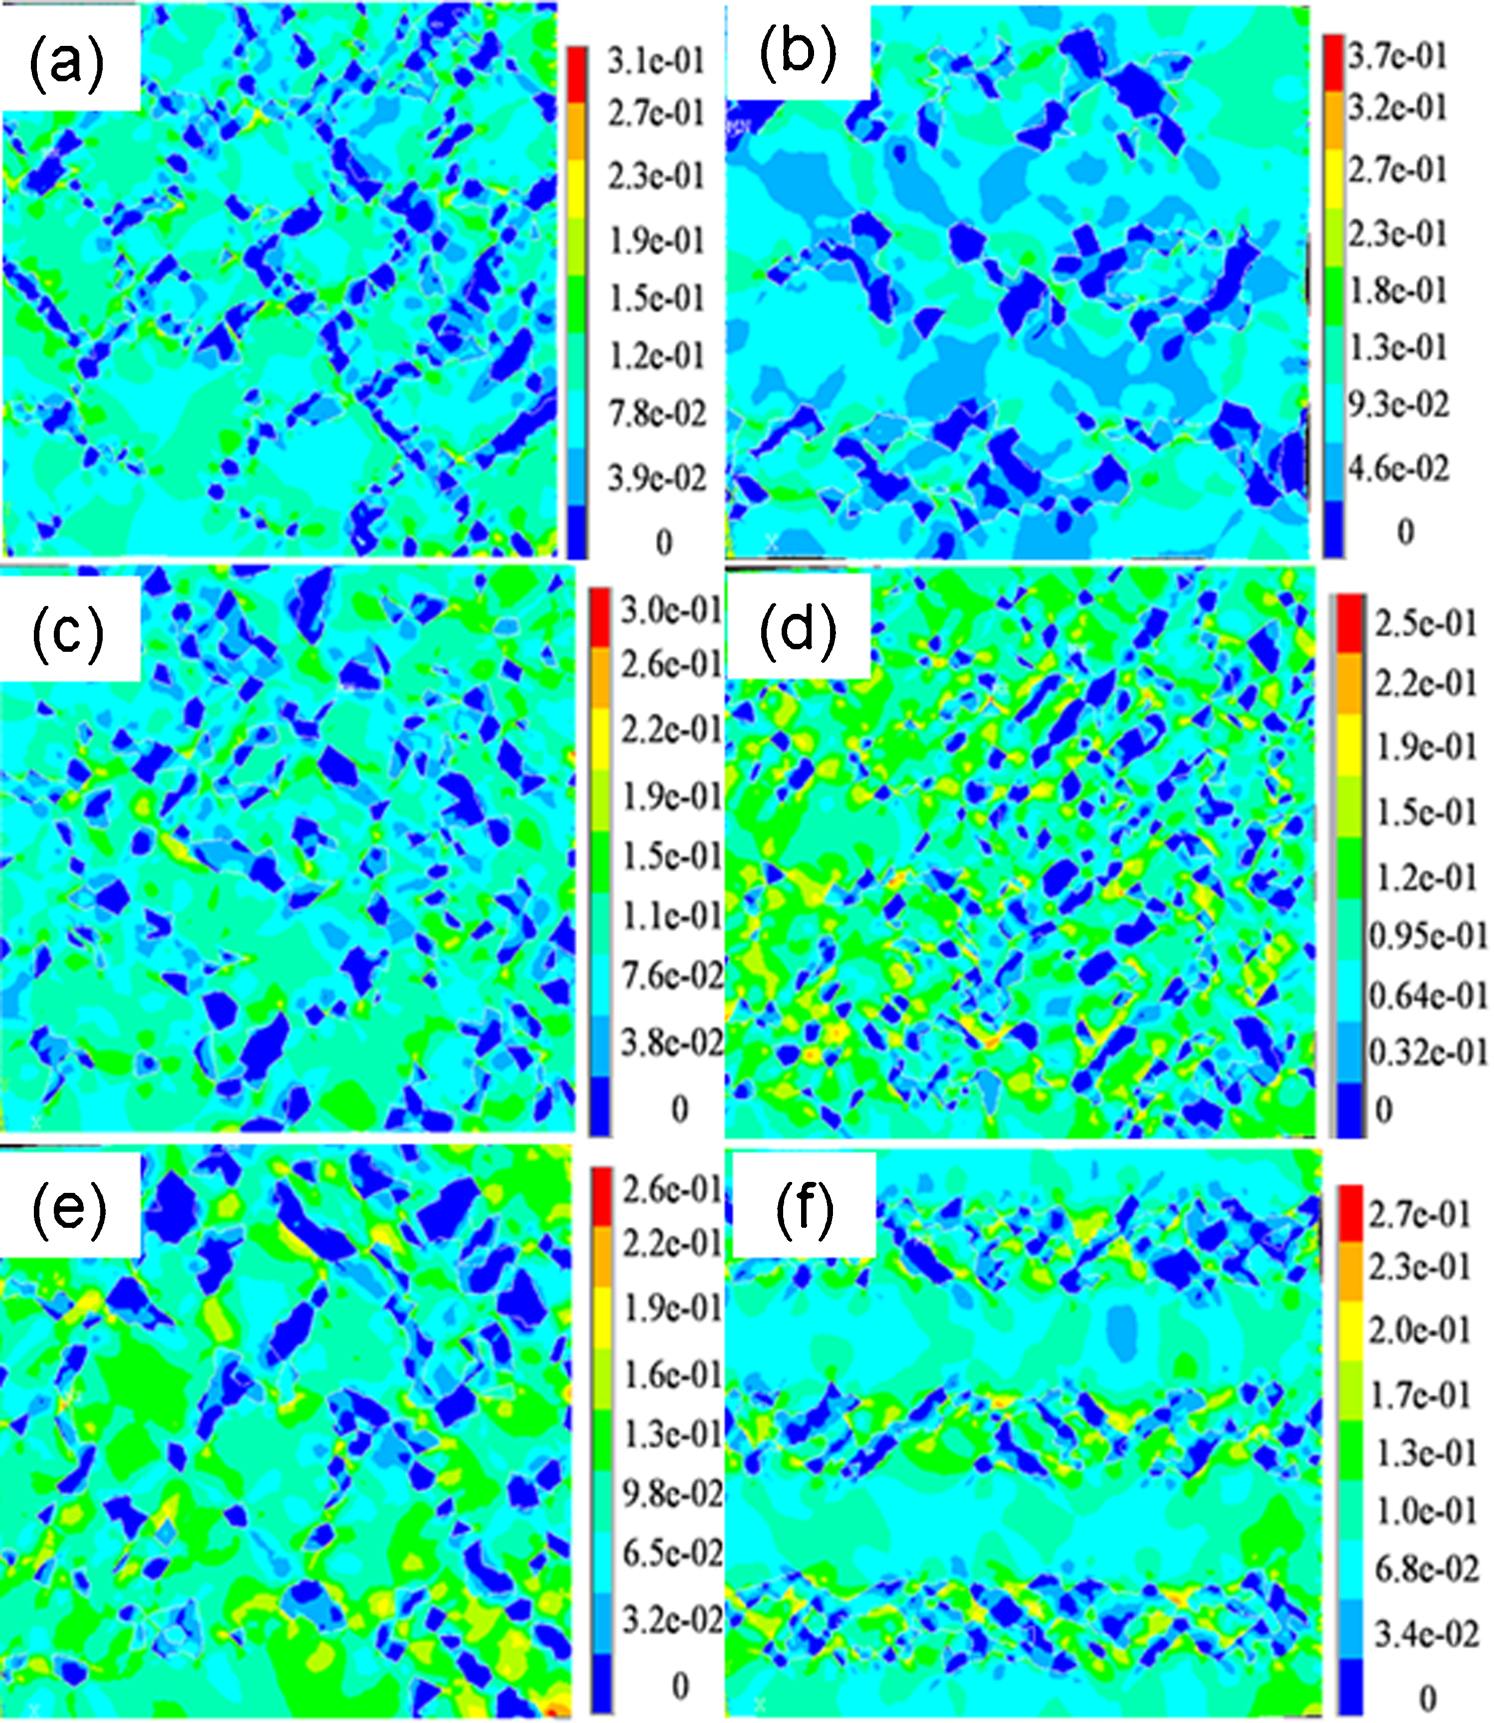
Equivalent plastic strain distribution in microstructures of a case A, b case B, c case C, d case D, e case E and f case F
Figure 6 represents the von Mises stress distribution in the microstructure of DP steel loaded under uniaxial condition. It is important to note that the stress hotspots lie at the martensite–martensite interface. In addition, it may be seen that there is clear link up between stress hotspots in cases C and D (Fig. 6c and d respectively). It is important to understand the evolution of the stress hotspots and their link up as this may be the precursor for the damage initiation leading to failure.
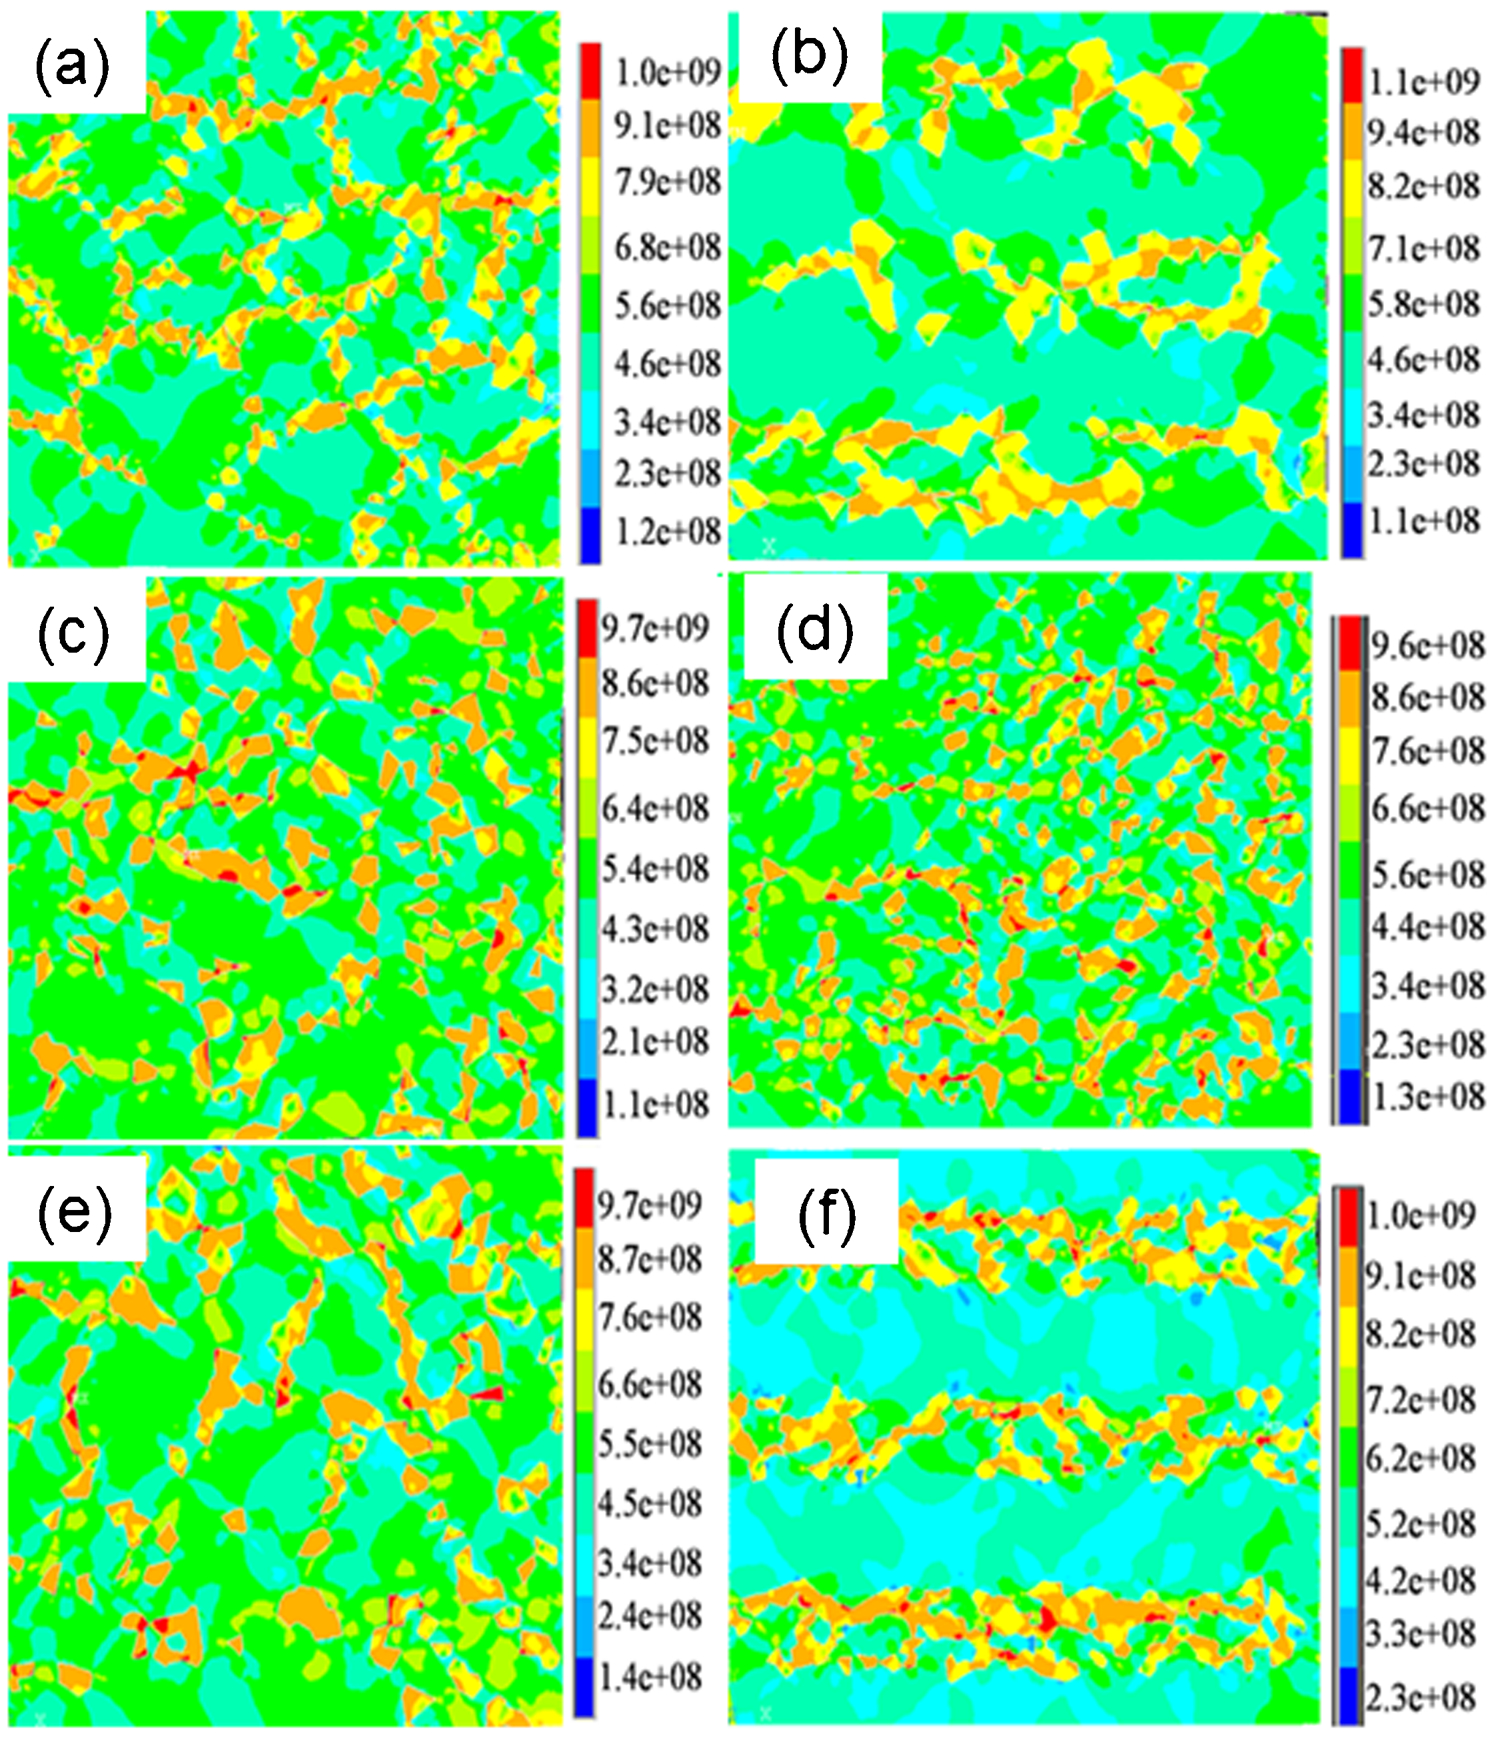
von Mises stress distribution in microstructure under uniaxial loading in microstructures of a case A, b case B, c case C, d case D, e case E and f case F
As it is evident from Figs. 5 and 6 that even with the systematic variation in the microgeometric parameters, there is no direct correlation between microstructure and instability (i.e. strain or stress hotspots). In addition, as we know, ductile failure in the DP steel may be predicted in the form of plastic strain localisation resulting from the incompatible deformation between the ferrite and martensite. 21 However, it is also important to note that martensite cracking due to stress concentration is also one of the key features, which may lead to the initiation of the instability in the microstructure.
Thus, in the next section, an attempt has been made keeping in view the effect of the contiguity parameters on the variation of the fraction area having the strain and stress hotspots in the structure.
Genetic programming
Genetic programming (GP) was introduced by Koza
22
some 20 years back. As a legitimate member of the family of evolutionary programs, GP is inspired by Darwin's theory of natural selection and has a great similarity to its predecessor genetic algorithm. However, GP has probably the most general approach among all evolutionary computation paradigms.
23
In GP, the evolving structures are hierarchically organised by mathematical expressions (generically called ‘computer programs’) whose size and form dynamically change during a process of simulated evolution. The computer programs are represented as tree-like structures. The sequence of evolution over generations occurs through the creation of child programs from the parental computer programs. Each individual is in fact a mathematical expression commonly expressed in the form of (x−y)/z+xz or x (1+yz) as shown in Fig. 1. They are constructed from the set of functions 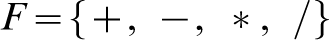 and the set of terminals T = {1, x, y, z} by taking into consideration the ‘arity’ of the functions: 2 (for binary) in each case here. It is also possible to include unary functions like sin, tanh, log, etc., in the function set F, and a subset of real numbers, say
  , in the terminal set T.
A population of individual solutions is initialised by creating a set of random computer programs through the combination of functions from the available set F with terminals from the available set T. Each program represents a random point (or trial solution) that at first blindly searches for the optimum solution in the huge space of possible solutions.
The search is eventually guided by the calculation of fitness of each computer program, which serves as a measure for selecting individuals (parents) based on the extent to which a solution achieves the target property. Better parents are selected, through probabilities proportional to their fitness, with an expectation that they would lead to better offsprings in the next generation. A computer program in GP evolves through several genetic operators in analogy from nature: reproduction, crossover and mutation. The reproduction operator is a kind of elitism for preserving the few best individuals (with the best fitness values) that are copied unchanged into the next generation. The crossover operator encourages constructive exchange of genetic material between computer programs by grafting branches from one parent onto the stem of the other, and vice versa. Figure 7 shows the crossover operation of two computer programs consisting of several function and terminal nodes. Mutation is the arbitrary (or guided) change of one node representing a function or a terminal.
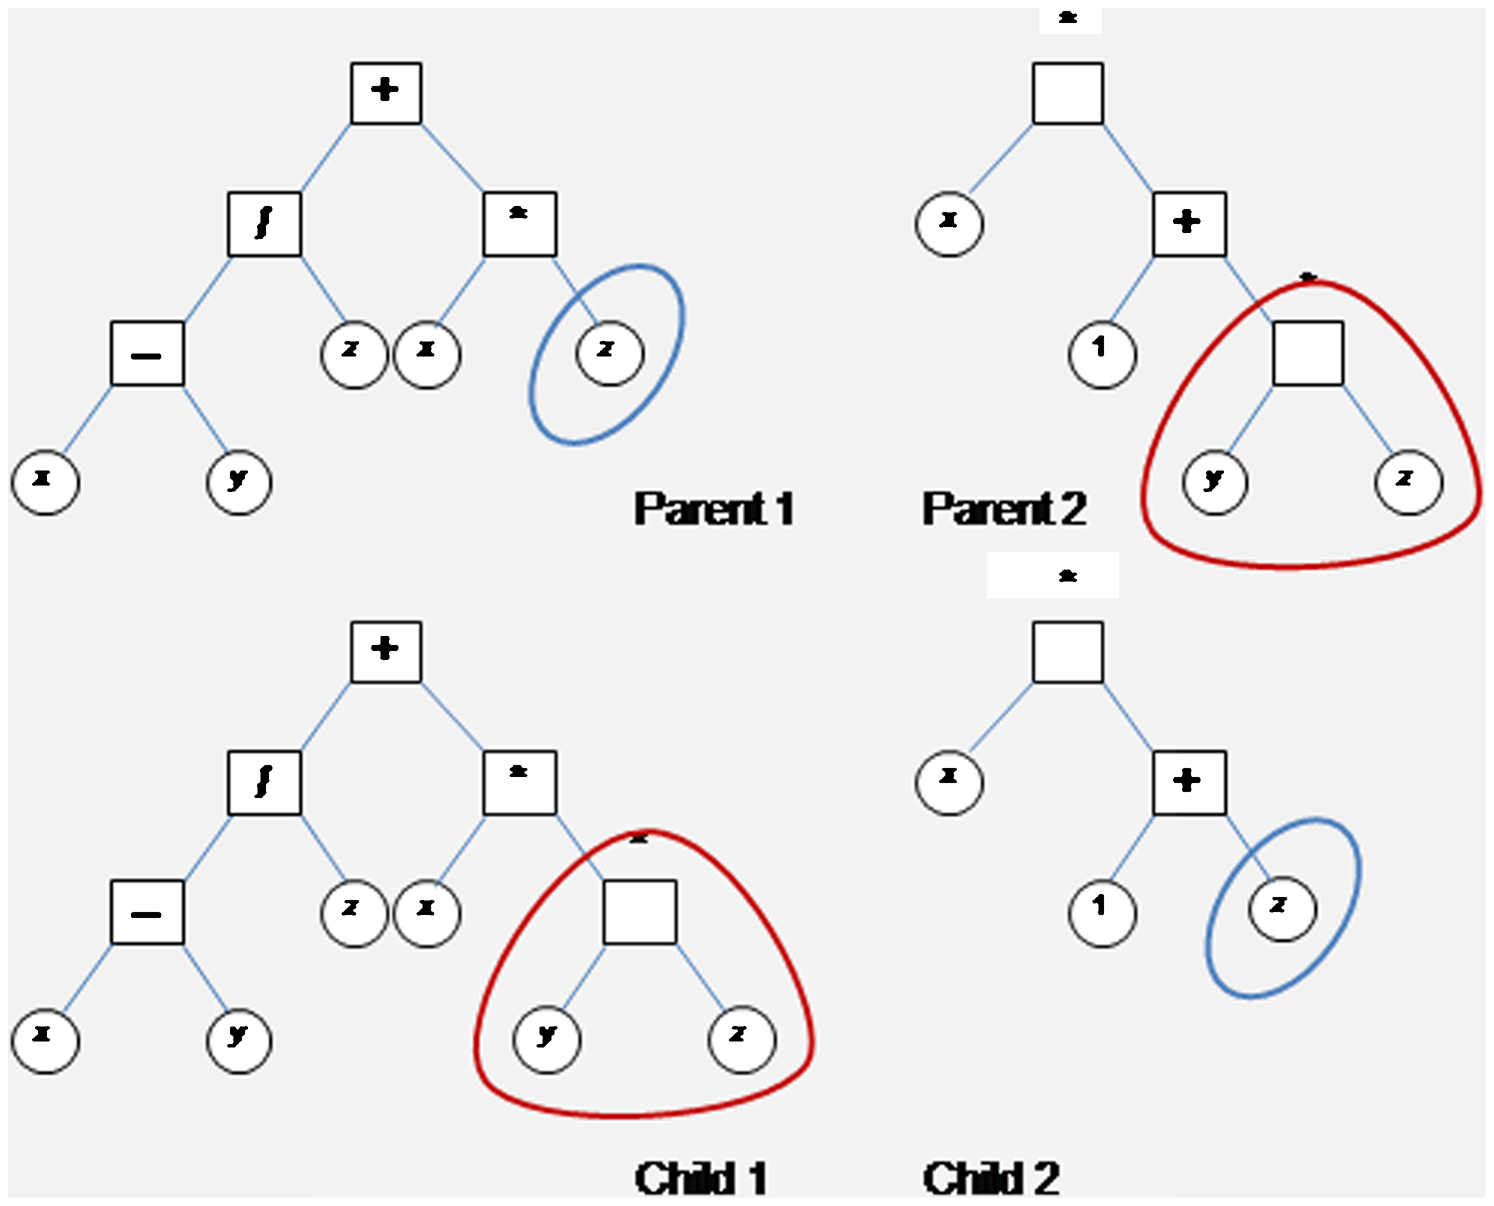
Crossover of two parent computer programs, forming two offsprings; parent 1 represents expression (x–y)/z+xz, and parent 2 represents expression x(1+yz), while their offsprings child 1 and child 2 respectively represent expressions (x–y)/yz+xz and x(1+z); operators are represented by rectangular nodes containing one element from set of function F, while constants or variables (terminals) are represented by circular nodes containing one element from set T
Finally, a termination criterion is a set that determines the point to which the evolutionary iterations are carried on. It is usually a fixed number of iterations, concluding which the best few solutions are printed along with their fitness values. A GP pseudo-code 23 is presented below:
t←0
initialize P(t)
evaluate fitness of P(t)
t←t+1
alter P(t) through genetic operators
evaluate fitness of P(t)
print best individuals from P(t)
Depending on the set of functions taken in F, and the construction of the fitness function, GP may be utilised to perform diverse functions, like optimising design parameters, discovering quantitative structure–attribute relationships, predicting the decision from a series of given inputs in an information system, selecting the most relevant variables or deriving rules in a complex data set. However, the most common task, which is undertaken in the present article, involves finding a non-linear mathematical relationship between the inputs (FCP and MCP) and output (per cent area under stress or strain hotspots). This is generically called the symbolic regression problem, which assumes no a priori form of the underlying relation. It is a generalisation of the linear regression problem, seeking to express the output as just the weighted sum of the inputs.
The present investigation has yielded the correlation between the FCP, MCP and fraction area having strain (x) and stress (y) hotspots. The relation may be represented as follows


Figure 8a and b represents the correlation between the predicted and actual fraction area having strain and stress hotspots respectively, and good correlation is evident.
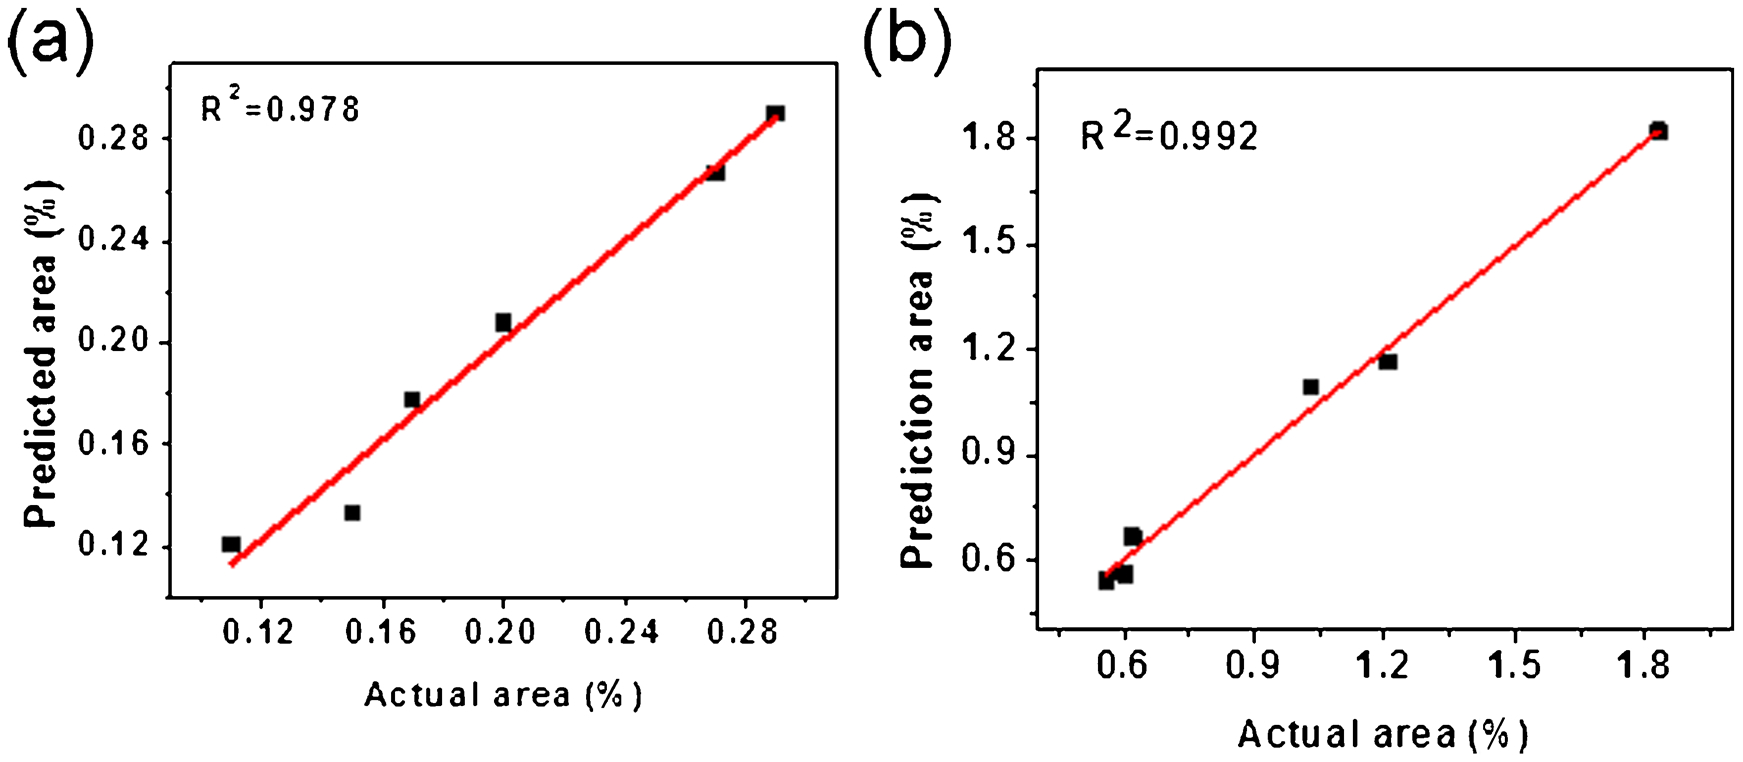
Correlation between predicted fraction areas as determined from GP and actual fraction area determined from micromechanical modelling for a strain and b stress hotspots
Conclusions
An approach for architecturing the microstructure has been proposed. A novel scheme of Voronoi tessellation has been developed by invoking the control over the morphology and distribution of the constituent phases in multiphase microstructures. Elastoplastic analyses have been conducted at the microstructural scale to identify the evolution of strain/stress during workhardening. The fraction areas concerning the stress and strain hotspots have been correlated with the contiguity parameters of the constituent phases in the microstructure by employing GP.
Footnotes