
Abstract
Objective:
The objective of this study was to assess the Doppler parameters, associated within the central retinal artery (CRA), based on a cohort of Nigerian participants.
Materials and Methods:
A total of 66 participants were recruited and consented at a medical clinic in Calabar, Nigeria, and presented from August 2019 to December 2023. The diagnostic data points recorded on this cohort were their fasting blood glucose (FBG) (mmol/L), CRA peak systolic velocity (PSV), CRA end-diastolic velocity (EDV), the resistive index (RI), and pulsatility index (PI). The data analysis was completed to provide descriptive information, as well as correlations. The statistical significance was set at P < .05.
Results:
In this cohort, the women demonstrated a higher PSV and EDV, based on the vascular flow within the right CRA (Rt. PSV [20.8 ± 6.0 SD] and Rt. EDV [5.8 ±2.1 SD]), as well as the left CRA (Lt. PSV [20. 6 ± 4.4 SD] and Lt. EDV [6.2 ± 2.0 SD]). This was compared to the men’s data taken on the vascular flow within the right CRA (Rt. PSV [19.6 ± 5.3 SD] and Rt. EDV [5.2 ± 1.8 SD]), as well as their left CRA (Lt. PSV [19.2± 4.7 SD] and Lt. EDV [5.3 ± 1.3 SD]). The participants’ FBG levels did not correlate with their respective Doppler parameters. The Doppler parameters, based on the flow within the right CRA, showed moderate to weak positive correlations compared with the left CRA. The PSV recorded in the right CRA was varied across the specific participant age groups of 17 to 25 and 26 to 34 years.
Conclusion:
Potential sex and age-related variations in the Doppler velocities, recorded within the CRA, were specific to this cohort, and the sample size may have compromised the overall study’s statistical power. A replication of this research is needed, and data from a larger cohort of participants are needed.
Globally, there are more than 2.2 billion visually impaired people, and diabetic retinopathy accounts for nearly 3.9 million of these cases, of which 2.8% are Nigerians.1,2 Retinopathy is a medical condition in which the retina is damaged, due to irregular blood flow in the central retinal artery (CRA).3,4 The flow pattern and velocimetry of the CRA serves as an informational model for diseases like hypertension and diabetes mellitus, which could cause vision loss and damage to the eye. The CRA is an early target of retinopathy, which can be caused by microaneurysms, hemorrhages, and neovascularization, with resulting alterations in Doppler velocities. 5 Although basically asymptomatic, in advanced stages, it can lead to visual impairment and ultimately cause blindness. 6 It is still unclear how retinopathy begins and progresses, despite extensive research. 7 Therefore, the assessment of Doppler velocity parameters, within the CRA, may serve as an early diagnostic indicator of advancing retinopathy.
Retinal oxygen metabolism, measured using an oximeter, may be a means to diagnose retinopathy. However, elevated oxygen saturation levels in both the retinal arterioles and venules can suggest a maldistribution and shunting of decreased oxygen, from the blood to tissue, and may limit this measurement, as a retinopathy biomarker. 8 In addition, fluorescein angiography has been used to assess retinal artery circulation. This invasive treatment involves dilation of the pupil and injection of contrast media into the antecubital vein. This diagnostic study allows for the circulation of contrast media through the eye, and the resulting images can be used to identify leaky or damaged capillaries. 9 The invasive nature of this diagnostic technique, during pupil dilatation, can be considered as a limitation for detecting a preclinical abnormality, as well as a biomarker for potential retinopathy. The diagnostic gold standard, within ocular imaging, is optical coherence tomography (OCT). Optical coherence tomography is a non-invasive diagnostic method that provides an in vivo cross-sectional picture of the retina. It operates on the same interferometry concept as sonography, with the exception that pressure waves are replaced with near-infrared light (e.g., 810 nm). The near-infrared light acts as the medium which reflects, as backscatter, to produce cross-sectional ocular images. Excellent contrast and resolution are produced with OCT; however, image quality can be severely compromised by motion, processing artifacts, and media opacities. 10 Furthermore, the quality of the images can be operator-dependent, due to the need for the OCT equipment operator to overlay the pathology, on serial images. 11
With very few contraindications, ocular sonography is one of the fastest and easily accessible diagnostic procedures for the non-invasive visualization of orbital structures and has great utility for imaging the eye, over a wide range of patients, with minimal complications. Ocular sonography is widely used to diagnose eye diseases because it is less expensive and does not require any special preparation before the procedure. It also produces high-resolution sonographic images that demonstrate the retinal vessels. In comparison to the previously described diagnostic techniques, ocular sonography provides a dynamic investigation, with superior spatial resolution that allows for a thorough examination of ocular structures.
Studies have shown that the CRA can manifest early signs of retinopathy, as well as implications for the pathophysiology of the vessel and ultimate damage to the eye, and this can be evidenced by alterations in the Doppler velocities.12,13 Unfortunately, the Doppler interrogation of the CRA has not received commensurate attention in global south locations and this research gap is worth further investigation. Therefore, the aim of this study was to bridge this gap by conducting a clinical study of CRA Doppler parameters, based on participants in the area of Calabar, Nigeria.
Materials and Methods
A prospective, cross-sectional research design was used and 66 participants were conveniently recruited to the study. These participants reported having no apparent ocular disease that could impact the Doppler interrogation of their CRA. All the participants provided a written consent, as part of the ethical approval obtained by the Ethics Committee of the Department of Radiography and Radiological Science, University of Calabar (Approval Number: UC/ECRA/21/012).
It was also important to utilize a Fine Test Type: blood glucose monitor to screen participants for possible diabetes mellitus. Measurement of fasting blood glucose (FBG) was completed with the participants having fasted for 12 hours. To obtain the participant’s blood sample, the lancing device, containing the lancet, was placed firmly against the participant’s thumb. With the cap rested on the thumb, the release button was then pressed to advance the lancet that pricked the finger and obtained the blood sample (technique based on the operator’s manual).
During the testing procedure, the test strip was firmly inserted into the meter’s port with the “inopia” facing toward the researcher. The meter automatically turned on the laying code, ambient temperature, date, and time. The fine test auto-coding premium automatically recognized the test strip code number and adjusted the meter accordingly. An indicator light automatically appeared at the top of the screen, which signaled that the meter was ready for testing. The test strip was then placed on the area of the thumb. A sample of blood was then automatically blotted on the test strip channel. When the channel had enough blood, the meter automatically timed out at 9 seconds. The FBG level was then displayed in millimoles per liter (mmol/L). The glucose levels were then subdivided into four groups: group 1—low (>5 mmol/L), group 2—normal (5–5.4 mmol/L), group 3—prediabetic (5.5–6.9 mmol/L), and group 4—diabetic (<7 mmol/L).
The ocular sonograms were conducted using a Mindray (Shenzhen, China) ultrasound equipment system with a 7 to 14 MHz linear-array transducer. The procedure was carried out with the patient lying supine, eyes closed, and gaze directed upward. Coupling gel was applied on a closed eyelid, to minimize the exertion of pressure on the eye. The examiner rested the hand on the bridge of the nose, in order to stabilize the transducer. A bilateral grayscale sonogram was completed with the linear transducer, to detect any gross orbital abnormality. The optic nerve which was seen as a hypoechoic band extending, posterior to the vitreous humor, in the midline was used as an imaging landmark, and helped to locate the CRA (See Figure 1). The CRA was seen as the retrolaminar portion of the optic nerve, approximately 25 mm in this region, while the vessel maintained a straight course. To obtain a spectral Doppler waveform, an angle correction was readily applied, with the Doppler cursor placed at less than 60 degrees. To obtain the flow velocity, the color Doppler was engaged and orienting the flow toward the transducer as red and flow away from the transducer as blue. The Doppler sampling volume was adjusted to 1 mm prior to interrogation (See Figure 2). The peak systolic velocity (PSV) and end-diastolic velocity (EDV) were obtained by tracing the maximum frequency envelope of the Doppler waveform, over two complete cardiac cycles (See Figure 3). The resistive index (RI) and pulsatility index (PI) were recorded automatically from the ultrasound equipment system. Each participant’s eyes were imaged twice, and the reading obtained was the average of the two examinations.
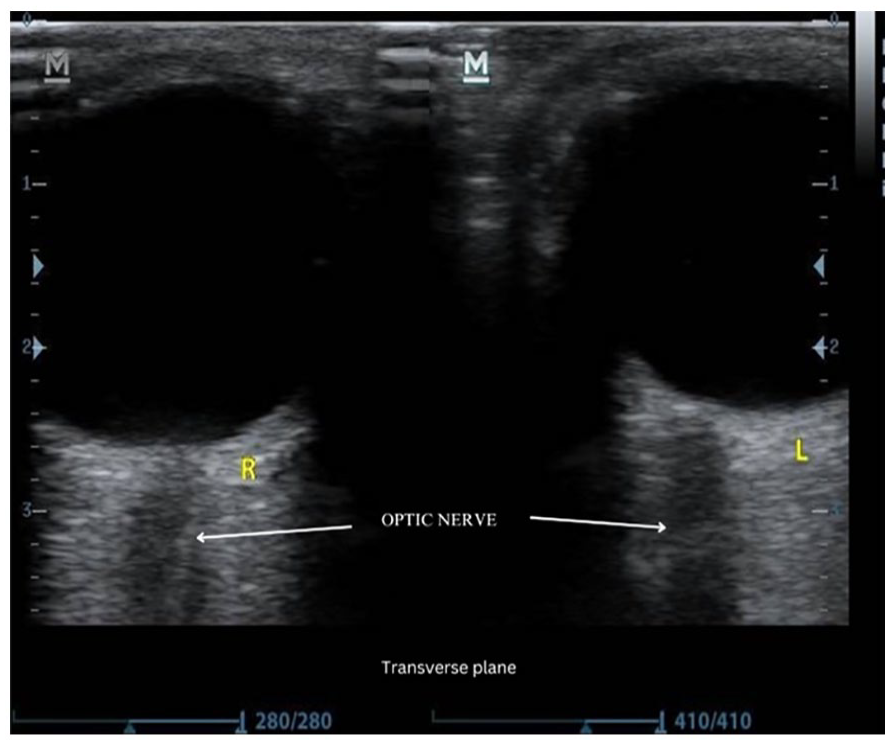
An example grayscale ocular sonogram of a participant’s bilateral eyes, in the transverse/axial scan plane. The optic nerve is indicated as the hypoechoic area, denoted with white arrows.
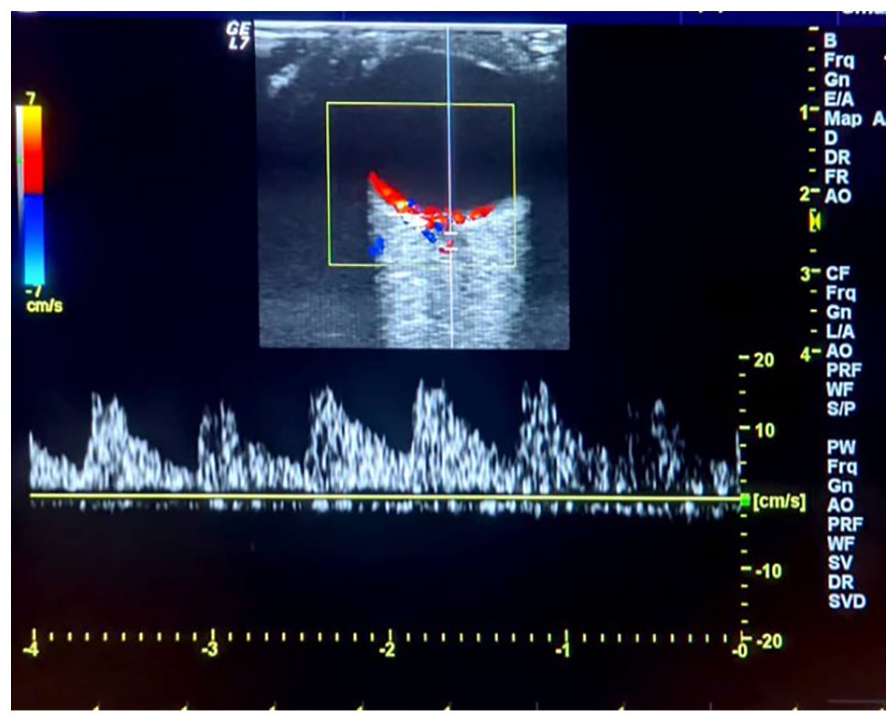
An example triplex Doppler image of the right eye, taken in the transverse/axial scan plane. The spectral tracing demonstrates a typical normal Doppler waveform, specific to the central retinal artery.
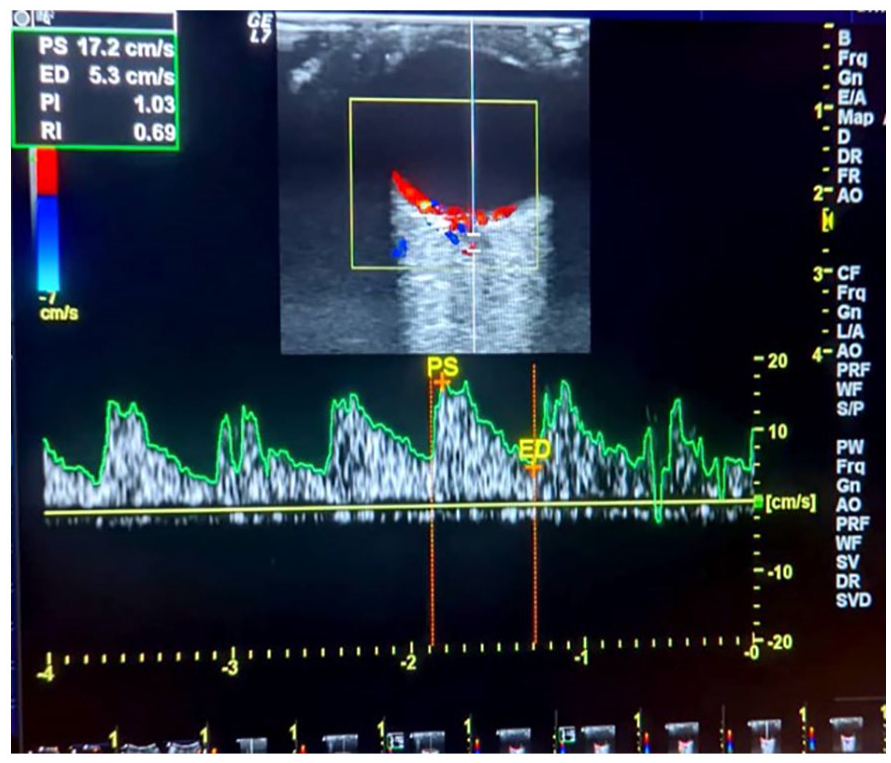
An example triplex Doppler image of the right eye, taken in the transverse/axial scan plane. The autotrace function is activated and illustrates how the peak systolic and end diastolic endpoints were located on this specific Doppler waveform, generated at the central retinal artery.
In accordance with the American Institute of Ultrasound in Medicine guidelines, 14 specific to ophthalmic examinations, provided a clinical guideline for setting a thermal index (TI) of ≤1.0 and a mechanical index (MI) of ≤0.23. To minimize the risk of bioeffects for the participants, the ultrasound equipment’s output power setting was set at a MI of 0.1 and a TI of 0.2. The transducer’s transmit frequency was also adjusted to 7.5 MHz to limit further exposure to the eye.
Statistical Analysis
The study data were analyzed using the statistical package for social sciences (SPSS, Inc., Chicago, Illinois, version 25.0). The participant’s descriptive data were provided in frequencies, means, and standard deviations (SDs). An independent t-test was used to compare the Doppler velocity endpoints to sex classification. A Pearson correlation was used to determine the strength of association between the ocular Doppler endpoints recorded bilaterally. The analysis of variance (ANOVA) was used to compare Doppler endpoints with the FBG levels, as well as compare Doppler parameters across participant age categories. The level of statistical significance was set a priori at P < .05.
Results
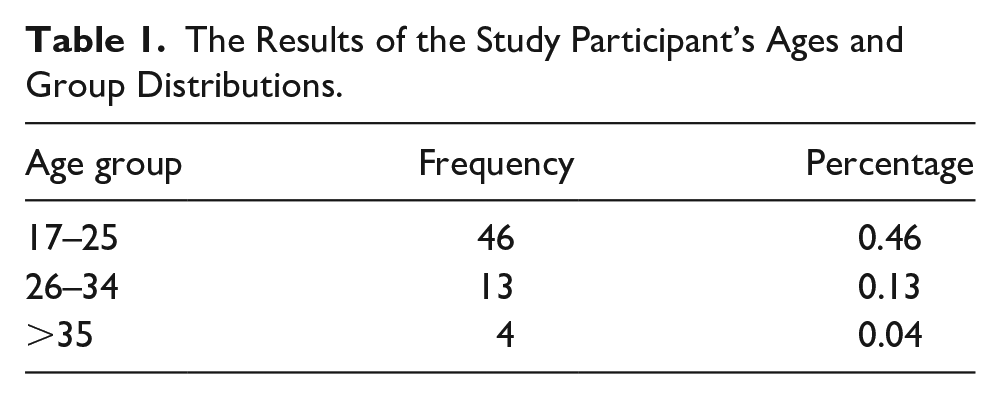
This study evaluated the Doppler parameters (PSV, EDV, RI, and PI) in a cohort of 22 women and 44 men (Figure 4). The participant’s ages ranged from 17 to 34 years, with a mean age of 24.12 ± 4.28 years SD (See Table 1). The results of the FBG analysis demonstrated that 9 subjects had a low levels (>5 mmol/L), 39 subjects had normal levels (5–5.4 mmol/L), 11 were at prediabetic levels (5.5–6.94 mmol/L), and 7 were classified as diabetics (<7 mmol/L) (See Figure 5). In Table 2, the descriptive statistics are provided by sex and Doppler velocity, in the CRA. In this cohort, the women’s mean flow velocities within the right CRA were a PSV 20.8 ± 6.0 SD and an EDV 5.8 ± 2.1 SD. The women’s mean flow velocities within the left CRA were a PSV 20.6 ± 4.4 SD and EDV 6.2 ± 2.0 SD, which were higher compared with the men, in this cohort. The men’s mean flow velocities in right CRA were a PSV 19.6 ± 5.3 SD and an EDV 5.2 ± 1.8 SD. Their mean flow velocities in the left CRA were a PSV of 19.2 ± 4.7 SD and an EDV 5.3 ± 1.3 SD. There was no significant correlation between FBG levels and the Doppler parameters (See Table 3). At a statistical significance of P < .05, the strength of association between PSV (r = 0.592) and RI (r = 0.475) showed a moderate positive correlation, based on both CRA flow velocities, while a low-to-weak positive correlation was noted in EDV (r = 0.258) and PI (r = 0.269) of the right and left CRA (See Table 4). There was a significant variation (P = .03) in the mean PSV of the right CRA, between the age groups (See Table 5). A post hoc analysis, with a Bonferroni correction, indicated that the variation was significant between age groups 17 to 25 and 26 to 34 years.
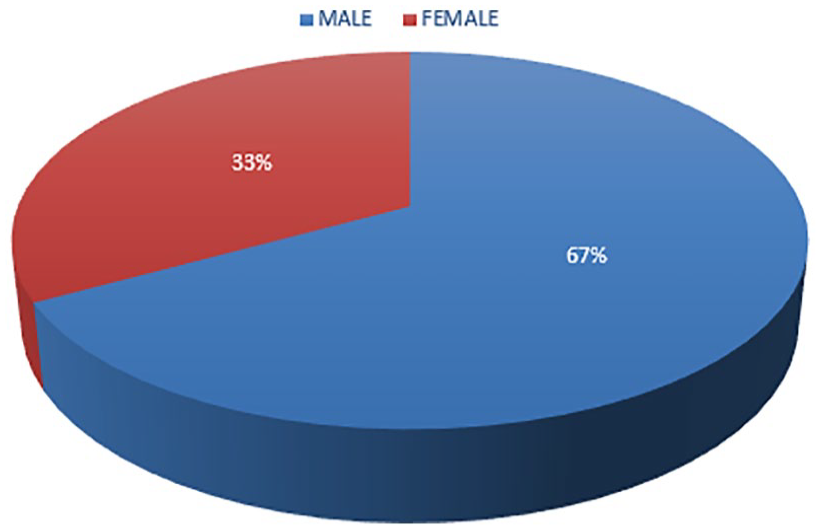
A pie graph that provides the sex classification of the study participants.
The Results of the Study Participant’s Ages and Group Distributions.
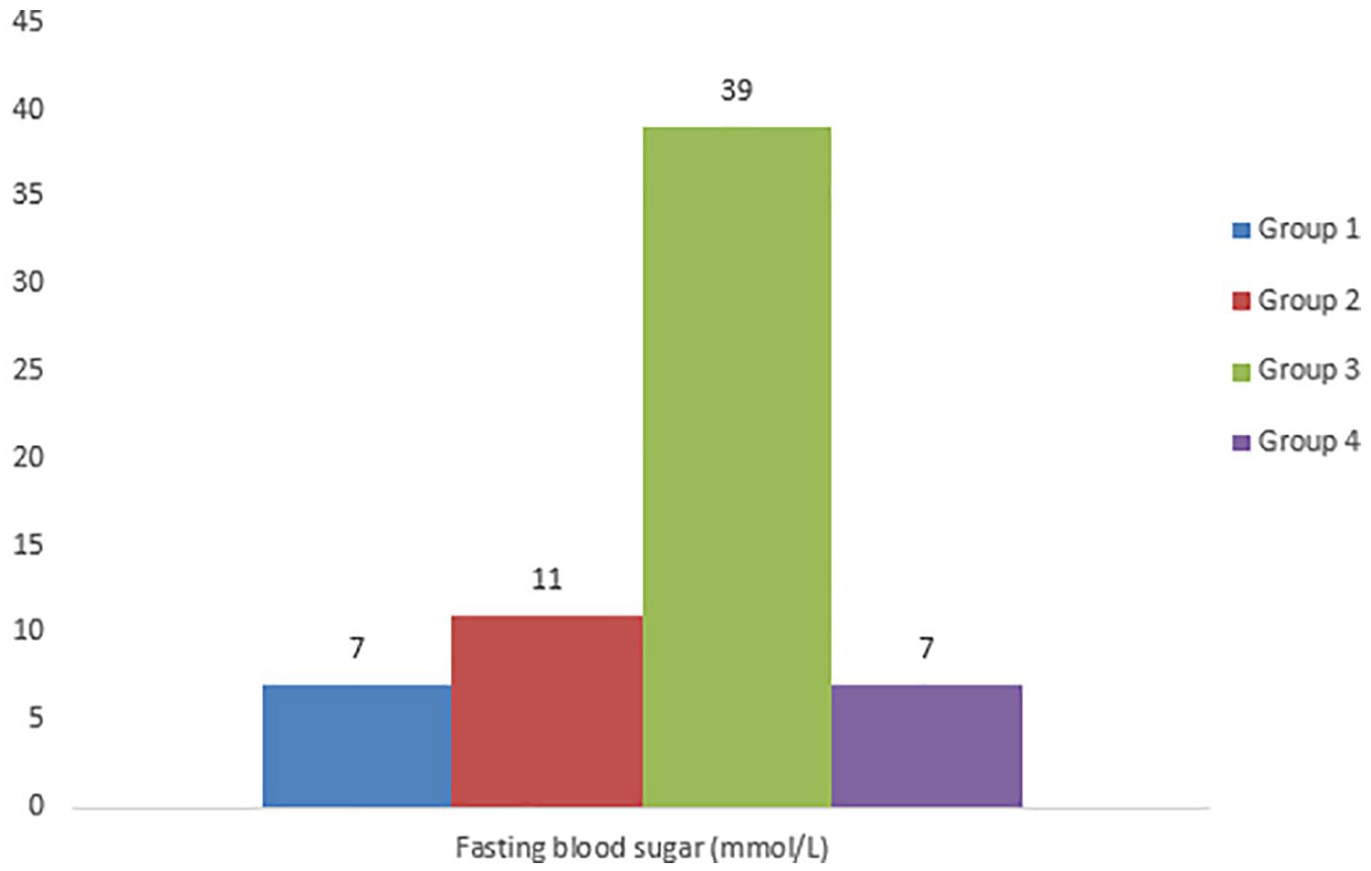
A bar graph is provided that indicates the participants’ fasting blood glucose level classifications. Group 1—low, group 2—normal, group 3—prediabetic, and group 4—diabetic.
The Results of the Study Participant’s Sex and Doppler Parameters Taken in the Central Retinal Artery (Right—Rt and Left—Lt).
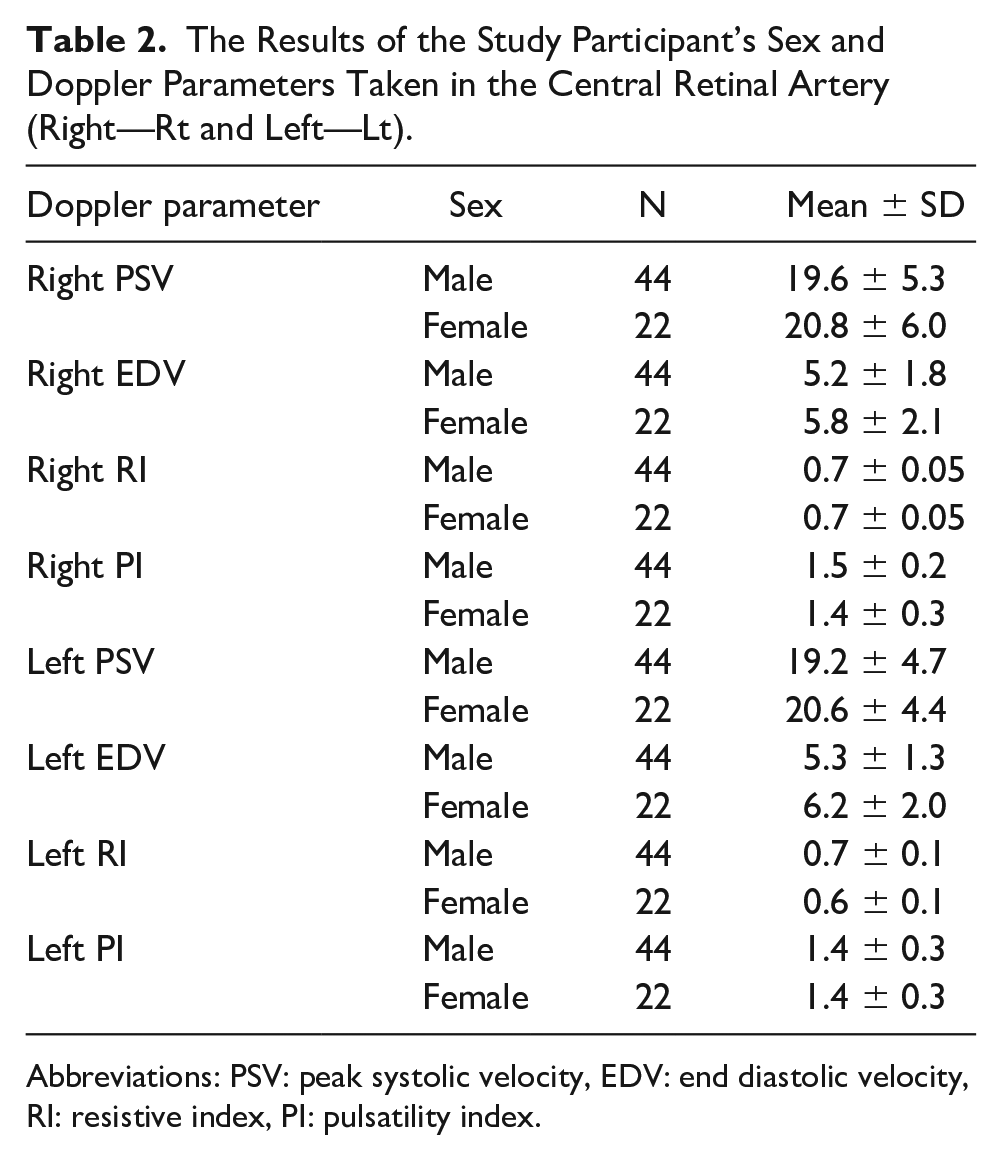
Abbreviations: PSV: peak systolic velocity, EDV: end diastolic velocity, RI: resistive index, PI: pulsatility index.
A Test of Association Between Fasting Blood Sugar (FBS) Levels and the Doppler Endpoints Taken in the Right and Left Central Retinal Arteries.

Note: Given the P-level of < .05, no significance was achieved and a low strength of association (correlations 0.1–0.3 low to no association) was noted between FBS and Doppler parameters.
A Test of Association Between the Cohort’s Doppler Parameters Taken in the Right (Rt.) and Left (Lt.) Central Retinal Arteries.
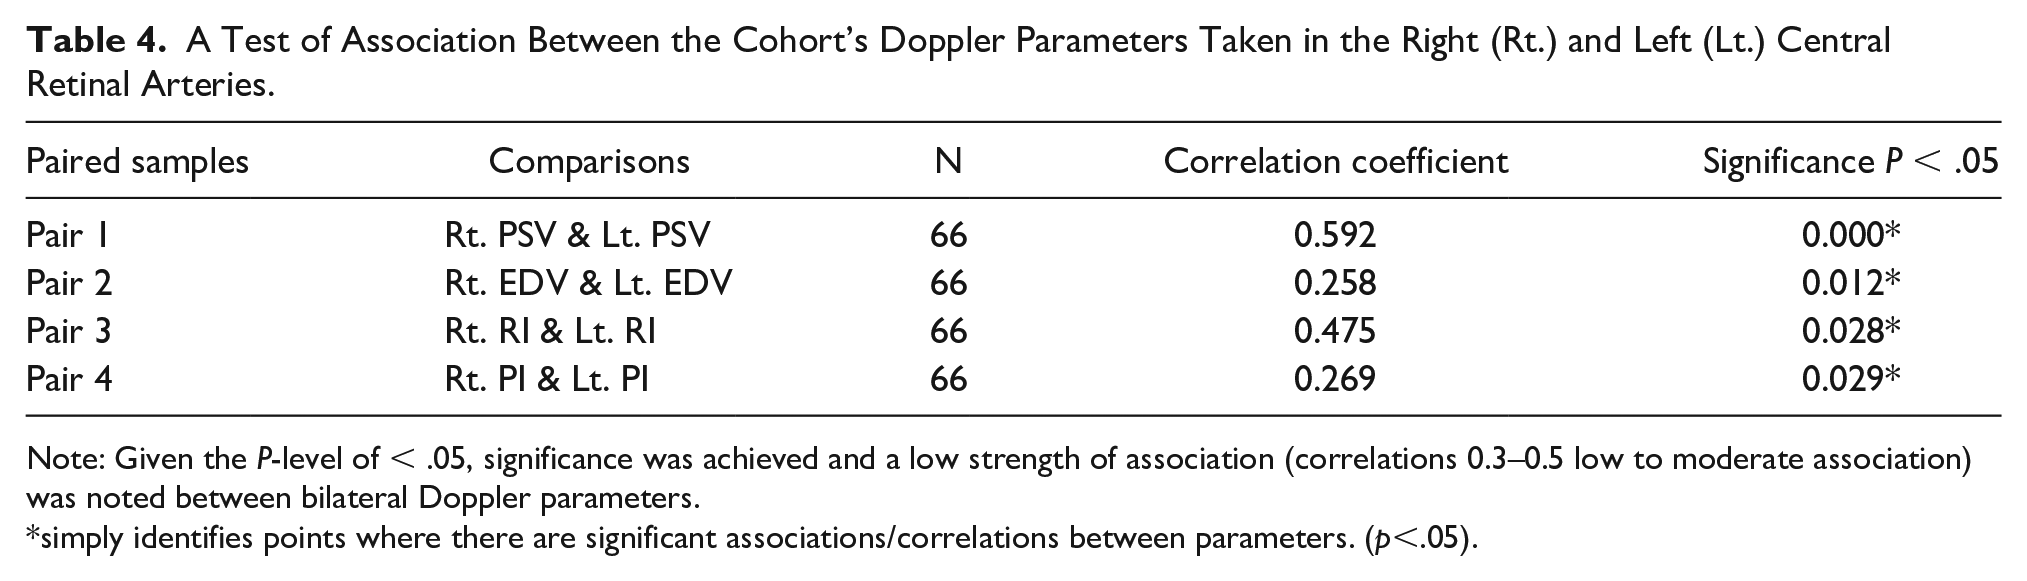
Note: Given the P-level of < .05, significance was achieved and a low strength of association (correlations 0.3–0.5 low to moderate association) was noted between bilateral Doppler parameters.
simply identifies points where there are significant associations/correlations between parameters. (p<.05).
An Analysis of Variance Between Participants’ Age Categories and the Doppler Parameters Taken in the Right (Rt.) and Left (Lt.) Central Retinal Arteries.
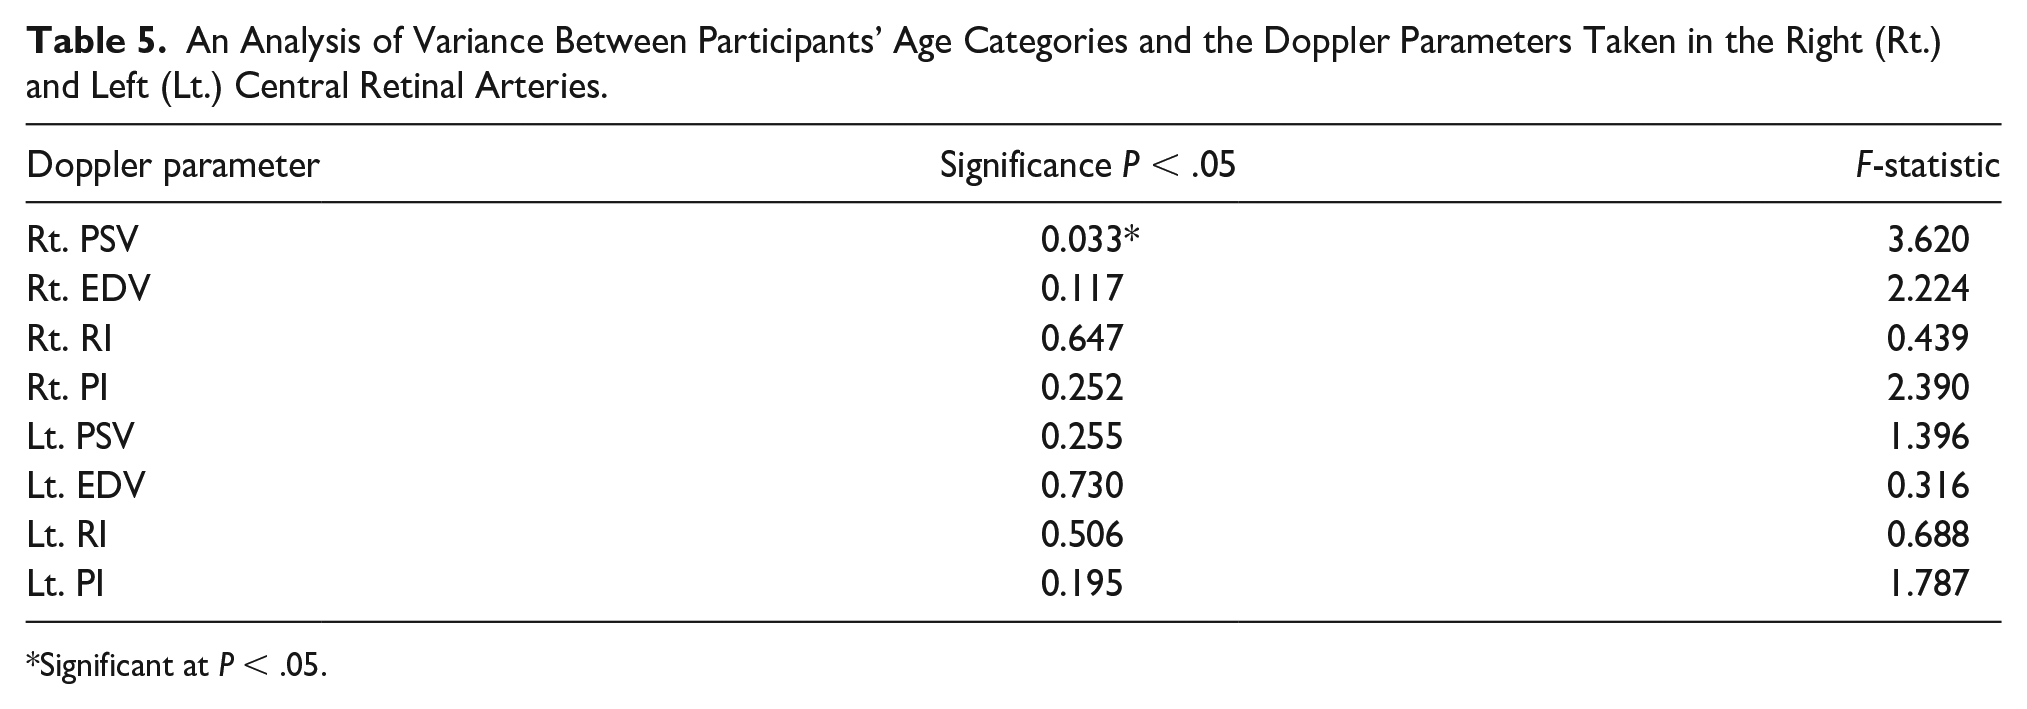
Significant at P < .05.
Discussion
Alterations in the hemodynamic parameters, within the CRA, are greatly attributed to the altered metabolism resulting from systemic and vascular disorders.15,16 Therefore, this cohort study assessed the Doppler parameters measured with the CRA, of those participants (N = 66) cohort, residing in Calabar, Nigeria.
Table 2 provided a description of the CRA Doppler endpoints, measured the cohorts men and women. Interestingly, the women participants demonstrated a significant difference (P < .05) in CRA Doppler parameters compared with the men, as well as having higher mean PSV and EDV values. Higher estrogen levels within the female participants could be a contributing factor since estrogen increases vascular endothelial function and could affect the CRA’s vascular dynamics. Estrogen is known to produce nitric oxide, a powerful vasodilator that relaxes vascular muscle walls and increases vessel diameter. This vasodilatory effect can lead to greater blood flow, which can result in higher recorded PSV and EDV flow measurements.17,18 Furthermore, estrogen is essential for maintaining the integrity of vascular walls. It also gives the vessels antioxidant and anti-inflammatory qualities, which protect endothelial cells and maintain the vessel’s structure and function.19,20 These results will need more investigation with a larger cohort of participants, given that this cohort only contained 22 women.
To assess potential correlations between FBG levels and Doppler parameters, the FBG results allowed for dividing the cohort into four groups (1–4). The results of the testing (See Figure 5) showed that first group had nine participants with a low mean FBG level (>5 mmol/L), the second group had 39 participants with a normal mean FBG level (5.0–5.4 mmol/L), a third group with 11 participants deemed to have a mean pre-diabetic level (5.5–6.9 mmol/L), and the final group had seven participants with mean FBG levels that equated with diabetes (<7 mmol/L). A study completed with diabetic Nigerian patients, from the southwest, 21 demonstrated a higher RI and PI within their intrarenal vessels. This did not translate to those participants in this study, who showed no significant correlation between FBG levels and the Doppler measurements within their CRA. This may suggest that Doppler flow measurements, within the CRA, may not be directly influenced by FBG levels, based on the present cohort. This may be the result of intricate compensating and autoregulatory processes the human body uses, including modifications to vascular tone, to maintain normal CRA hemodynamics, regardless of fluctuations in FBG levels. This study’s results must be carefully considered given that the participants’ FBG levels were taken once, and that only gives a glimpse into the cohort’s glucose state at that moment in time. There is also merit in investigating chronic variations in FBG levels within a larger population, to better understand what types of long-term vascular adaptations that can occur. 22 Expanding this study to recruit a larger diabetic participant sample offers a stronger basis for making assertions on the long-term effects on the vascular flow, within the CRA. This is emphasized by reviewing the reported pathological variations, in the hemodynamics of the ophthalmic artery, that were recorded in a larger cohort (N = 41) of patients with diabetes and hypertension. 23
In this study, Table 4 showed a moderately positive correlation between the PSV (r = 0.592) and RI (r = 0.475) of the right and the left CRA, while a weak positive correlation was noted in EDV (r = 0.258) and PI (r = 0.269) of the right and the left CRA. This is a comparable study result that also showed a positive correlation of Doppler indices within the right and left CRA, among a cohort of women with pre-eclampsia. 24 This underscores the fact that a certain level of symmetry may exist between Doppler parameters recorded bilaterally and is vital in the development of diagnostic baseline values, as well as individual differences in CRA vascular flow.
Furthermore, this study found a significant difference in the mean PSV with the right CRA between the two age groups 17 to 25 years and 26 to 34 years (P < .05), after a Bonferroni correction (See Table 6). Studies have shown that the aging process can impact vascular flow dynamics, due to the natural processes of arterial stiffening and reduced arterial compliance.25,26 Stiffer arteries can have different pressure wave reflections and a reduced capacity to adapt to changes in blood volume, which can affect blood flow velocity. Also, endothelial function declines due to oxidative stress and reduced nitric oxide, which occurs with aging, as well as affecting blood flow regulation and potentially the PSV. 27 Therefore, further research with older age groups may be required to further explore this hypothesis.
A Post Hoc Analysis With a Bonferroni Correction to Examine Differences in the Cohort’s Age Categories.
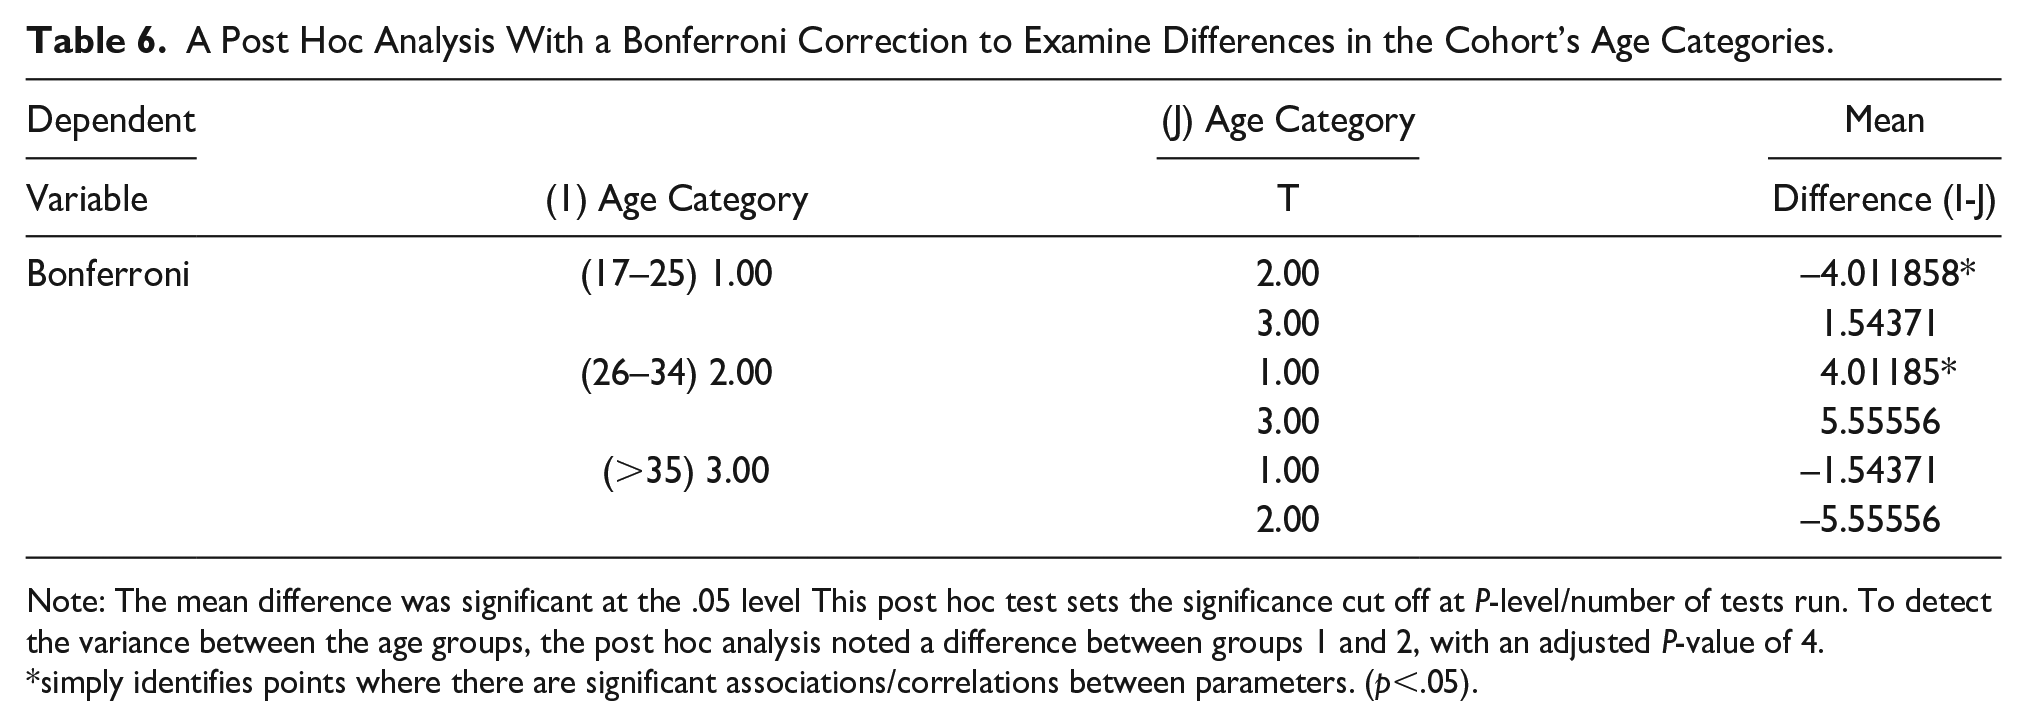
Note: The mean difference was significant at the .05 level This post hoc test sets the significance cut off at P-level/number of tests run. To detect the variance between the age groups, the post hoc analysis noted a difference between groups 1 and 2, with an adjusted P-value of 4.
simply identifies points where there are significant associations/correlations between parameters. (p<.05).
Limitations
The major limitation of this study is the research design, which is pre-experimental and has threats to internal and external validity. In addition, the conveniently small sample of participants further limits the generalizability of this work. Certainly, a challenge was the relatively small number of Doppler samples collected and the limited subsets of participants, particularly in terms of women and diabetic participants. The very limited number of women and diabetics may have skewed the results and ultimately may have affected the statistical power of the data analysis. As a result, it is important to exercise caution when interpreting these research findings. A strength of this work is the inclusion of a diverse cohort of participants by sex and race, which is not always reflected in this line of inquiry. Overall, to improve the external validity of findings, a detailed research design and a larger diverse cohort of participants is needed to further this specific area of research.
Conclusion
The data from this small cohort of diverse participants may suggest that Doppler parameters, taken within the CRA, may exhibit sex and age-related variations. In addition, the participants’ FBG levels did not appear to correlate with their respective Doppler parameters. To further this important line of clinical inquiry, it will be important to increase the participant sample size and the overall statistical power, to detect subgroup differences. Therefore, continued research into the clinical significance of using Doppler to assess vascular changes in the flow, within the CRA, holds continued diagnostic importance.
Footnotes
Acknowledgements
The authors wish to acknowledge Gijuwie Medical Diagnostics, Calabar, for providing the facilities used in this study.
Ethics Approval
Ethical approval for this study was obtained from the Department of Radiography and Radiological Science, University of Calabar, Calabar (Approval Number: UC/ECRA/21/012).
Informed Consent
Written informed consent was obtained from all subjects before the study.
Animal Welfare
Guidelines for humane animal treatment did not apply to the present study because no animals were used during the study.
Trial Registration
Not applicable.
Declaration of Conflicting Interests
The authors declared no potential conflicts of interest with respect to the research, authorship, and/or publication of this article.
Funding
The authors received no financial support for the research, authorship, and/or publication of this article.