
Abstract
Objective:
Dual x-ray absorptiometry (DXA) is gold standard of bone densitometry, but quantitative ultrasound (QUS) of bone is less expensive and portable. This study was designed to assess its usefulness in secondary osteoporosis diagnosis.
Materials and Methods:
There were 200 secondary osteoporosis cases (rheumatoid arthritis, hemodialysis, kidney transplant patients, and levothyroxine users) and of those, their phalanx QUS results were compared with normal controls. Also, the QUS and DXA results were compared to find any correlation of these methods for diagnosing osteoporosis.
Results:
There was not significantly different results compared with normal controls, except for those of hemodialysis patients (P = .00). Also, the comparison of QUS with DXA results showed no significant correlation except in hemodialysis patients, in both spinal and femoral regions (P = .023 and .21, respectively), as well as the levothyroxine group’s spinal region (P = .005).
Conclusion:
These results suggest that QUS of phalanx may be useful in screening secondary osteoporosis but for establishment of diagnosis, DXA measurements are still needed.
Keywords
The word osteoporosis has a Greek origin and means “the bone becomes more porous.” It is composed of two parts, osteon for bone and poros for porosity. 1
Osteoporosis is the most common metabolic type of bone disorder. It presents with bone loss, bone damage, impairment of the microstructure, and an increased risk of fracture. The disease is referred to as the “silent thief,” because on many occasions, it is diagnosed only when a person falls and experiences a fracture, without prior warning.2–4 The 1-year mortality rate of osteoporotic hip fracture is near to 26.98%; however, only 48.23% of cases return to their pre-fracture state. 5 There are two types of osteoporosis, primary and secondary. In the secondary type, a background disease or therapy is believed to cause osteoporosis. Dual energy x-ray absorptiometry (DXA) is the gold standard for gauging bone density and is used to determine osteoporosis, as well as a fracture prediction, and it identifies patients in need of treatment and surveillance.1,6 The World Health Organization (WHO) criterion for the diagnosis of osteoporosis is a reduction of bone mineral density (BMD) by 2.5 standard deviations (SDs) or more compared with the peak bone mass, taking into account sex and ethnicity.2,4 This criterion is commonly applied to BMD measurements at the spine, hip, and forearm.2,4,7–9 But DXA has its limitations such as being not widely available, lacks portability, can be expensive, and uses ionizing radiation.
There are other methods for bone densitometry like quantitative computed tomography (QCT; see Figure 1) or magnetic resonance imaging (MRI). But the quantitative ultrasound (QUS) method is portable, uses non-ionizing radiation, and is less expensive. It was introduced as a technique to gauge bone densitometry, based on the characteristics of ultrasound, which provides more diagnostic information, as well as BMD.10–12 Practically, it measures speed of sound (SOS) and in some methods, broadband ultrasound attenuation (BUA). The BUA correlates with trabecular orientation, diffraction, scattering, and absorption of bone. The associated soft tissue at skeletal sites also can be evaluated. 13 Reports show SOS is dependent on the elasticity of trabecular bones. 14 Elasticity correlates with the size and composition of mineral crystals, the cross-linking of collagen, and anisotropy. 15 Volumetric BMD and microstructure or geometric properties are also diagnostic characteristics that QUS can measure. 16
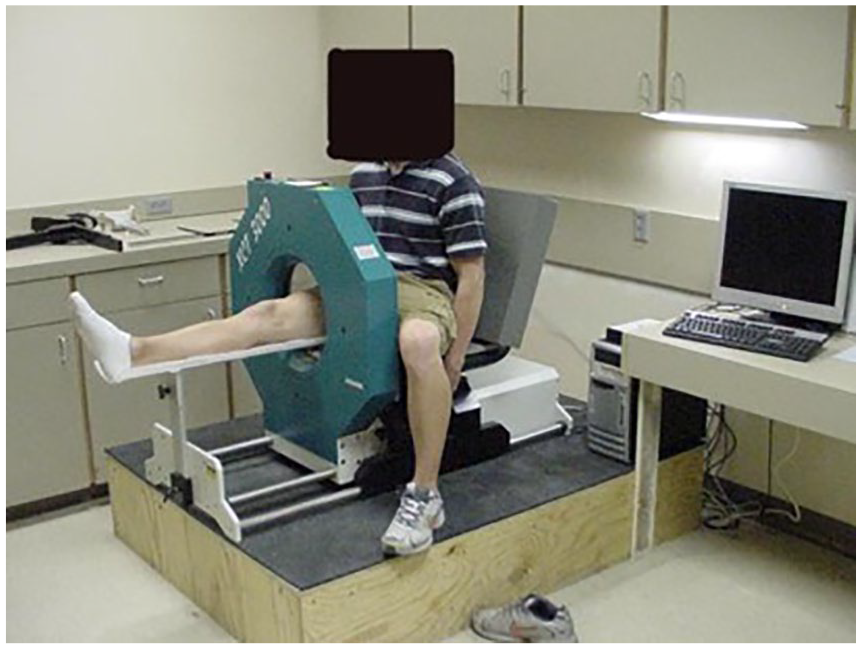
An example of a quantitative computed tomography machine used to assess bone density.
Many reports suggest that QUS can predict osteoporotic fractures12,17,18 and can distinguish between patients with previous fragility fractures and those who do not have a history of fragility fractures. 19 The British National Osteoporosis Society (NOS) recommended that low QUS values should be considered as an independent risk factor for osteoporotic fracture. 20 These recommendations by NOS were suggested as at least to be used as a screening tool. 3
One of QUS methods is QUS of the phalanx. It measures the amplitude-dependent type of speed of sound (Ad-SOS). At the metaphysis, both cortical and cancellous bone tissues are present. Due to high bone turnover and its sensitivity to changes, the metaphysis of the phalanx is also appropriate to predict fractures.4,21
The benefits of QUS become clearer when an attempt is made to determine secondary osteoporosis. These at-risk patients are scattered geographically, likely have limited access to DXA, and may have prohibiting disabilities. Another concern is the price of the DXA measurement, maintenance, and care, which can create an economic impact. Quantitative ultrasound is easily portable for implementation, and the measurement price is generally one-third of DXA.
Some of the types of secondary osteoporosis are caused by rheumatoid arthritis (RA), chronic kidney disease (CKD), kidney transplantation (KT), and levothyroxine use. These are important because of their disabilities and the high cost of care, which is complicated by an increased fracture risk.
RA is an immune-mediated inflammatory connective tissue disorder. As mentioned, RA is an associated risk factor for osteoporosis. The prevalence of new co-morbidity is 41% in 5 years, and so osteoporosis can be considered a common finding. 22 Frequency of fracture in patients with rheumatoid diseases is about 50%. 23
The fracture in patients, on glucocorticoid therapies, can occur with any DXA T-scores (even in normal range); therefore, the WHO diagnostic may not be suitable.1,8 This would suggest that other cutoff points or additional diagnostic methods, other than DXA, are needed.
The Kidney disease outcomes quality initiative (K/DOQI) suggests that “CKD is defined as kidney damage or glomerular filtration rate (GFR) of <60 mL/min/1.73 m2 for three months or more, regardless of the cause.” 24 Fractures in end-stage renal disease patients who undergo chronic dialysis are fourfold or more, compared with the general population. 25 The DXA is an acceptable method for predicting fracture risk in CKD stages 3 to 5. 26 But some reports 27 showed that DXA does not predict the risk of fracture in hemodialysis patients. The DXA has limitations in describing properties like an increase in cortical bone loss that is common in CKD. 28 So, attention should be paid to other diagnostic methods that can assess bone quality.
Recipients of KT have high risk of osteoporosis. Fracture risk in these patients is even higher when they have been on dialysis, prior to transplantation. 29 The risk of fracture not only lowers the quality of life but also diminishes the patient’s ultimate survival. The incidence of fracture is 2.1% in Asians and 3.8% to 9.3% among Western populations, over a 5-year period. 30
Julian et al 31 pointed out that first 6 months after KT is critical and is associated with an increased risk of osteoporosis. The BMD is significantly reduced, especially in the vertebra (4%–10%) and as high as 4% in femur. 32 The presence of vascular calcification can confound the DXA assessment, as the device’s detector picks up calcium deposits, within vessels, as bone tissue. In most adult patients, the rate of vascular calcification is significantly slowed after transplantation. However, even though calcium and phosphorus levels are normal, these lesions usually do not resolve completely. 33 A decrease in cortical thickness is a main diagnostic finding, but overall BMD, measured with DXA, may be less effected. 34 Therefore, given these pitfalls, DXA may not be the best method for fracture prediction, with this type of patients.
The thyroid gland also has a special influence on the development of osteoporosis. As serum thyroid stimulating hormone (TSH) increases in older adults, hypothyroidism and low BMD become prevalent particularly in postmenopausal women.35–37 The thyroid hormones have serious effects on bone remodeling 38 and affect osteoblasts and osteoclasts. 39 Under long-term suppressive thyroxine treatment, postmenopausal women may need serial BMD assessments. 40 However, some studies have failed to confirm these detrimental effects on bone density41,42 or on fracture risk. 43 Due to the more detrimental effects of L-T4 treatment on cortical bone than trabecular bone, which DXA is limited in differentiating, 44 QUS may be a better diagnostic alternative.
It is important to point out that QUS has its diagnostic flaws. Although in certain populations, QUS calcaneal measurements may accurately identify osteoporosis and fracture, scarce evidence is provided on its use for the assessment of therapy and surveillance. 7 Even with one of the best QUS equipment, false negatives and positive results have been reported. 45 In addition, there is no specific guideline for clinical management 46 and the WHO criteria cannot be used for analyzing QUS results.
Due to importance of secondary osteoporosis, it would seem vital to look at the potential for QUS to assist in defining bone changes, due to underlying disease, in comparison with healthy ones and the power to differ between normal and secondary osteoporotic patients. However, there is conflicting data about QUS abilities41,47–56; therefore, this was tested in a convenient sample of patients.
Materials and Methods
In a project for defining usefulness of QUS of phalanx in bone densitometry, BMD was measured in patients of a referral center and was assessed with DXA and QUS of phalanx. Among the participants recruited, 200 cases of secondary osteoporosis were entered into the study. The utility of QUS was defined for this study as differentiating between the recruited patients and normal controls. It was also important to find correlation between QUS and DXA results, as determinants of osteoporosis.
Participants
In the RA group, all the patients used prednisone of ≥ 7.5 mg (or equivalent) for more than 3 months.
Among the hemodialysis patients, they collectively spent more than 2 months of dialysis.
For those renal transplantation patients, the majority had undergone transplantation more than 2 months (mean, 2.8–2.9 years; range, 0.43–14.17 years).
For those patients who used levothyroxine, the patients collectively were under this therapy for more than 6 months.
All the patients across all the groups were adults and did not demonstrate any other risk for osteoporosis.
Healthy Controls
According to different characteristics, healthy controls were primarily matched by age and sex to those patients of any group that had already been entered into the study. The controls were enrolled as part of the Iranian Multicenter Osteoporosis Study (IMOS) and had been selected by randomized sampling. To confirm inclusion of healthy participants to the IMOS study, subjects with the following diseases or conditions were excluded: known history or evidence of RA, thyroid, parathyroid or adrenal disease, hepatic or renal failure, metabolic bone disease, type I diabetes mellitus, sterility, oligomenorrhea, malignancy, malabsorption, immobility for more than 1 week, pregnancy, lactation, smoking more than ten cigarettes per day, alcoholism, and medications influencing bone metabolism.
Location and Tools
All the measurements were made in the BMD Department of Endocrinology and Metabolism Research Center of Tehran University of Medical Sciences. Questionnaires were used to gather each participant’s medical history and demographic data, and they were completed during a face-to-face interview, with the operator. Each patient gave informed consent to participate in the research study.
The QUS Measurements
The ultrasound device used in this study was a DBM Sonic 1200 (IGEA, Carpi, Italy). Two probes, transmitter, and receiver are positioned opposite to each other by a high precision caliper, with the finger in between. Coupling was achieved by applying ultrasound gel. Measurement was performed in the radioulnar direction at the metaphysis of the proximal phalanges II to V. The DBM Sonic transmits an ultrasound wave at frequency of 1.2 MHz. The standard parameter is “amplitude-dependent speed of sound” (Ad-SOS). It is calculated as the distance between the transducers to divide by the time of flight. The evoked amplitude of approximately 2 mV is provided to the receiving transducer. As the term implies, Ad-SOS depends on both the velocity and the amplitude of the signal received (see Figure 2). The criteria of osteoporosis were a reduction of BMD by 2.5 SDs or more from the peak bone mass in early adulthood (T-score ≤ –2.5). All of the QUS measurements were completed by one operator.
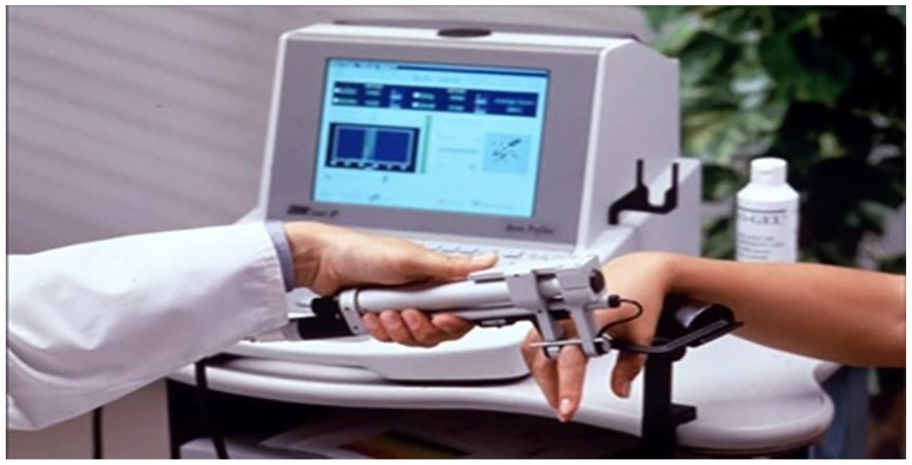
An example of a quantitative ultrasound machine being used to measure bone density in the finger.
The DXA Measurements
The DXA measurements of the lumbar spine and hip were performed using one GE-Lunar DPX-MD densitometer (Lunar Corp, Madison, WI, USA; see Figure 3). A T-score ≤ –2.5 was used as the diagnostic criteria for osteoporosis.
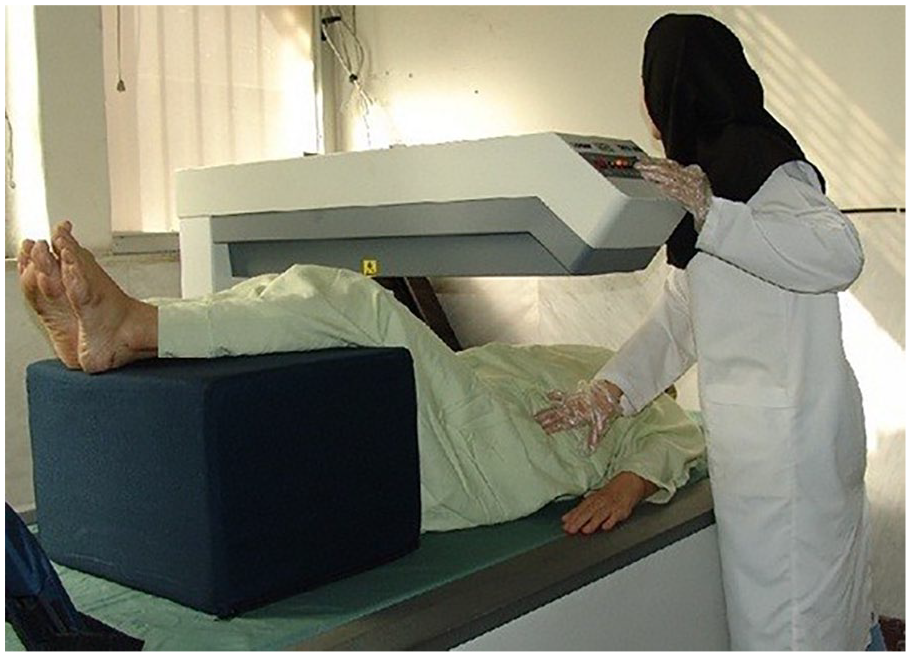
An example of a dual x-ray absorptiometry machine being used to measure bone density.
Statistical Analysis
An analysis of continuous variables was summarized with frequencies, means, SDs, and ranges. Categorical variables were summarized as simple percentages.
The BMD categories of lumbar spine and left femur were determined according to the WHO definitions. Osteoporosis and osteopenia were diagnosed according to the WHO definitions (osteoporosis: T-score, –2.5; osteopenia: T-score, –1 and −2.5; normal: T-score, –1). Events (“osteoporosis”) versus nonevents (“normal or osteopenia”) were defined by the T-score of DXA. Receiver operating characteristic (ROC) curves were used to plot Ad-SOS. The points on the fit curve closest to the left upper corner were defined as the cutoff points for the diagnosis of osteoporosis versus osteopenia and normal conditions. This cutoff point of Ad-SOS yielded sensitivity and specificity to diagnose osteoporosis versus osteopenia or normal conditions. The P value of .05 was set as statistically significant.
Results
Rheumatoid Arthritis Group
In this study, 48 RA patients and 48 controls participated. Mean age of patients was 48.3 ± 10.9 years. As demonstrated in Table 1, there were no significant differences between Ad-SOS of these patients and their matched controls.
Characteristics of Patients and Controls.
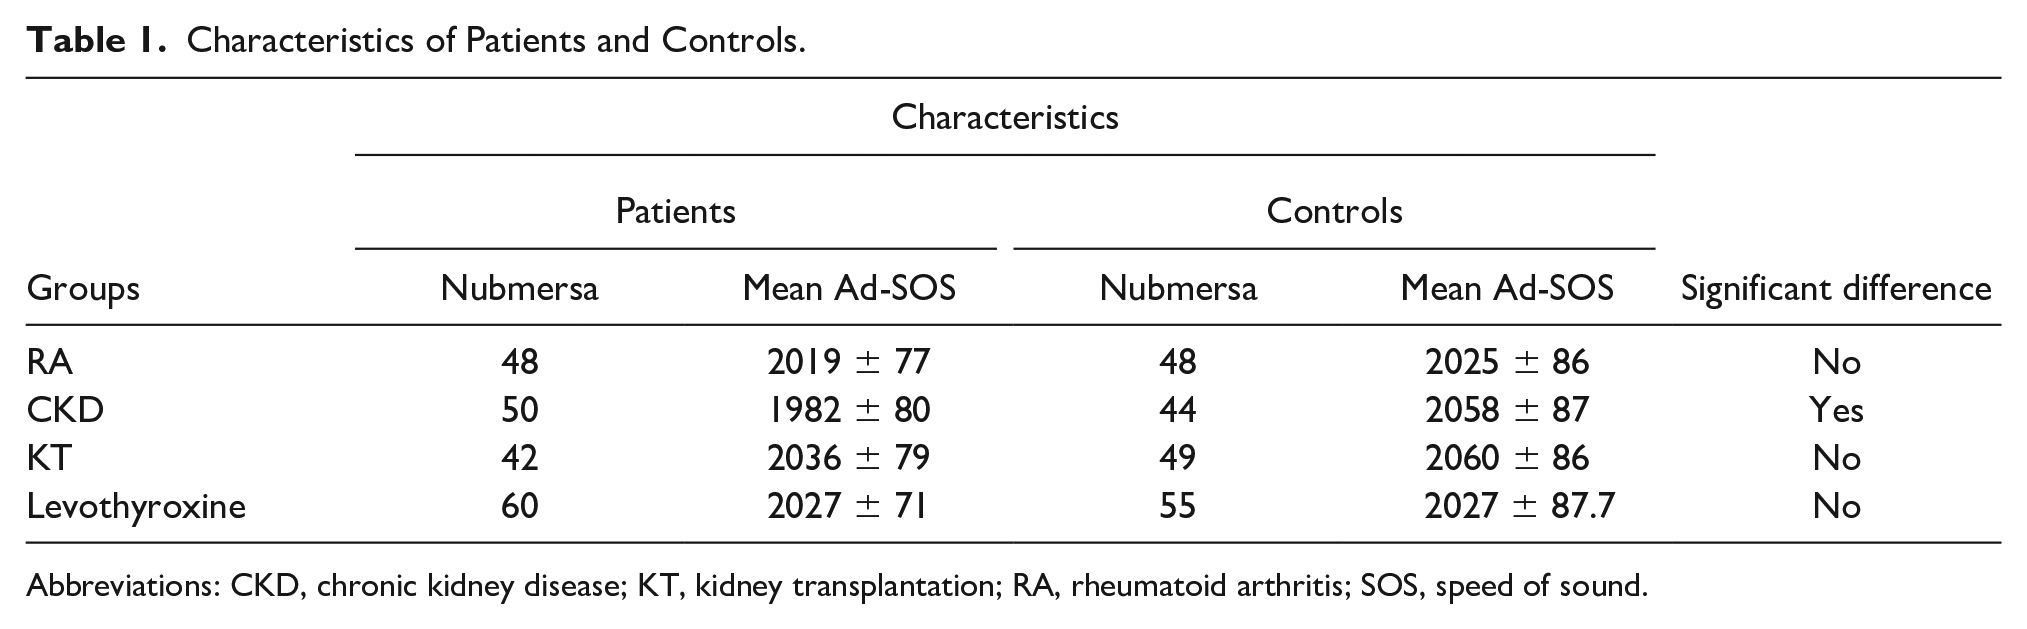
Abbreviations: CKD, chronic kidney disease; KT, kidney transplantation; RA, rheumatoid arthritis; SOS, speed of sound.
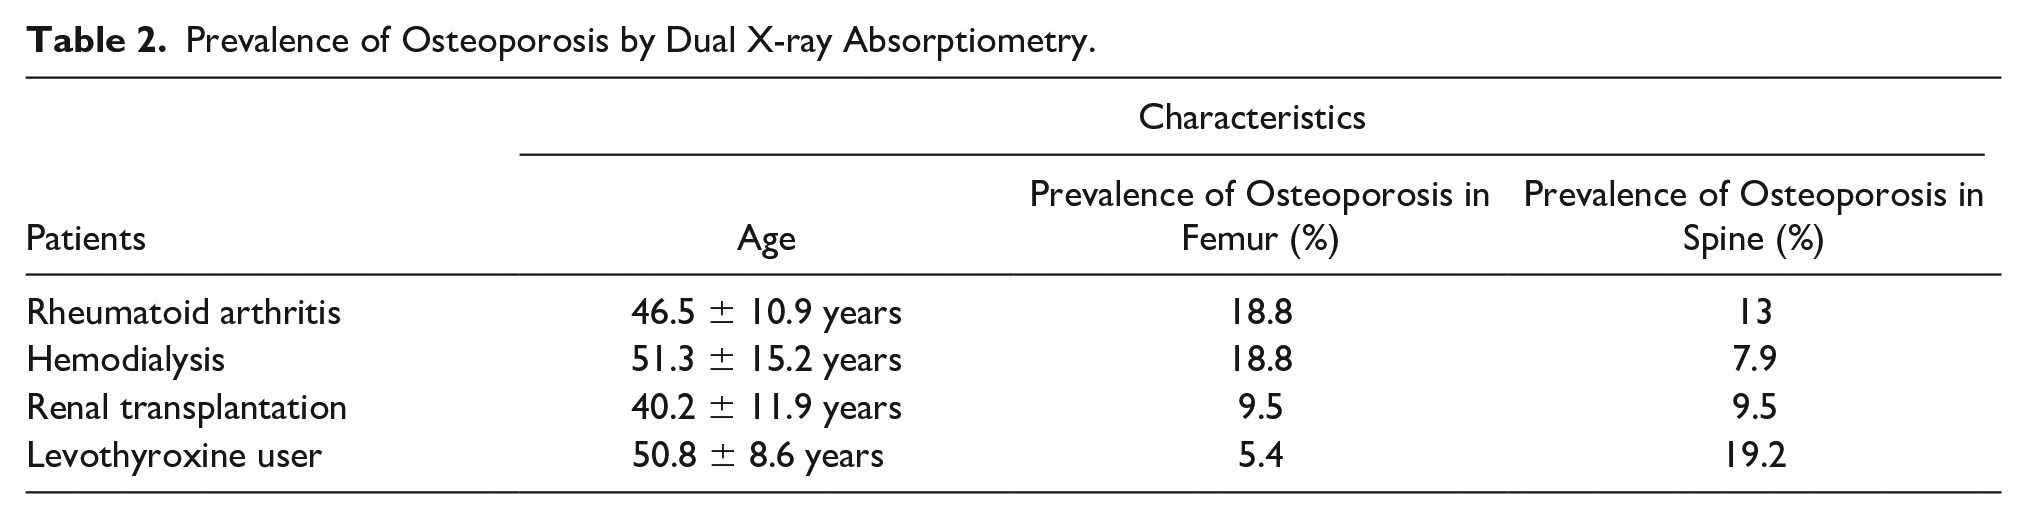
For finding correlation between the QUS of the phalanx and DXA, the same sample size was used, with a mean age of 46.5 ± 10.9 years. Prevalence of osteoporosis by DXA as gold standard can be found in Table 2. By QUS of the phalanx, osteoporosis was diagnosed in 20.8% of patients. Using the ROC curve, sensitivities of T-score ≤ –2.5 of phalanx for diagnosing of osteoporosis in total of hip and L2–L4 regions were respectively 22.2% and 50%, and specificities were, respectively, 79.5% and 85%. Areas under curve for total and spine regions were 0.506 (P = .958) and 0.644 (P = .260), respectively. So, there was not a significant correlation between them.
Prevalence of Osteoporosis by Dual X-ray Absorptiometry.
Hemodialysis Group
There was a sample size of 50 patients on hemodialysis that entered the study. The patients’ mean age was 45.90 ± 12.36 years. All of them were more than 20 years old and more than 2 months on dialysis. The mean dialysis time was 45.90 ± 12.36 months. Forty-four healthy age- and sex-matched controls were used for this comparison.
As it is seen in Table 1, there was a significant difference of Ad-SOS between patients and controls (P = .00).
For finding correlation between QUS of phalanx and DXA, 64 patients had a mean age of 51.33 ± 15.20 years and mean dialysis time of 49.45 ± 45.62 months (2-180 months). Table 2 provides the prevalence of osteoporosis gauged with DXA. Results of the comparison of QUS and DXA, in making an osteoporosis diagnosis, can be referenced to Hamidi et al. 57
Renal Transplantation Group
There were 42 patients with age 40.17 ± 11.9 years. They were studied 2.8 ± 2.9 years after renal transplantation. There were 49 healthy age- and sex-matched participants used for this review. As noted in Table 1, there was no significant difference between Ad-SOS of the renal transplantation patients and the healthy controls.
The results of a comparison between QUS and DXA, in osteoporosis diagnosis, can be referenced to Pajouhi et al. 58
Levothyroxine User Group
All of these participants were women (N = 60). As noted in Table 1, there was no significant difference between Ad-SOS of this patient subset and their healthy controls.
For finding correlation between QUS of phalanx and DXA, 74 women with a mean age of 50.8 ± 8.6 years were studied. Mean age of patients was 50.8 ± 8.6 years. The prevalence of osteoporosis, by DXA, is a gold standard and can be found in Table 2. By QUS of phalanx, osteoporosis was diagnosed in 18.9% of this patient subset. The sensitivity of a T-score ≤ –2.5, for QUS of phalanx, in diagnosing osteoporosis in the hip and L2–L4 regions were 50% and 21.4%, respectively, and the specificities were, respectively, 84.3% and 84.7%, using the ROC curve. The areas under the curve for total hip and spine regions were 0.782 (P = .059) and 0.741 (P = .005), respectively. Quantitative ultrasound compared with DXA, showed a significant correlation in L2–L4 region of the spine (see Figure 4).
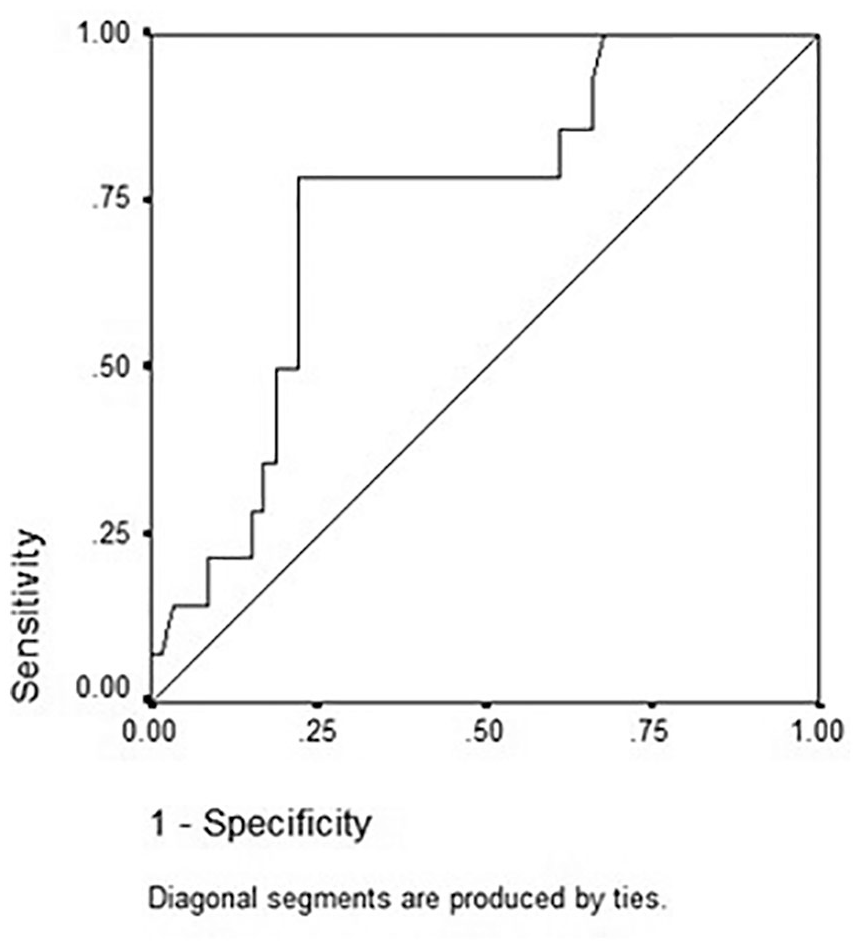
The receiver operating characteristic curve generated for quantitative ultrasound and dual x-ray absorptiometry in the spinal region of patients using levothyroxine.
Discussion
This study demonstrates that a correlation between QUS and DXA is not perfect. Before being used widely for determining secondary osteoporosis cases, it utilized to detect primary osteoporosis. In a primary osteoporosis, correlations between QUS of heel and DXA were reported as 0.26 to 0.63. Female patients with a osteoporosis diagnosis, by DXA, had upper T-score cutoff value of −1.0 in the spine and −0.6 in the femur. Men had an upper T-score cutoff value of −0.2 in spine and zero in the area of the femur.59–61 In a previous study, the kappa scores for heel QUS were 0.5 for the femoral neck and 0.31 for the lumbar region. On the ROC curve, a score of −1 was found to be appropriate. 62
Additional work has showed agreement of the DXA and phalanx QUS (kappa value), as 0.317 for spine, and 0.036 to 0.068 for femoral regions. 63 By using the ROC curve, a T-score of −2.0 was determined as the cutoff point for QUS in spine. But these efforts to find such cutoff points for the femoral region have failed. 63
In the RA patient subgroup, no correlation was found between QUS of the phalanx and DXA, in diagnosis of osteoporosis. According to reports, RA patients under glucocorticoid treatment had a sixfold increase in the risk of spinal fractures but DXA results did not change more than 0.79 SD, 50 and this may be the cause of the above findings. However, other studies have demonstrated better results than those provided in the present study. 64 Conversely, the phalanx QUS used an ultrasound mechanism to determine cortical transverse transmission, 50 but bone loss due to glucocorticoid therapy occurs predominantly by trabecular thinning. 65 So, it seems logical that QUS of phalanx cannot discriminate between normal and RA cases. Although the results of many other studies is generally better than the present study,48,49 a review of the clinical application of QUS in inflammatory rheumatic diseases emphasizes that more research is needed for QUS to be applied efficiently for proper outcomes, in rheumatic disease patients. 50
In hemodialysis patients, there was a significant difference between patients and controls. In Poland, Ad-SOS decreased in patients on dialysis more than healthy ones. 54 This positive result may be due to structural characteristics of the QUS that uses ultrasound mechanisms to determine cortical transverse transmission 50 and the major alteration in RF is generally cortical. 34 About correlations between QUS and DXA, if we want to review the results by Hamidi et al, 57 according to new researches, good correlation is shown in some studies.54,55 However, these strong correlations are not found in all studies or in all skeletal regions. 56
In reviewing the findings of the present study of renal transplanted patients, the results were not significant, but this may be due to the inclusion of patients who were both long- and short-term survivors. It may be better to conduct examinations in the first 12 months, to demonstrate clearer differences between normal controls and patients in this subgroup. 66 but studied patients examined in longer time since transplantation (mean time of 2.8 ± 2.9 years).
As was noted by Pajouhi et al, no significant correlation was found between DXA and QUS in diagnosis of osteoporosis. In new appraisal of their results, their findings are in disagreements with some other studies.51,52 The main cause may be the decrease of cortical thickness (measured by phalanx) while overall density, measured by DXA, demonstrates less change. However, the current study findings are not very different from previous studies. 53
Regarding levothyroxine users, the results showed no significant difference between levothyroxine users and controls. A Spanish study also observed no significant differences. 41 But in Hadji et al 44 study, women taking L-T4 had significantly lower values for SOS and Stiffness Index (SI).The large sample size of the Hadji et al study may be why they achieved better results.
Conversely, a significant correlation was observed between these two diagnostic methods in vertebral area. It would seem challenging because the spinal region is a rich trabecular region, and the phalanx QUS relies on ultrasound transmission through primarily cortical bone. 50
Limitations
The major limitation was the study design as it was pre-experimental. In addition, the sample size was not small, but conveniently consented; therefore, the results of this work cannot be generalized.
Conclusion
In general, this study did not find a strong correlation between the phalanx QUS and DXA, in diagnosis of secondary osteoporosis. Also, QUS findings were not significantly different between normal persons and secondary osteoporosis patients.
These data may suggest that QUS of phalanx is not the best method for assessing the changes in bone density in patients with RA, KT, and levothyroxine users. But QUS of phalanx may be useful in screening primary and secondary osteoporosis. It encourages implementation of those devices in remote geographic regions, in conjunction with departments related to secondary osteoporosis patients, such as hemodialysis and assisted living centers, for older or disabled patients.
However, confirmation of these research findings would require a larger study and before and after assessments of the effects of treatment based on parameters of QUS and the osteoporosis diagnosis. It would also be important for future research projects to define the specific diagnostic cut-point for osteoporosis, which are needed for this diagnostic method.
Footnotes
Declaration of Conflicting Interests
The authors declared no potential conflicts of interest with respect to the research, authorship, and/or publication of this article.
Funding
The authors disclosed receipt of the following financial support for the research, authorship, and/or publication of this article: This study was supported by funds provided by the Endocrinology and Metabolism Research Center of Tehran University of Medical Sciences.
Ethics Approval
Available.
Informed Consent
Available.