
Abstract
Objective:
To determine the accuracy of supine and prone approaches to sonographically measured kidney dimensions.
Methods:
The kidney dimensions of 109 participants were sonographically determined in supine and prone patient positions. The two measurements were compared with each other using the intra-class correlation, coefficient of variation for duplicate measurements and Bland-Altman plot. The two sets of measurements were each compared with measurements from computed tomography.
Results:
There was a very strong agreement between kidney dimensions in supine and prone positions. There was also an agreement between kidney dimensions in supine and prone positions and computed tomography measurements.
Conclusion:
The kidney dimensions obtained using patient-in-supine position and patient-in-prone position approaches may be equivalent and the two approaches may be used interchangeably.
The kidneys are a pair of bean-shaped organs that form a part of the urinary system. They are frequently a target for imaging evaluation due to the various pathologies that may affect them. Sonography is usually the preferred first-line imaging modality to evaluate the kidneys in most settings. The preference of sonography is because of its nonionizing nature, wider availability of the equipment, ease and speed of conducting the examination, and lower cost. 1
The kidneys are usually assessed with sonography to detect pathology, monitor the progress of pathology, and response to interventions such as treatment for chronic kidney diseases, which necessitates measuring their sizes. Sonographic renal size assessment is a reliable diagnostic tool for the assessment of chronic kidney disease. 2 A change in kidney size between two examinations performed over some time is an important indicator of the presence or progression of a disease. 3 There is a need for consistency in the methods adopted in the sonographic measurement of the kidneys to have reliable measurement values. The kidneys are usually sonographically examined in adults with the patient in supine or lateral decubitus position. 4 However, some clinical studies have evaluated renal size, using the patient-in-prone position.1,5–7 Inconsistent scanning techniques have the potential to lead to a lack of consistency in methods adopted in the sonographic measurement of the kidneys, as well as across different imaging departments and sonographers.
Sonographers often adopted the patient-supine, the patient-prone approach, or a combination of the two. The equivalence of the two approaches has continued to be a subject of debate. While a study indicated that the measurements of the kidneys in adults obtained in patient-supine and patient-prone positions were equivalent, 1 other studies reported the exact opposite.5,6 In a study involving children aged between 6 months and 16 years, there was a statistically significant difference between renal length measured in supine and prone positions. 6 Also, in another study conducted on children, there was a linear relationship between renal measurements obtained in supine and prone positions using Pearson correlation analysis but Bland-Altman plot showed wide limits of agreement (LoAs) suggesting that both methods of measuring kidney dimensions were not interchangeable. 8 The study equally shows the importance of adequate statistical analysis in reaching conclusions regarding different methods of measurements. It is important to note that some studies may not have used rigorous statistical testing before pronouncing agreement between renal dimensions obtained in supine and prone positions. 1
There may be significant differences in kidney measurements obtained using the supine and prone methods separately. This is a potential pitfall for standardization of sonographic determination of kidney dimensions. A sonographer may elect to use either of the methods or a combination of both. In the supine position, the kidneys are farther away from the transducer compared with when the patient is in a prone position as the liver and spleen serve as windows to the right and left kidneys, respectively. This situation may exaggerate kidney dimensions considering the divergent nature of the ultrasound beam. From the foregoing, the three questions that readily come to mind are as follows: Are kidney sonographic measurements obtained separately in supine and prone positions equivalent and the method interchangeable? Which of the two methods produce dimensions that favorably agree with those produced using a reference standard modality, such as computed tomography (CT)? Do the body mass index (BMI) and abdominal circumference (AC) of the patient affect the accuracy of the measurements obtained? Thus, the aim of this study was to determine the agreement between kidney dimensions obtained in supine and prone positions separately and the relative accuracy of both methods compared with CT measurements. This has the potential for standardization of kidney size measurements, using sonography.
Method and Materials
A cross-sectional study targeting patients referred for renal sonography and/or CT of the abdomen was conducted. The research design and protocol was approved by the Research Ethics Committee of the host hospital, prior to commencing with the study. The study was carried out in the radiology department of a hospital in Lagos, Nigeria. The hospital is known for its outstanding success in renal transplant surgery. Consequently, it receives patients from all over the country and the West African subregion. A minimum sample size of 42 pairs of measurements (42 patients) was calculated using G*Power 3.0.10 software for sample size calculation (University of Dusseldorf, Germany).
The participants in this study consisted of 109 adult patients who presented for abdominal sonography. Twenty of these patients also additionally underwent a CT of the abdomen. The inclusion criteria for study patients were as follows:
Living kidney donors who presented for donor nephrectomy and referred for a sonogram and/or CT;
Subjects with normal findings at sonography;
Willingness to participate in the study.
The exclusion criteria for participants were dependent on any or all of the following conditions:
Presenting with unilateral or partial nephrectomy;
A diagnosis of known renal disease, hypertension, diabetes, solitary kidney, ectopic kidneys, and other congenital malformations of the urinary system;
Reporting a history of prolonged febrile illness, recurrent or chronic illness that may affect the kidney size such as sickle cell disease, chronic renal disease, and chronic liver disease;
Diagnosis of any known malignancy;
Pregnancy or any intra-abdominal masses;
Unwillingness to participate in the study.
All patients invited to participate were required to sign a consent form, upon a thorough explanation of the study. All patients were enrolled in the study after the consent form was signed. Conclusion of the consent process led to the patient being asked to empty the urinary bladder, so that the sonography examination could begin. This request was made to avoid an increase in renal length caused by oral hydration. 7 The weight of each participant was measured using a simple electronic weighing scale that had the capability of weighing up to 120 kg, as well as graduations of 0.1-kg interval. The height of each participant was measured using a metal measuring tape held against a vertical pole. The height was measured with a participant wearing no footwear, hat, or artificial hair. The height was measured while the patients stood on their heels, buttocks, shoulders, and occiput touching the vertically placed measuring tape. The head was held upright with the external auditory meatus and the lower border of the orbit in the same horizontal plane. The AC of each participant was measured at the level of the lower costal margin, using flexible measuring tape. The participant’s age was ascertained from the examination request form and confirmed by the sonographer. All the measurements were made by the same observer to reduce observer variability.
The sonogram was performed on each participant by a single sonographer with 12 years of experience in abdominal sonography. The renal sonograms were conducted using a Toshiba Aplio XG machine equipped with a 3.5-MHz curvilinear transducer. Each patient was examined in supine and prone positions, in succession. For the supine position, acuostic gel was applied on both flanks of the participant. The transducer was placed in between the iliac crest and the lower costal margin on the right side at the midaxillary line of the right side of the participant to measure the length and height of the right kidney. Then, the ultrasound transducer was placed between the iliac crest and the lower costal margin on the left side at the midaxillary line to obtain the longitudinal axis of the left kidney. The length and height of the left kidney were then measured. The kidney length was measured as the longest perpendicular distance from the upper pole to the lower pole (see Figure 1). The kidney height was measured as the distance between the anterior and posterior borders of the kidney (see Figure 2). From the supine position, the participant was turned through 180° to lie face down on the couch. Acoustic gel was applied over the right and left iliocostalis lumborum and longissimus thoracis muscles. The transducer was placed obliquely in a longitudinal direction on each of the sides in turn, at the level of lower costal margin and orientated toward the opposite shoulder. It was then adjusted until the longest span of each kidney to obtain the measurement of the length and height. All sonographic measurements were made on static sonograms, using built-in electronic calipers. To avoid observer bias, the readout portion of the screen was masked with black cellophane tape. This was done to ensure that the sonographer was unaware of the value of the measurements, in both the supine and prone phases. The values were recorded by a research assistant at the end of each phase of measurement.
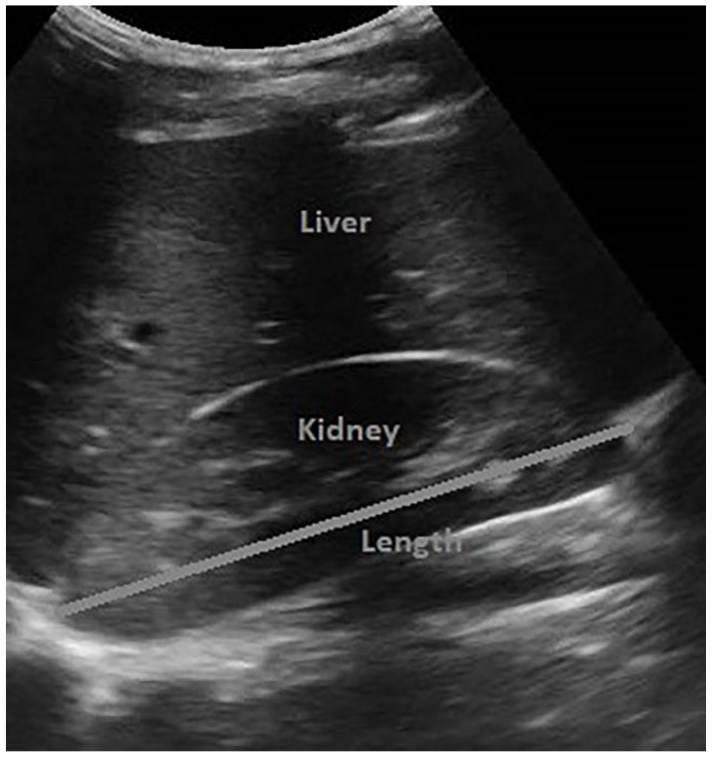
A sonogram demonstrating a kidney length measurement.
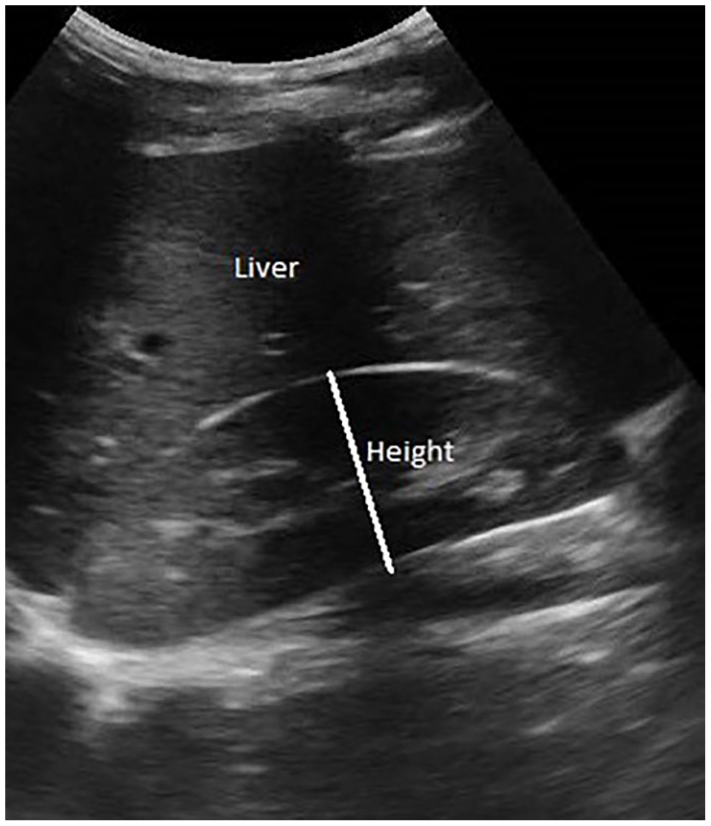
A sonogram demonstrating a kidney height measurement.
A contrast-enhanced CT of the abdomen and pelvis was performed on 20 of the participants who were scheduled for a CT as donor nephrectomy patients. The CT examination was completed with a Toshiba Aquilion 64-slice scanner. The intravenous contrast agent used for the CT was ioversol (Optiray 320; Mallinckrodt Imaging). The CT images were acquired in helical fashion in 5-mm slices and 5-mm scan increment. The data were reconstructed at 0.5 mm × 0.3 mm to create 3 mm × 3 mm coronal images, which were saved on the picture archiving system (PACS) of the hospital. The PACS facilities were used for the multiplanar reformat to reconstruct images in sagittal, oblique, and coronal planes. The long axis of each kidney was measured by the CT radiographer using repeated adjustments of the reconstructed planes until the longest renal length measurement was produced (see Figure 3).
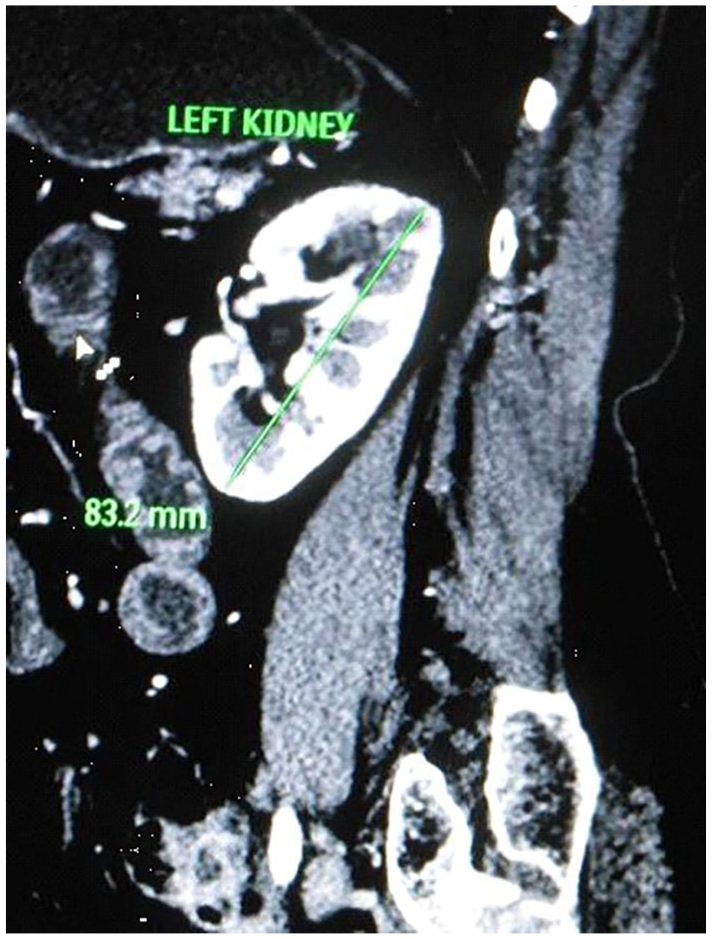
A sagittal CT image demonstrating the measurement of kidney length.
Data Analysis
The BMI of each participant was calculated using the following formula:

The data collected were categorized according to BMI and AC and analyzed using MedCalc statistical software version 19.0.5 (MedCalc Software bvba, Ostend, Belgium). The sonographic kidney length measurements, obtained in supine and prone positions, were compared to determine their agreement, using the intraclass correlation coefficient (ICC). The pairs of measurements were further analyzed using the coefficient of variation (COV) for duplicate measurements and Bland-Altman plots. The sonographic kidney length measurements obtained in supine and prone positions were also each compared with CT kidney measurements. This was done to determine the agreement between the two using the ICC and COV for duplicate measurements. Statistical significance was set at P < .05, a priori.
Results
The mean age of the participants was 32.6 ± 2.51 years (range 20–70 years) and the mean AC was 82.6 ± 5.7 cm. The mean BMI of the participants was 23.07 ± 2.29 kg/m2 (18.3–30.8 kg/m2).
The ICC analysis demonstrated that there was strong agreement between the right kidney measurements in supine and prone positions (see Table 1). The weakest agreement was between the left kidney height in supine and prone positions. The values in Table 1 demonstrate a strong agreement between the values of kidney length measurements in supine and prone positions. The left kidney length measurement showed the strongest agreement (see Table 1).
Intraclass Correlation Between Sonographic Measurements of the Kidneys in Supine and Prone Positions, Based on 109 Patients.
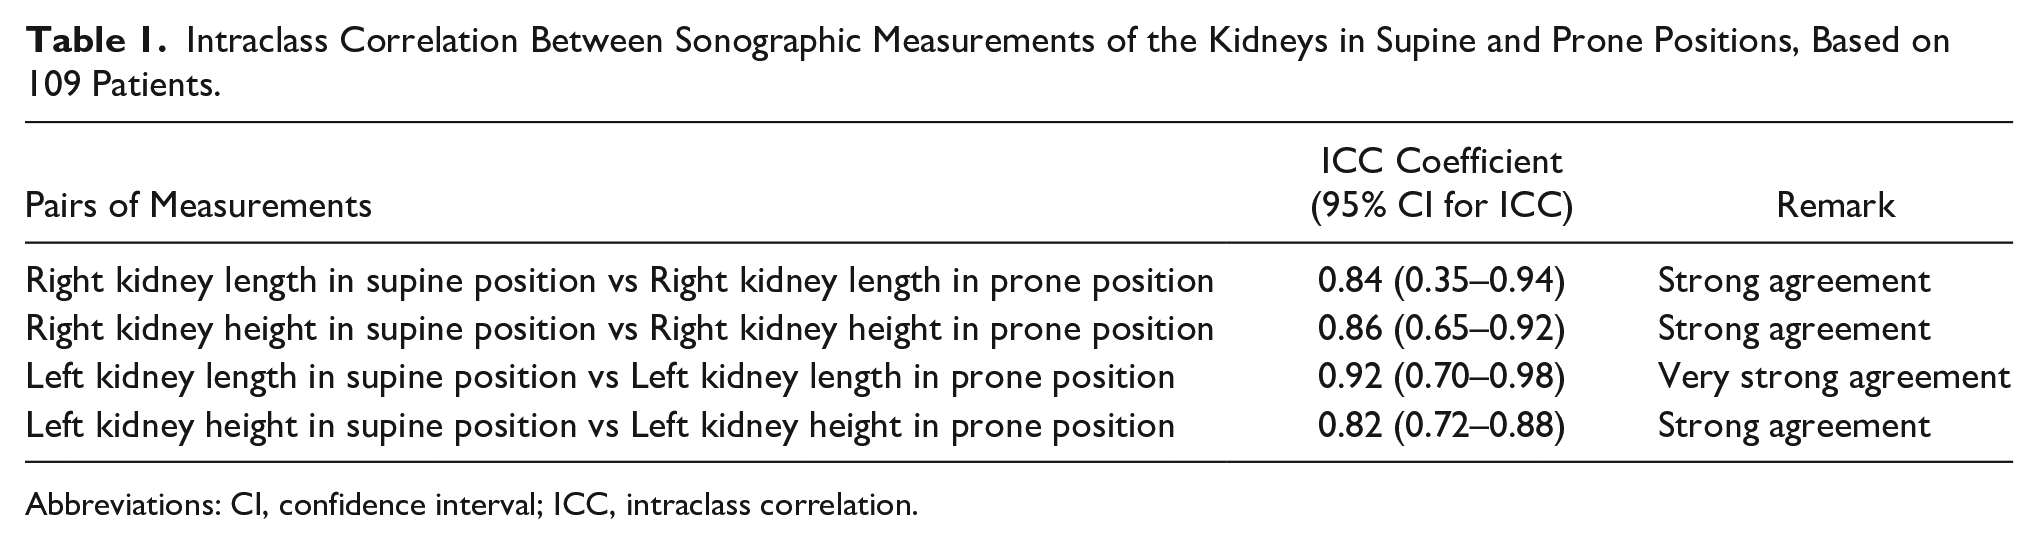
Abbreviations: CI, confidence interval; ICC, intraclass correlation.
The COV for duplicate measurements showed that the least variation of measurements between supine and prone positions was achieved with the left kidney length (see Table 2). There were overall minimal variations in the measurements, as noted in the data table. The left kidney length measurements in supine and prone positions showed significantly less variation than the right (P = .0004). There was no significant difference in the variation between the supine and prone height measurements between the right and left kidneys (P = .7058). The result is in tandem with those obtained from the intraclass correlation analysis.
Coefficient of variation Between Sonographic Measurements of the Kidneys in Supine and Prone Positions, Based on 109 Patients.
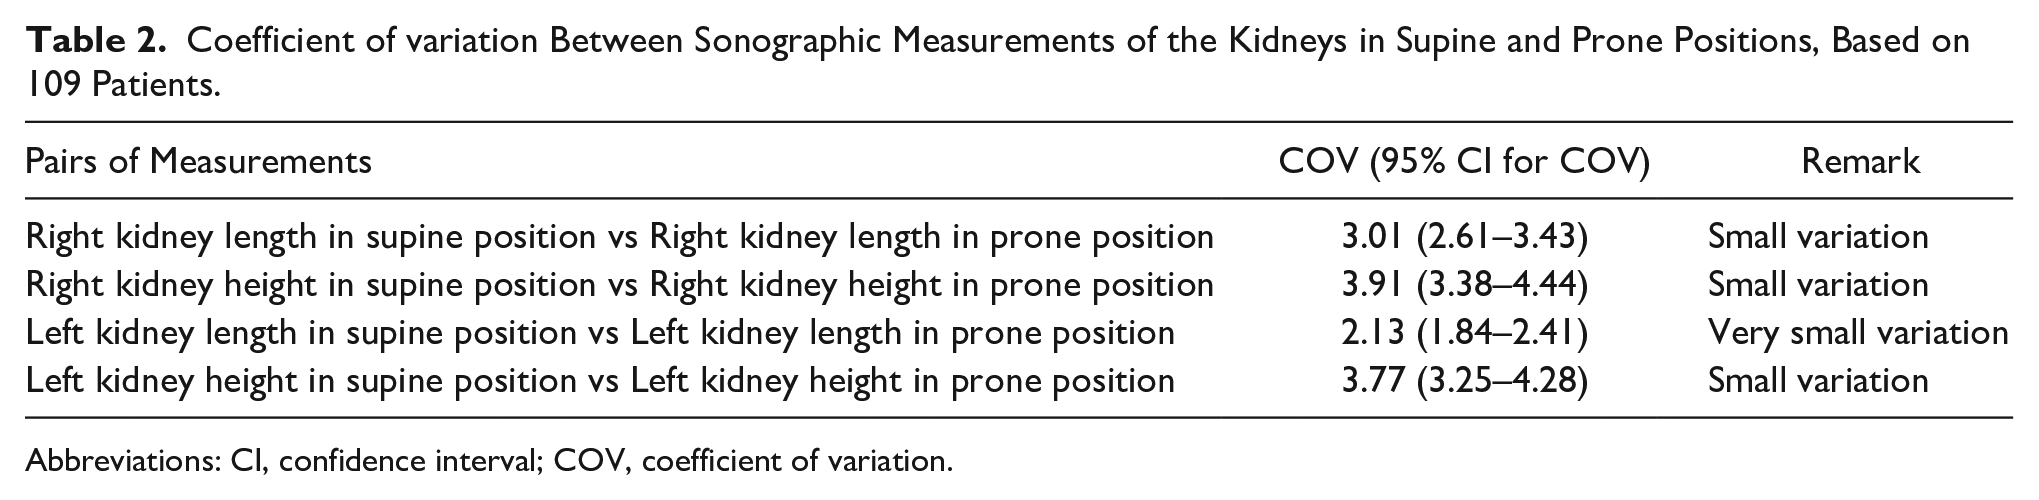
Abbreviations: CI, confidence interval; COV, coefficient of variation.
The Bland-Altman plots revealed high degrees of agreement between sonographic kidney measurements in supine and prone positions. Reviewing Figure 4A–D, it demonstrates that most of the paired measurements lie within the upper and lower LoAs. The horizontal orange line at the zero mark of the vertical axis, in Figures 4A–D, is the line of equality where the paired measurements from both methods are equal. Similarly, the blue horizontal line represents the mean of measurements from both methods. The upper and lower maroon-colored broken horizontal lines with error bars (in green color) are the upper and lower LoAs, respectively. The LoAs are the interval within which a proportion of the difference between values was obtained from both approaches to sonographic measurement of the kidneys. It accounts for both systematic and random errors.
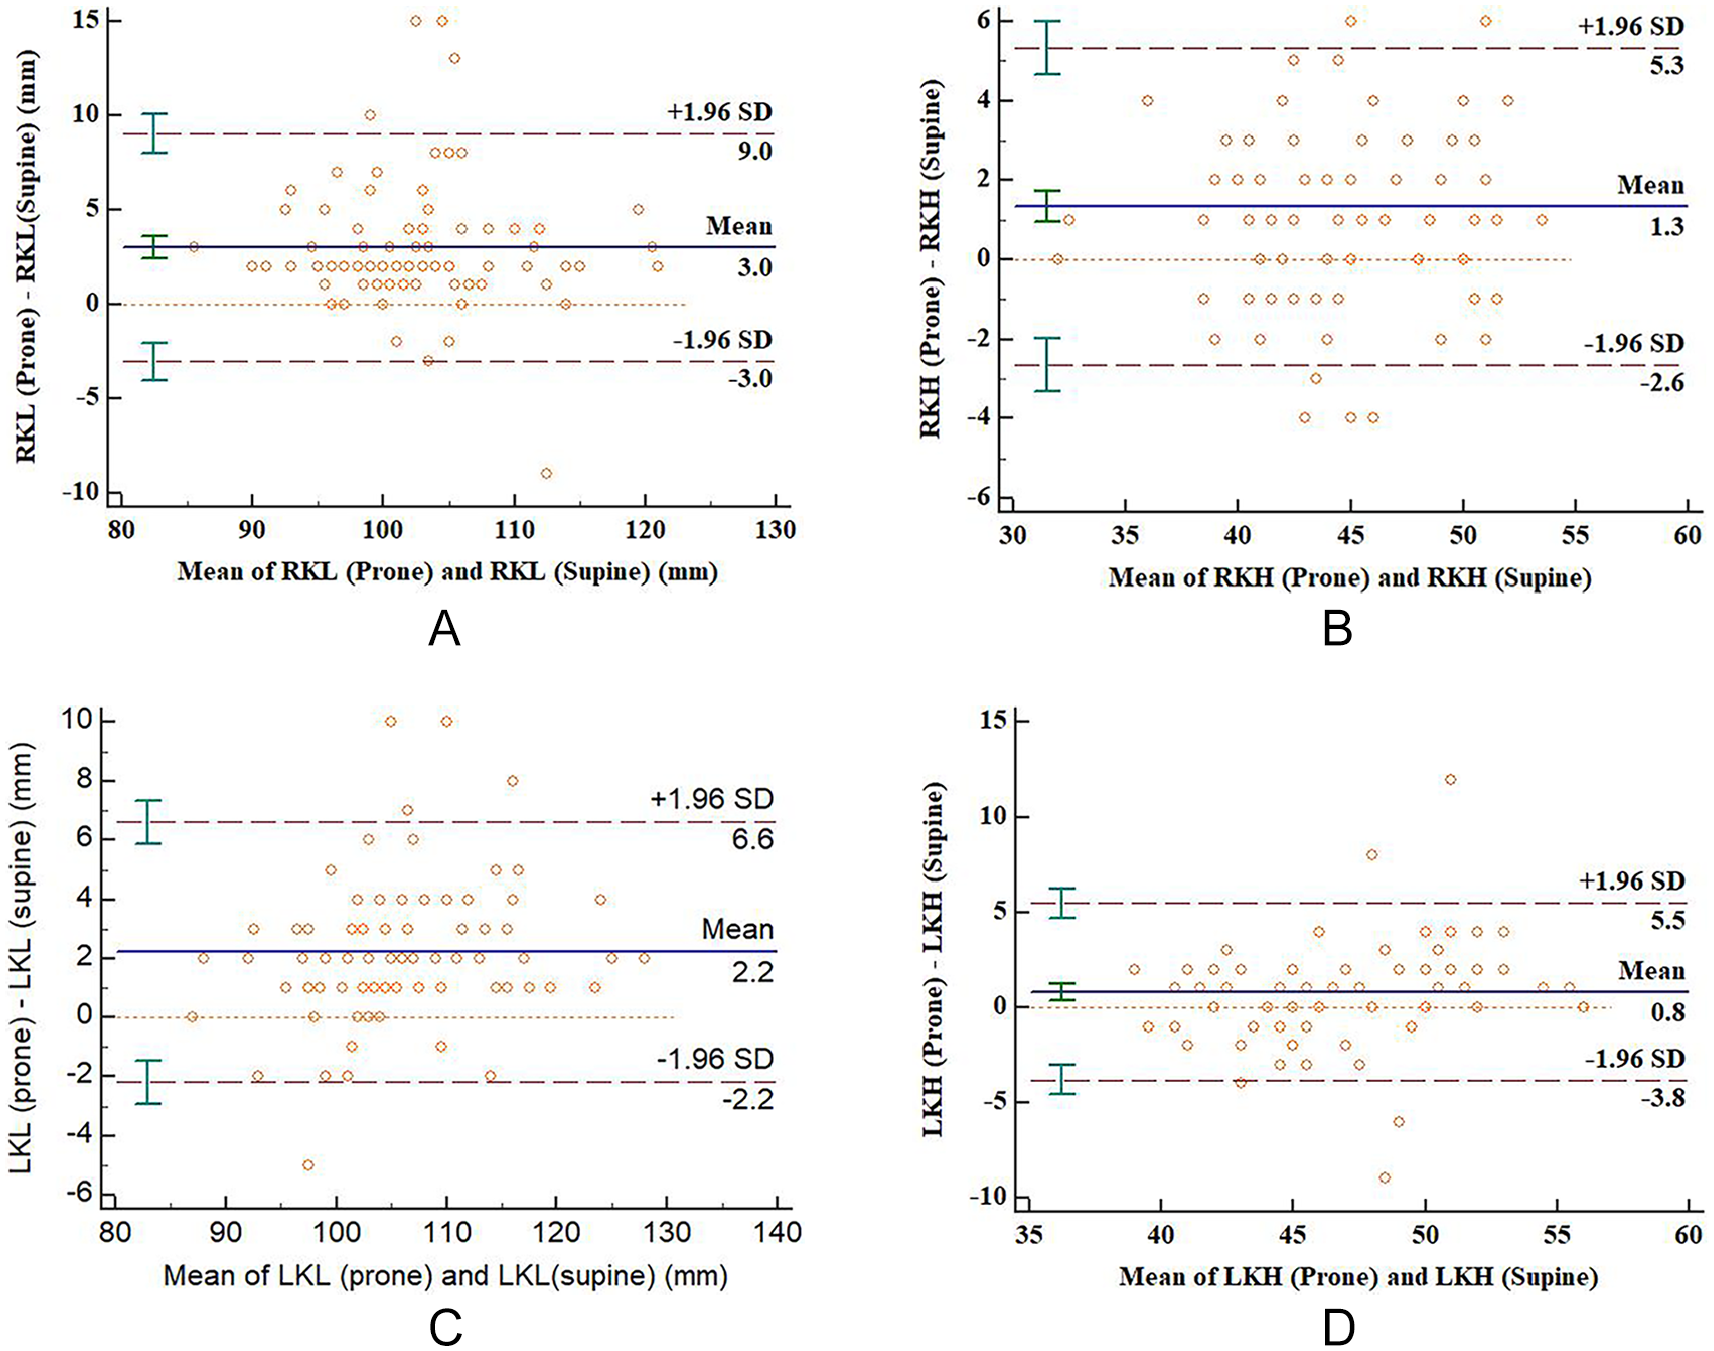
Bland-Altman plot comparing (A) right renal length in prone and supine positions, (B) right renal height in prone and supine, (C) left renal length in prone and supine positions, and (D) left renal height in prone and supine positions.
Table 3 shows ICC between kidney measurements in supine and prone positions according to two BMI categories involved in the study, namely, normal weight (n = 96) and overweight (n = 11) categories. There were three underweight participants but they were not included in this analysis as they were considered statistically inadequate. The table demonstrates a generally high degree of agreement between supine and prone measurements in both categories. Table 4 also indicates the ICC between kidney measurements in supine and prone positions according to two AC categories involved in the study. The data also show a generally high degree of agreement between supine and prone measurements in both categories.
Intraclass Correlation Between Sonographic Measurements of the Kidneys in Supine and Prone Positions, According to BMI Categories.
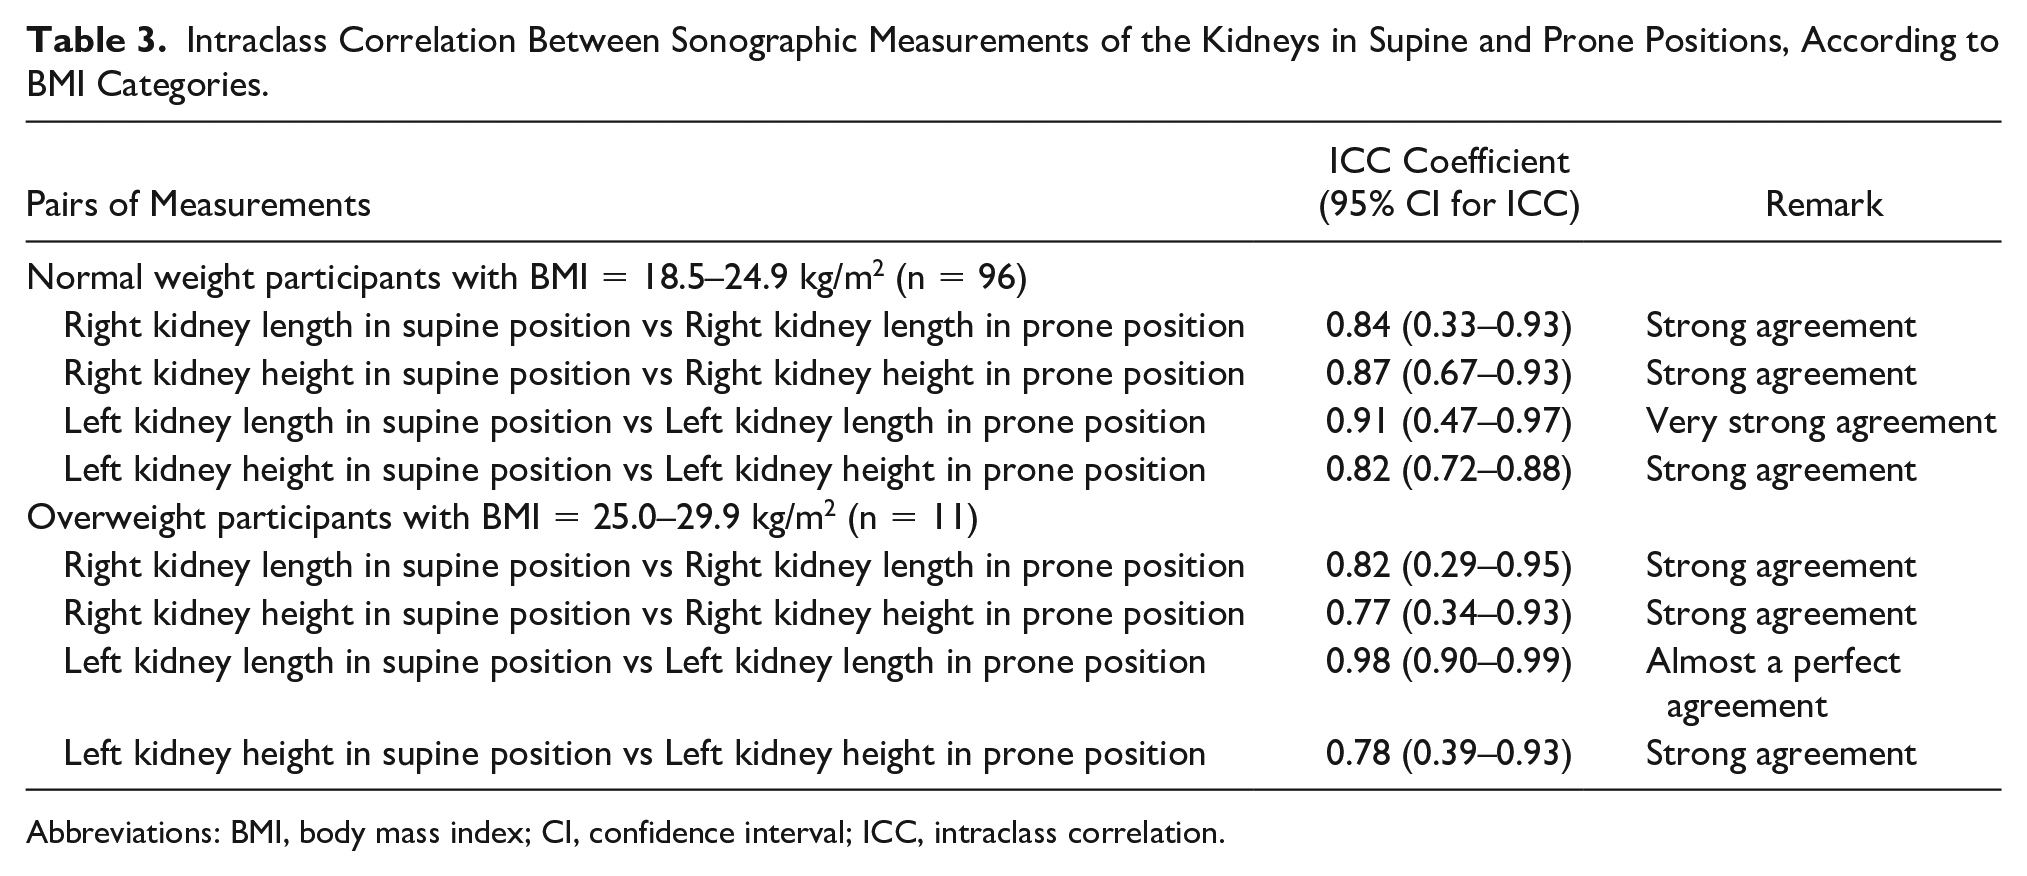
Abbreviations: BMI, body mass index; CI, confidence interval; ICC, intraclass correlation.
Intraclass Correlation Between Measurements in Supine and Prone Positions According to Abdominal Circumference of Participants.
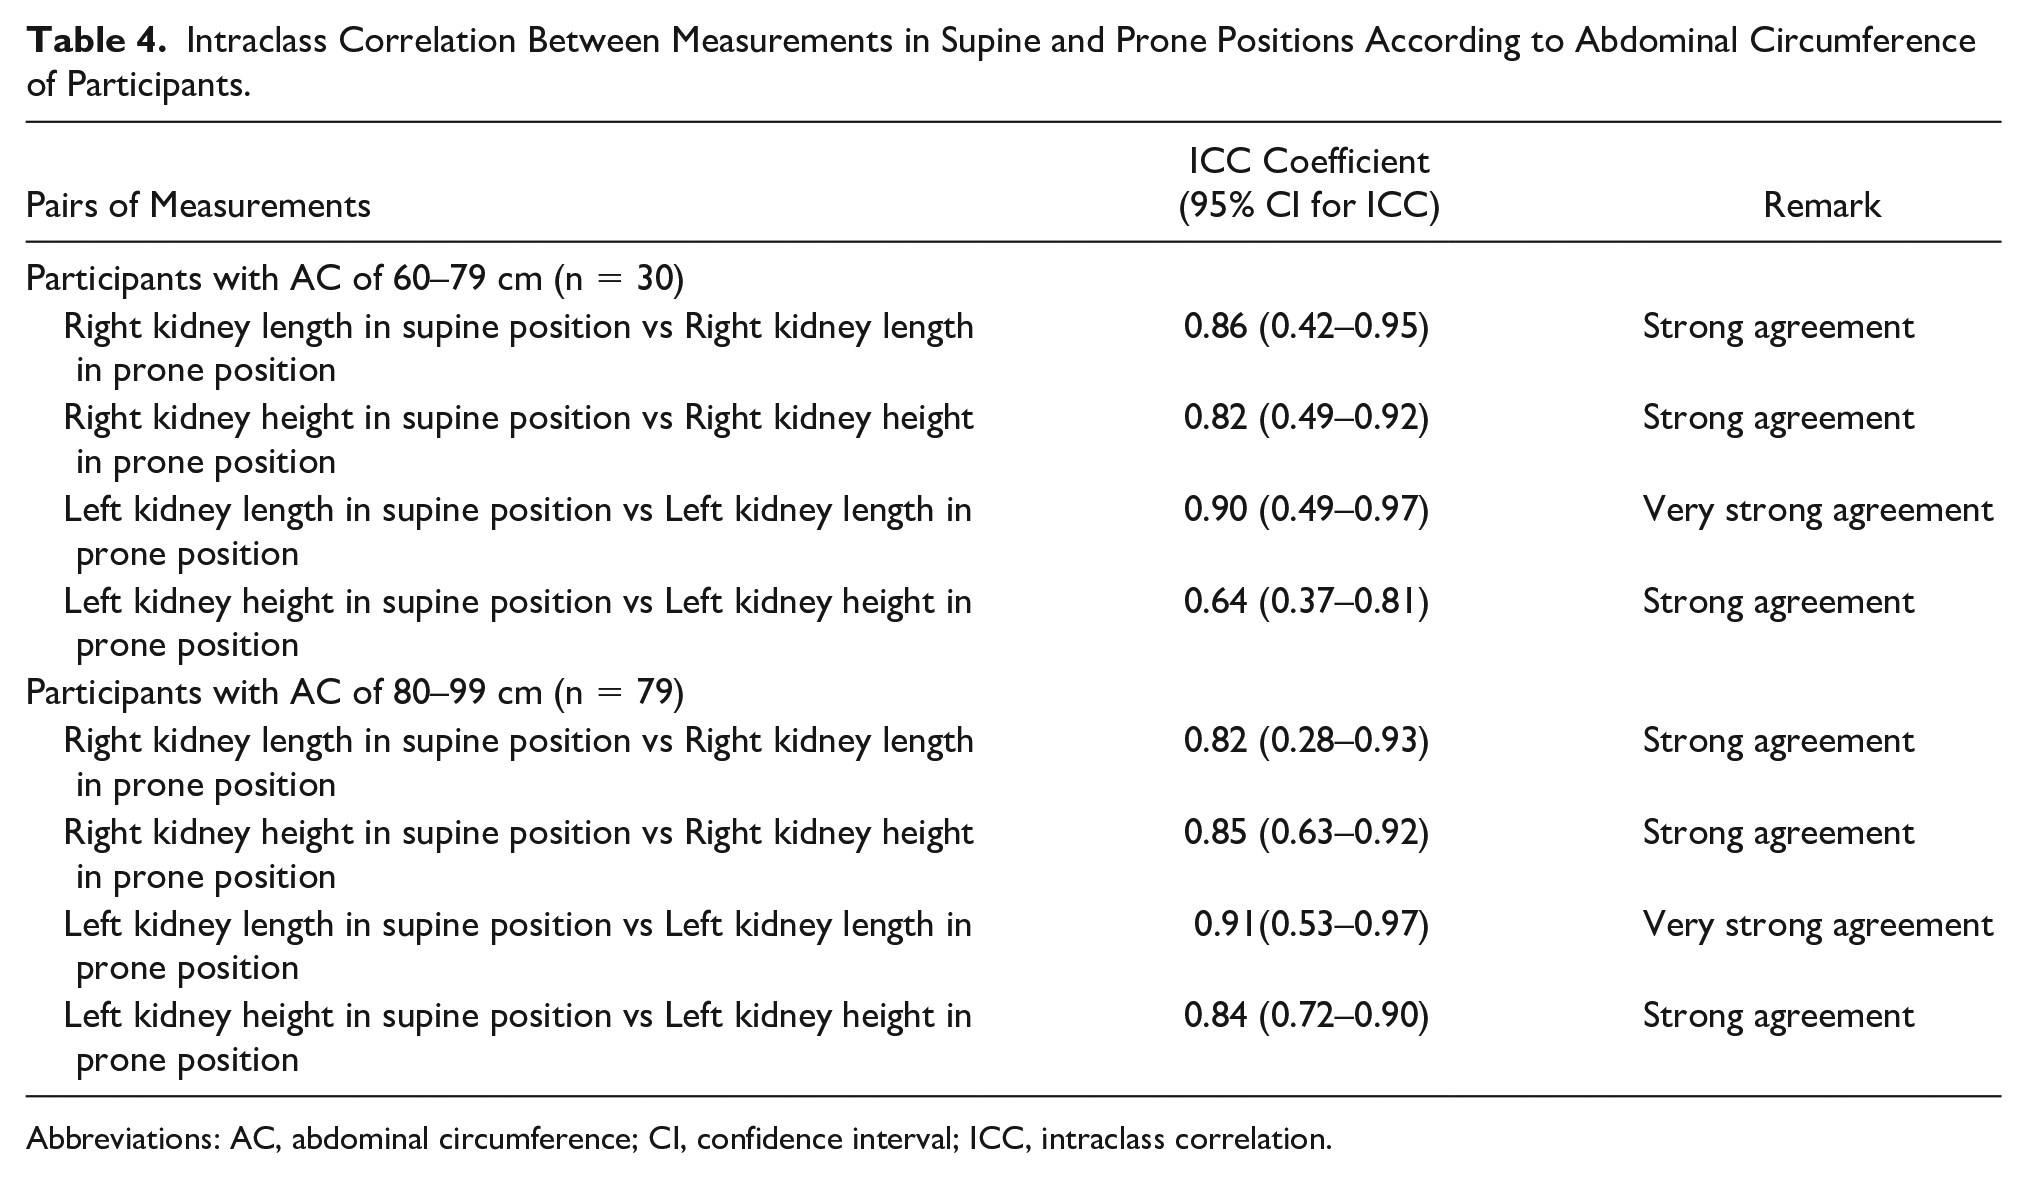
Abbreviations: AC, abdominal circumference; CI, confidence interval; ICC, intraclass correlation.
The kidney measurements in supine and prone positions were compared with measurements at CT for participants who underwent both sonography and CT. In Table 5, the data show strong agreement between sonographic measurements of the kidneys in the supine and prone positions and measurements of the kidneys, as well as the 20 patients who underwent both examinations. There were no significant differences in the agreement between the measurements of the kidneys in supine and prone positions with the CT measurements (P > .05). The COV between kidney measurements at CT and sonographic measurements in supine and prone positions are shown in Table 6. There were no significant differences in the COVs between the measurements of the kidneys in supine and prone positions with the CT measurements (P > .05).
Intraclass correlation Between Measurements of the Kidneys From Computed Tomography and Sonography, Based on 20 Participants.
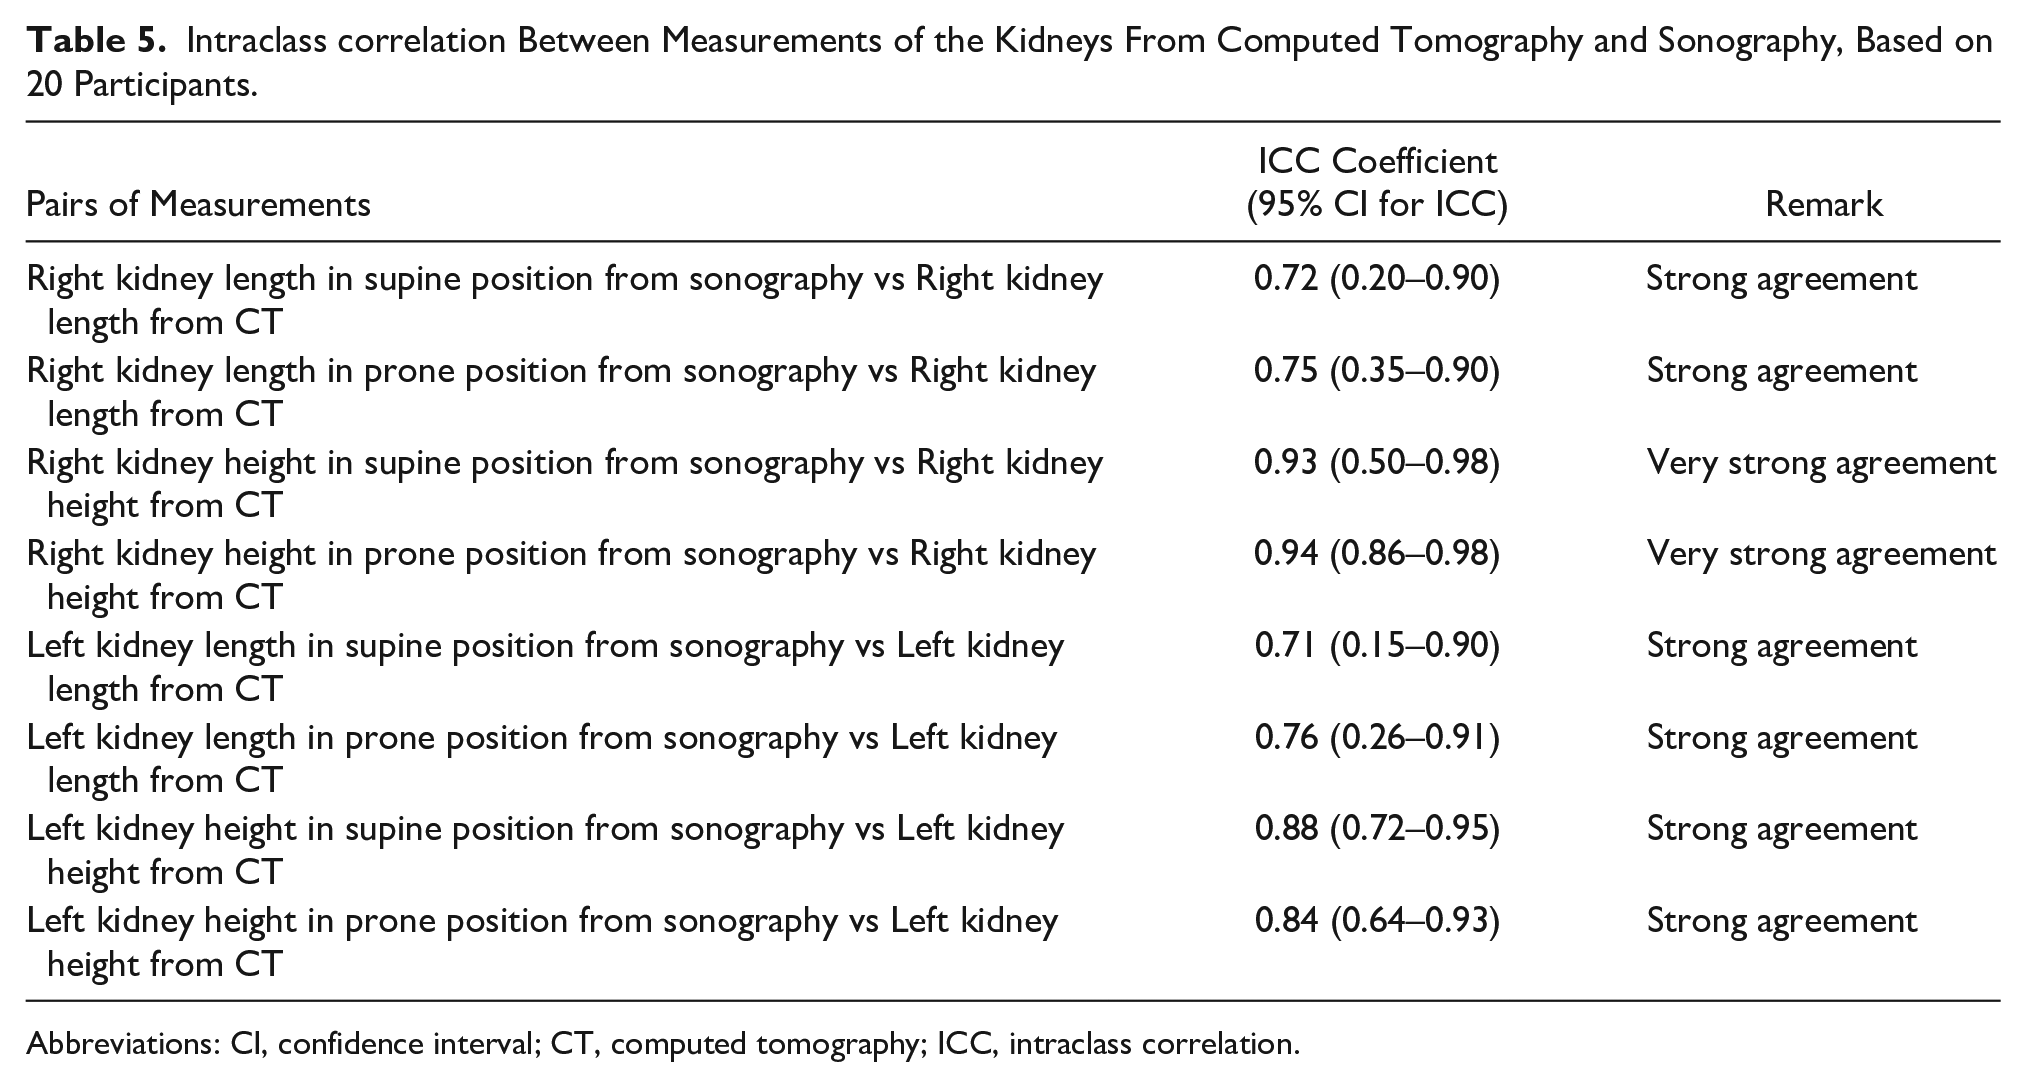
Abbreviations: CI, confidence interval; CT, computed tomography; ICC, intraclass correlation.
Coefficient of Variation Between Measurements of the Kidneys From Computed Tomography and Sonography, Based on 20 Patients.
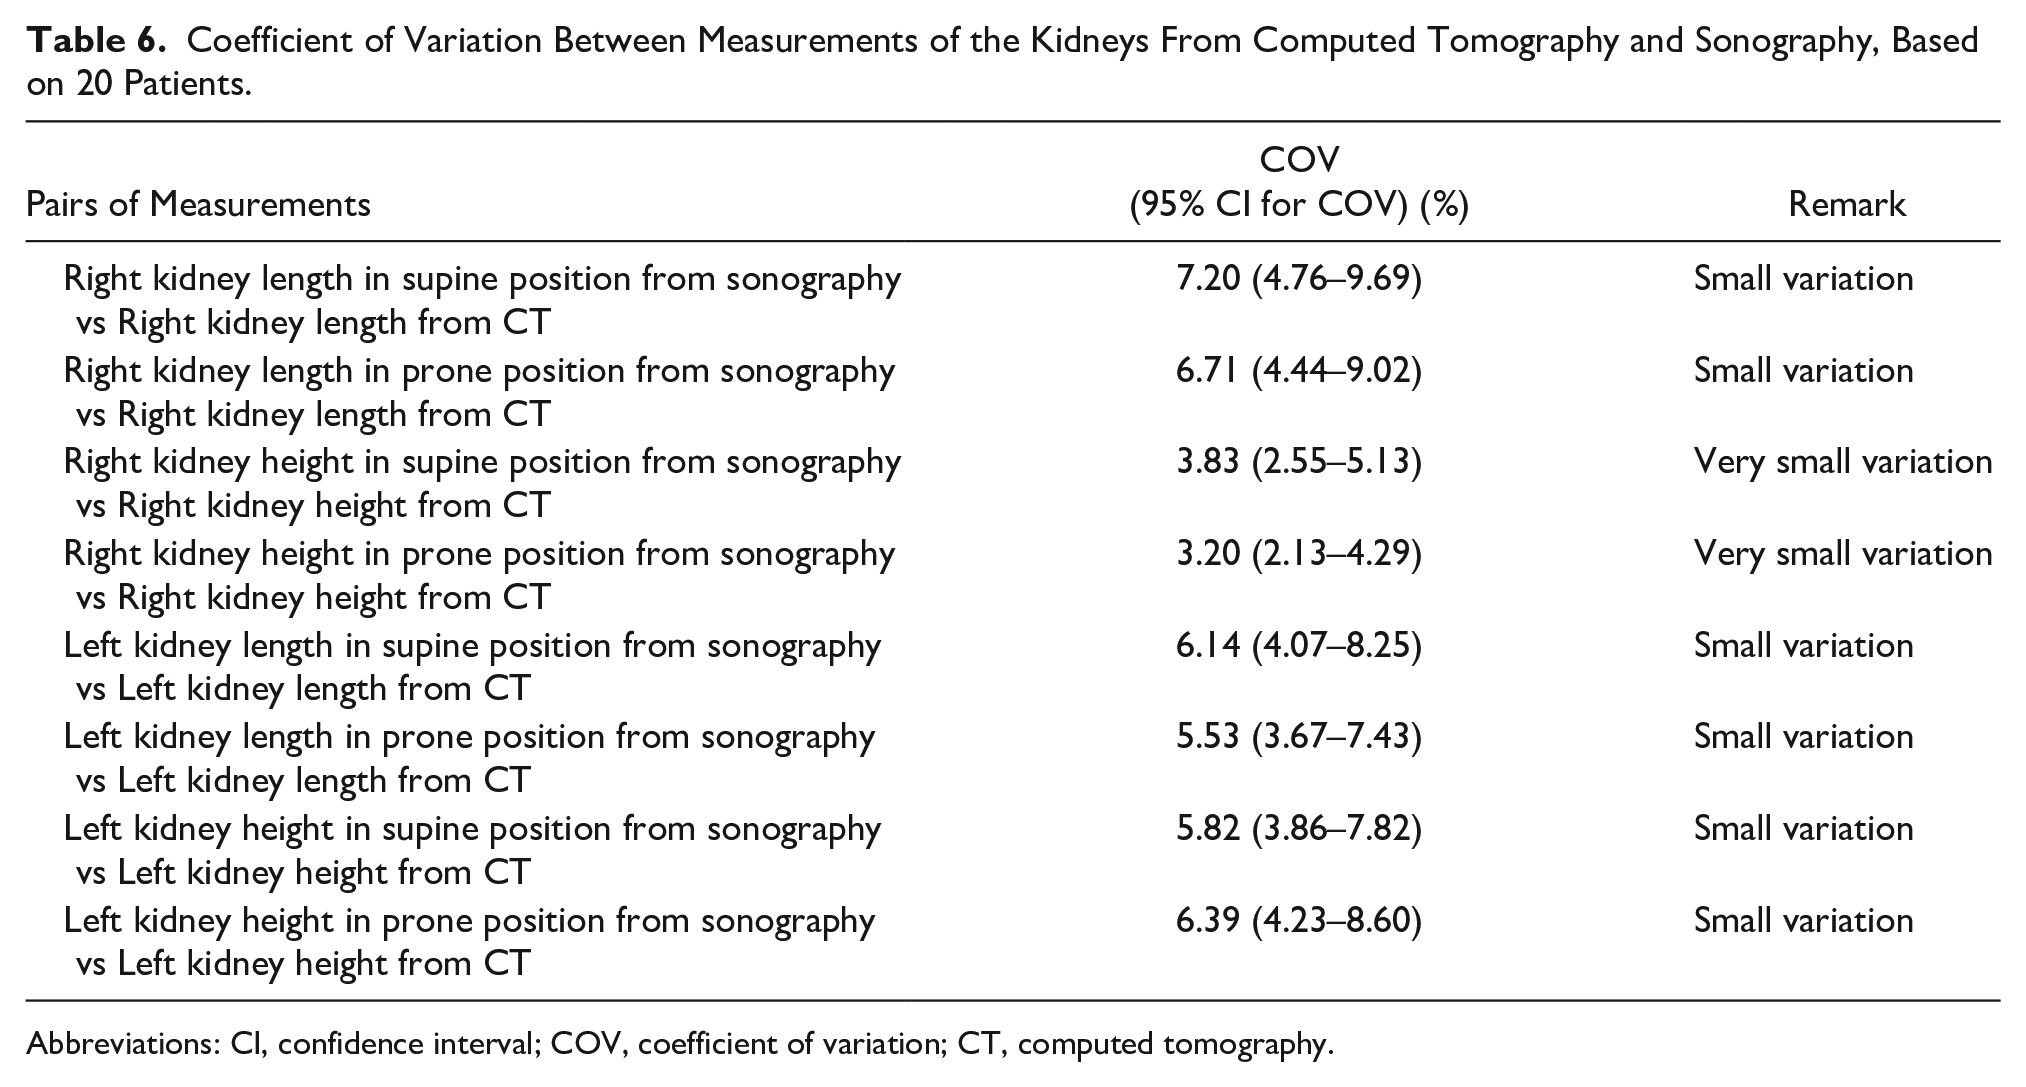
Abbreviations: CI, confidence interval; COV, coefficient of variation; CT, computed tomography.
Discussion
Diagnostic sonography relies mainly on the assessment of tissue texture, organ size, and contour to diagnose and monitor diseases. Accurate sonographic measurement of any organ entails that a standard method has been used. This is because organ size at sonography may be affected by patient position, imaging plane, age, and body habitus.8-11 A standard method means that a specified patient position and imaging plane are used consistently and any comparisons must take into account patient position and imaging plane. This notwithstanding, sonographers often adopt different methods for measuring the kidneys, often based on personal preference.
There are two popular measurement methods among sonographers, in our locality, for sonographic measurement of kidneys. The most common are the patient-supine and patient-prone methods. In this study, the objective was to discover if the methods of measuring kidney size were equivalent, based on the possibly of interchangeable use. In addition, there was an interest in knowing the method that was more accurate by comparing sonographic kidney measurements in both positions with CT measurements. Computed tomography is regarded as the gold standard in the measurement of kidney size, due to it being less affected by observer variability. Contiguous CTs are reliable, objective, and reproducible in the assessment of renal volume.12,13
In this study, all three methods were used to assess the agreement between measurements obtained during sonography for measuring kidney size. The ICC, COV for duplicate measurements, and the Bland-Altman plots14 were used to assess agreement between measurements. These statistical tools were chosen because Pearson product moment correlations have been erroneously used to reach conclusions on agreement in some studies.15,16 The most common mistake is the lack of checking the relationship between two continuous variables, which includes a scatter plot to check for linearity. This is why a correlation coefficient should not be calculated if the relationship is not linear. A high correlation does not necessarily mean that two measurement methods agree. 17 So, measurements from the two methods might be strongly correlated but not be statistically significant. Therefore, the P value is also a critical component of that statistical result. In view of these parameters, a set of alternative statistical tools were needed for a more complete assessment. The ICC, COV, and Bland-Altman plot are such tools. The ICC showed very high absolute agreement between the two methods of sonographic measurement of the kidneys. It also showed high absolute agreement between kidney measurements obtained at sonography by the two methods and those obtained at CT. The ICC is a good tool to assess agreement between two sets of data as it assesses one-to-one correspondence or consistency of the pairs of measurements. The results from the COV and Bland-Altman plot followed the same pattern as ICC.
The parameters related to the subjects that may affect the result of this study were evaluated. The subject-related parameters studied were BMI and AC. There was generally no difference in agreement between measurements in all the subclasses of the parameters; however, there were two exceptions. The left kidney lengths in supine and prone positions showed significantly better agreement in the overweight subjects, than the normal weight subjects. Also, the left kidney height showed better agreement in subjects with a wider abdomen, than in the subjects with a narrow abdomen. These two exceptions may be due to methodological issues with measurement and therefore requires further evaluation.
Conclusions
The measurements of the kidneys obtained with sonography using the patient-in-supine position and patient-in-prone position approaches were equivalent. There is no significant discrepancy in measurements if the supine or prone approach was used for these patients. So, in evaluating the kidney size at sonography, the patient-in-supine position and patient-in-prone position approaches might be used interchangeably. There were also strong agreements between measurements of the kidneys in supine and prone positions with CT measurements of the kidneys. These results suggest that sonography may be reliable in the measurement of kidney dimensions. Body mass index and AC showed a weak influence on the accuracy of left kidney measurements, taken in the supine and prone positions.
Footnotes
Declaration of Conflicting Interests
The authors declared no potential conflicts of interest with respect to the research, authorship, and/or publication of this article.
Funding
The authors received no financial support for the research, authorship, and/or publication of this article.