
Abstract
High blood pressure, screened with a patient’s blood pressure (BP), is found in 1 out of 3 adults in the United States. A cohort of 39 participants had BP measured following the American Heart Association (AHA) protocol, utilizing three different measurement devices: manual sphygmomanometer (MA), automated Midmark IQ vitals (IQ), and an automated Omron home unit (OM). All subjects had BP measured with the IQ device while not adhering to the AHA protocol. Two protocols were denoted PR (protocol following AHA guidelines) or TY (lacking protocol). Results demonstrated a mean systolic BP with IQ-TY > OM-PR > IQ-PR > MA-PR, all (p≤0.01). The mean diastolic BP for IQ-TY > IQ-PR, OM-PR, and MA-PR, with IQ-TY significantly higher than the other 3 (p≤0.01). Comparing participants categorized in each hypertension stage, IQ-TY categorized 7participants as stage 1 hypertensive while OM-PR categorized 3, and both MA-PR and IQ-PR only categorized 1. Study results suggest a potential for possible misclassification of patients based on BP protocol.
The purpose for assessing blood pressure (BP) is to determine a patient’s risk for cardiovascular disease. An elevated BP above 140 mmHg systolic is referred to as hypertension. Hypertension is a condition that exists when blood is consistently exerting too much force on the walls of the blood vessels. This indirect measure of the perfusion in the arms indicates a strain on the heart, blood vessels, kidneys, and other vital organs. Physicians in the 20th century gained the ability to measure BP and also suspected the adverse effects of hypertension, with few treatment options. 1 Prior to the implementation of certain medications, diet and exercise modification were the only treatments to manage hypertension. Untreated, hypertension can damage organs and vessels, and can increase the risk for a heart attack or stroke. 2 If left untreated, high BP can stay elevated for an extended length of time and cause longitudinal organ and vessel damage. 2 If hypertension is caught early, the detrimental effects can be limited or even eliminated through change of diet and lifestyle and/or use of medication.
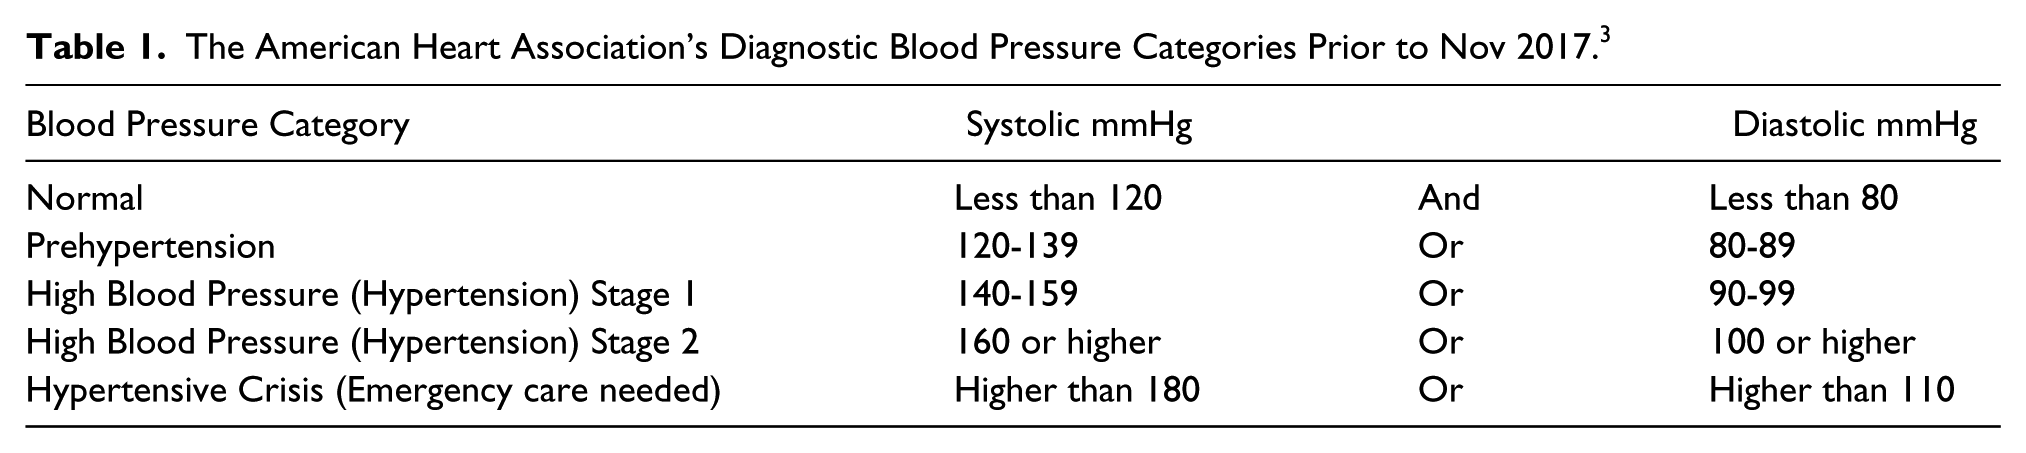
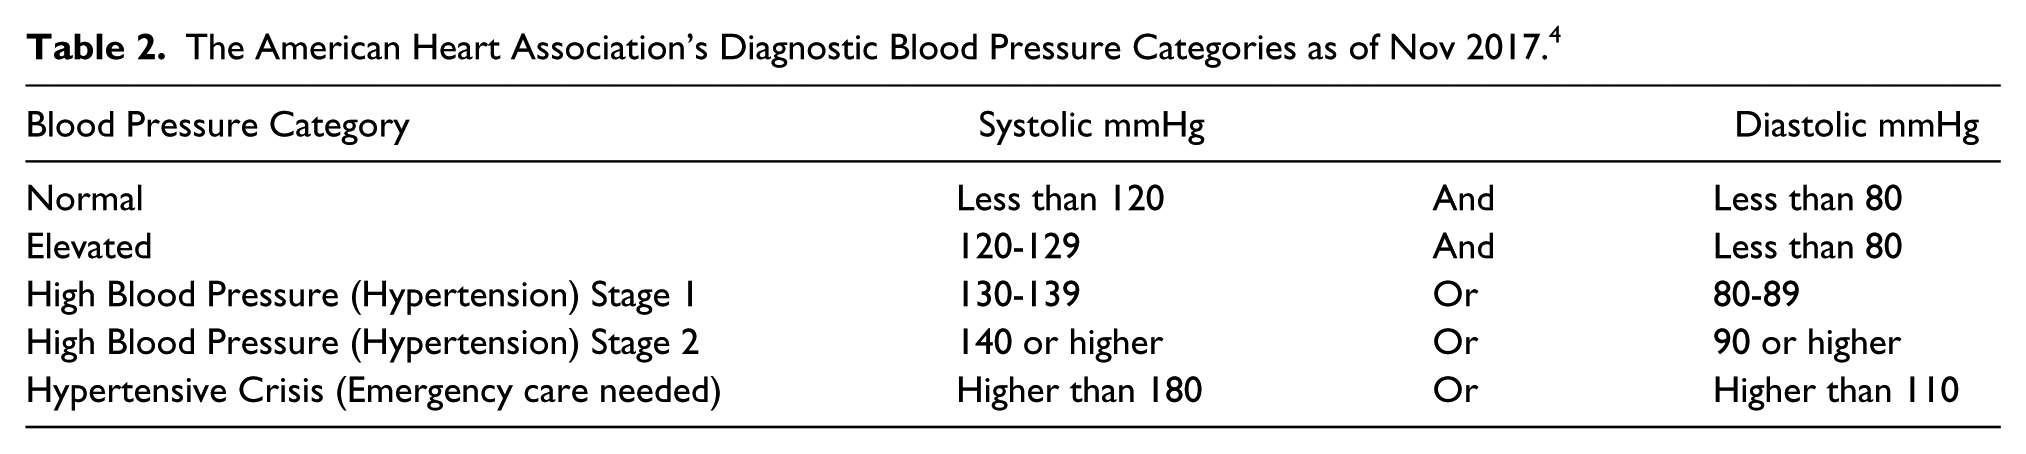
Establishing the value of measuring BP as a screening tool for hypertension was made clear by the American Heart Association (AHA). They published guidelines that categorize BP values for systolic and diastolic readings. The primary method for determining the stage of hypertension is measuring a patient’s BP. The AHA guidelines indicate that a normal BP measurement should be less than 120 mmHg for a systolic component and less than 80 mmHg for the diastolic component of the cardiac cycle. 3 Blood pressure diagnostic classifications are provided in Table 1, based on AHA guidelines prior to November 2017. Ultimately this can assist in developing a treatment plan for the hypertensive patient. Recently, in November 2017, the AHA released a new set of guidelines, which lowers the diagnostic criteria. The new classifications are provided in Table 2. 4 Under the previous categories 32% of the US population was considered hypertensive. Now nearly half the US population, 46%, are considered hypertensive. 5
The American Heart Association’s Diagnostic Blood Pressure Categories Prior to Nov 2017. 3
The American Heart Association’s Diagnostic Blood Pressure Categories as of Nov 2017. 4
Screening patients for suspected hypertension and corresponding cardiovascular disease is a US health initiative. The Centers for Disease Control reported that approximately 1 in 3 adults in the United States (over 75 million people) have high BP (Stage 1 or 2), based on the prior AHA guidelines. 6 Of those US adults, about half (54%) of them are being treated and have their BP under control. 6 This suggests that untreated/uncontrolled high blood pressure could be a factor contributing to the cardiovascular disease that exists in the United States. It also underscores the importance of being able to screen, treat, and monitor patients’ BP. This would suggest that the accuracy of recording the BP of hypertensive patients is paramount to properly categorize their stage of disease and initiate appropriate treatment.
Literature Review
Over the past couple of decades, the method of measurement for BP has seen major changes. Mercury manometers were considered the “gold standard,” but due to mercury’s toxicity the US Environmental Protection Agency (EPA) mandated that all mercury products be removed from hospitals by 2005. 7 Therefore, to be compliant, other methods of BP assessment, such as automated devices, were adopted in order to accurately assess hypertension and also to comply with the EPA mandate. Naturally, this shift has created concerns about the validity of automated techniques to accurately measure BP among providers who have been using manual techniques in their practice for years. 7 As the EPA mandate was taking effect, the AHA was revisiting their guidelines, as it had been over 10 years since they had last posted recommendations, over which time new information, technology, and techniques had surfaced.
Along with the EPA mandate, there was a major change in recording BP, which meant moving from fully auscultatory techniques with a mercury device to electronic transducers, and then finally adopting fully automated devices. In order to standardize measurements across the various types of equipment, Pickering et al. developed a standard protocol by determining how different positions affected BP readings, so that an accurate diagnostic measurement could be determined. Their findings indicated that the best position is for the patient to be seated with the feet and back supported, feet uncrossed, arm supported at heart level, cuff on bare skin, no talking or active listening, resting quietly and comfortably in a seated position for 3 to 5 minutes prior to measurement, with a proper deflation rate of 2-3 mmHg per second. 8 Failure to follow this protocol can significantly affect BP values. No back support has been shown to increase BP by approximately 6 mmHg. 8 Crossed legs increases BP by approximately 2-8 mmHg. 8 The arm not at heart level can change BP by 10 mmHg or more (arm above the heart decreases BP, while arm below the heart increases BP). 8 The study also found inaccuracies in BP due to improper cuff size and fear of the physician (also referred to as “white coat syndrome”), which is the elevation of a patient’s BP when a provider is in the room taking the measurement. This same protocol has been adopted and promoted by Johns Hopkins University, and is the preferred protocol for this study. Pickering et al. also discussed taking multiple measurements, stating the first reading is always the highest and there should be at least 1 minute between readings. 8
Accurate and reliable BP measurement protocols are important because it is a crucial measure of a person’s health. Improper BP measurements can have detrimental effects. In a case study published by Handler, a 72-year-old female patient had a recorded BP of 150/70 in the office but reported readings of 128/64 at home. 9 The following questions were posed as explanations for this disparity: whether or not the patient had “white coat syndrome,” the measurement in office was incorrect, or the measurement at home was falsely reported. The difference in home and office measurements for this patient corresponded to a diagnostic decision between pre-hypertensive and stage 1 hypertension, which could have led to prescribing BP medication. An investigation determined that improper protocol was the cause of the elevated BP office reading due to talking and active listening during the measurement. 9
As the popularity of automated blood pressure measurements increases, they are beginning to replace manual sphygmomanometers (devices used to measure BP) in clinical practice. Myers et al. investigated this trend through analysis of previous comparison studies. When manual BP readings performed in a controlled research environment were compared to manual BP readings performed in a typical provider office visit, the clinical office readings were on average 10 to 5 mmHg higher for systolic and diastolic readings, respectively. 10 Was the change due to lack of protocol, varied skill of the professional taking the measurement, or other variables? Myers et al. examined studies comparing automated and manual office BP to measures indicating possible target organ damage. A significant correlation was found between the automated BP unit and target organ damage, but not with the manual unit. 10 In order for the difference in association between the equipment, the BP readings had to be varied. An investigation by Myers et al. concludes that there is little reason to continue use of manual BP readings in clinical practice. They believe automated units and home BP units produce better results than the manual readings obtained in clinical practice. 10 Overall the literature has little evidence directly comparing an automated unit, a manual unit, and a home BP unit together in a controlled manner. Further, a comparison of BP measured with an automated BP device strictly following the AHA protocol compared to BP measured with an automated BP using more common clinical practice has yet to be performed. The current study was devised to investigate the relationship between manual, automated clinical, and automated home BP measurement devices, as well as the effect of protocol divergence on BP measurements, and the effect of resting time prior to measurement. The following hypotheses were proposed:
There is no difference in BP measurements taken using a manual sphygmomanometer, a clinical vitals automated unit, or an automated home unit.
There is a difference in BP measured following the AHA protocol and traditional protocol that lacks AHA protocol rigor. 2.1: There is a difference in BP measured at time 0 (Trial 1) and BP measured at time 8 (Trial 5), during traditional clinical BP measurement, specifically testing the effect of 3-5 minutes of rest on measured BP.
Materials and Methods
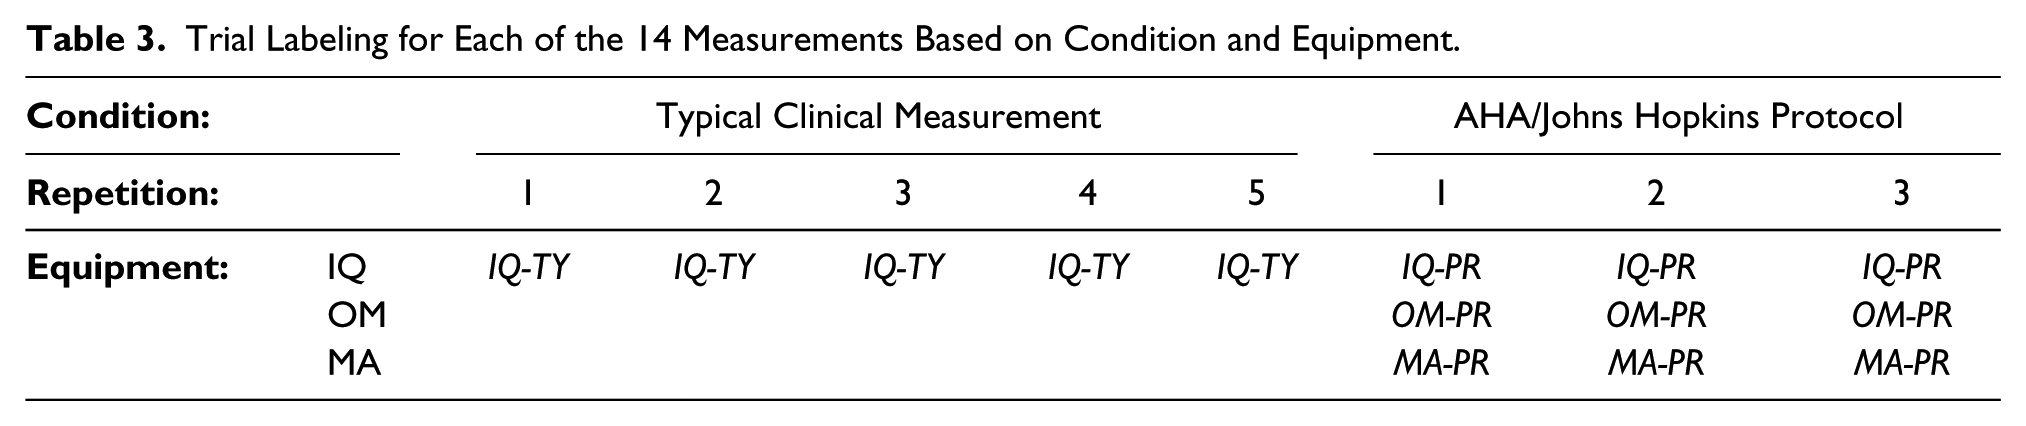
The study employed a repeated measures design to examine the effects of three independent variables: measurement device (3 levels: manual sphygmomanometer, clinical vitals automated unit, and automated home unit), protocol (2 levels: AHA protocol and typical clinical), and resting time. The variables were not fully crossed; see Table 3. This pilot study adopted the AHA/Johns Hopkins University protocol for recording BP in order to compare measurement devices. Protocol effect was assessed by comparing AHA protocol BP to BP measured while not adhering to the AHA protocol; this effect was only examined using the clinical automated device. Thirty-nine individuals participated in the study, which was approved by The Ohio State University’s Institutional Review Board.
Trial Labeling for Each of the 14 Measurements Based on Condition and Equipment.
The devices used in the study were a Tycos Jewel Movement manual sphygmomanometer, a Midmark IQVitals automated clinic vitals measuring device, and an Omron (model: BP742) automated home BP measurement device. The study consisted of three different parts: consent process, common clinical measurement, and baseline data measurement.
The independent variables were the types of equipment used to record the BP, as well as following the protocol vs non-protocol. The types of equipment were coded as MA (manual sphygmomanometer), IQ (Midmark’s IQvitals automated), and OM (Omron home automated unit). The conditions were coded as PR (adherence to protocol, the ‘baseline’ data) and TY (typically observed in the clinical setting, the ‘typical clinical measurement’). Due to time restraints imposed by participant consent, IQ was the only equipment used to test the TY condition. All the equipment was tested in the PR condition. The type of equipment was coded as a categorical variable. The dependent variable was the recorded BP measurement, therefore this is ratio data.
Effects of protocol conditions and equipment were examined in this study by collected data in the marked cells of Table 3. Typical clinical measurements (TY) were compared to protocol (PR) measurements using only the Midmark IQVitals (IQ) automated measurement device; this allowed assessment of effects of protocol method. Equipment effect was assessed by comparing measurements made using the Midmark IQVitals (IQ) automated device, Omron (OM) automated device, and a manual sphygmomanometer (MA), using the AHA/Johns Hopkins protocol (PR).
Statistical Analysis
The data was analyzed to check for normality. Given the data were normally distributed, descriptive statistics were reported using means, medians, and standard deviations. A priori, the statistical significance was set at p
Hypothesis 1 (the effect of equipment): an analysis of variance (ANOVA) was performed to compare the differences in the measurements of BP using a manual sphygmomanometer, the IQvitals, and the Omron home unit.
Hypothesis 2 (the effect of condition): a paired t-test was performed to compare differences in the measurement of BP following AHA protocol with the IQvitals and lack of protocol (traditional) with the IQ vitals. Hypothesis 2.1 (effect of rest time): a paired t-test was anticipated to compare differences in measured BP in trial 1, immediately after sitting down, and in trial 5, after 8 minutes of rest; this was only tested for the traditional protocol.
Results
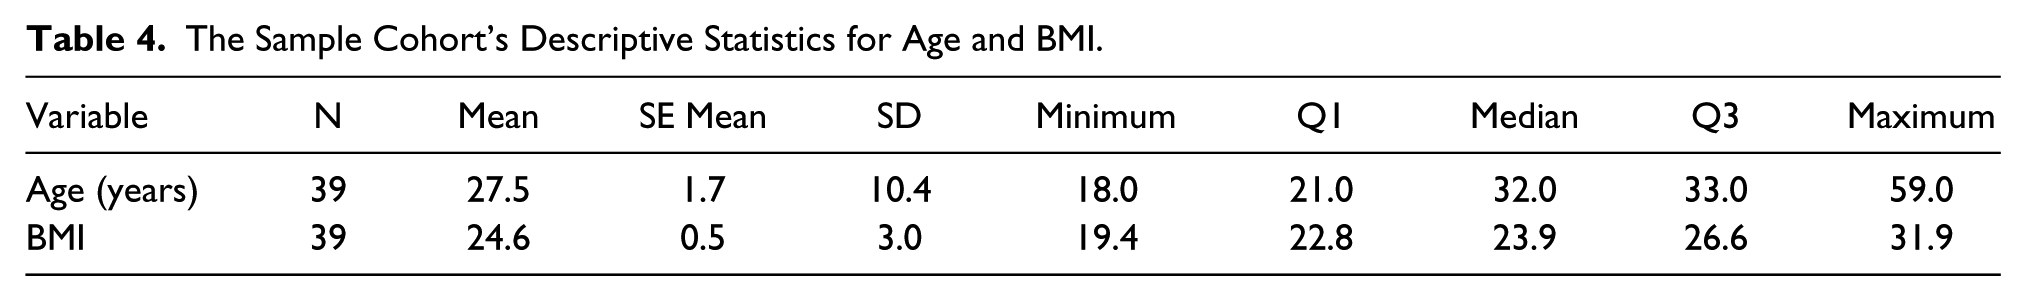
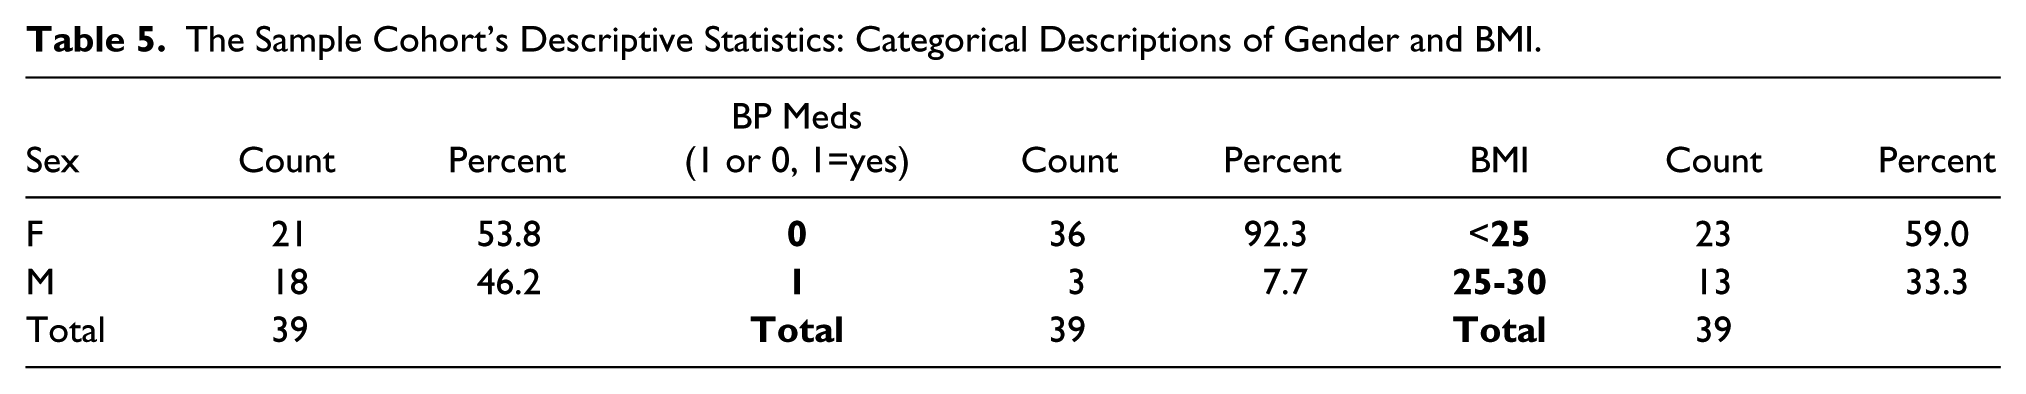
Demographic data from the sample of 39 participants is displayed in Tables 4 and 5. The majority of the participants were young adults with a median age of 23 years with an even distribution of males (46%) and females (54%). Despite the majority of participants being in their twenties, there was a wide range of ages, 18-59 years. Over half the participants were at a healthy weight (59% < 25 BMI) and only 8% of the participants took BP medication.
The Sample Cohort’s Descriptive Statistics for Age and BMI.
The Sample Cohort’s Descriptive Statistics: Categorical Descriptions of Gender and BMI.
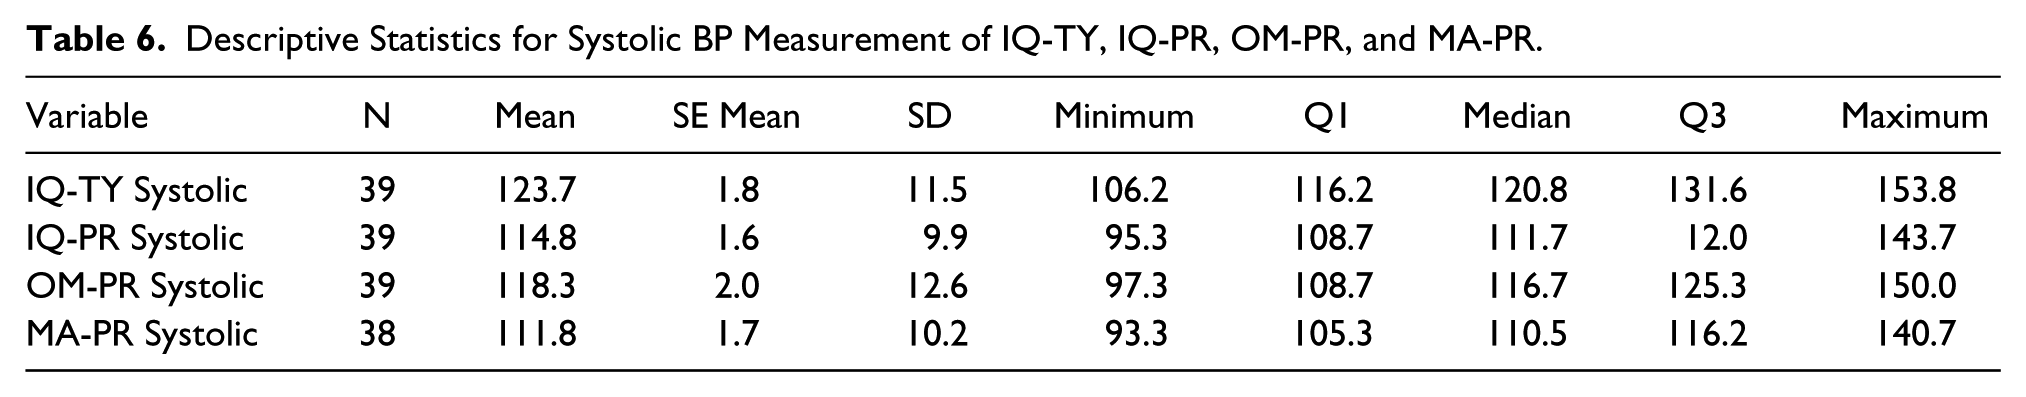
The descriptive statistics for the systolic (SYS) and diastolic (DIA) BP measurement for each type of equipment is displayed in Tables 6 and 7. The systolic BP endpoint had a highest to lowest value recorded, based on equipment type. Looking only at equipment, the ranking of the systolic BP endpoint had the highest value with OM-PR, followed by IQ-PR. The lowest value was MA-PR. The comparison of all the systolic endpoint data, based on equipment type, showed that all were statistically significant (P<0.001). MA-PR has 38 instead of 39 data points because there was an outlier at 82.7 mmHg. The diastolic BP endpoint had a similar highest-to-lowest value range recorded, based on equipment type. The ranking of the diastolic BP endpoint had the highest value recorded, with IQ-PR followed by OM-PR. The lowest value was MA-PR. The comparison of all the diastolic BP endpoint data, based on equipment type, produced no statistical difference between diastolic BP.
Descriptive Statistics for Systolic BP Measurement of IQ-TY, IQ-PR, OM-PR, and MA-PR.
Descriptive Statistics for Diastolic BP Measurement of IQ-TY, IQ-PR, OM-PR, and MA-PR.
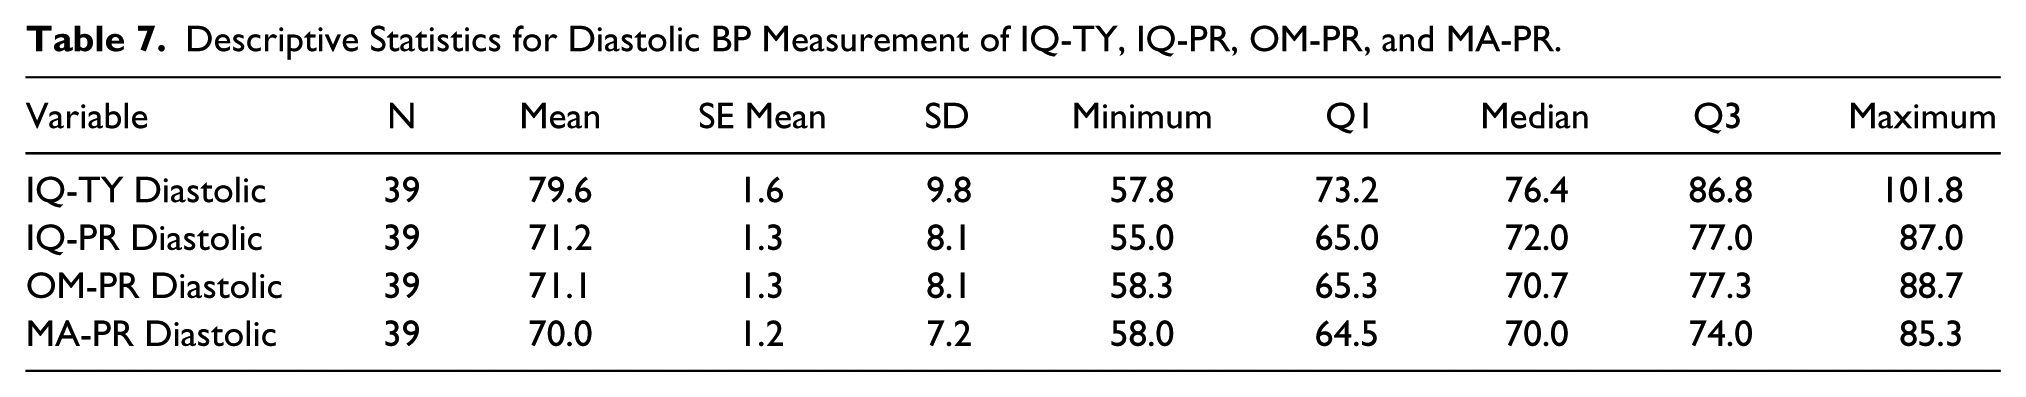
The descriptive statistics for comparison of condition can also be found in Tables 6 and 7. IQ-TY was found to be significantly higher than IQ-PR for both systolic and diastolic BP.
Figure 1 demonstrates a comparison of rest time when reviewing IQ-TY’s first systolic BP endpoint, at time 0 (measurement 1), compared to the last systolic BP endpoint, at time 8 minutes (measurement 5), as well as the first diastolic BP endpoint, at time 0 (measurement 1), compared to the last diastolic BP endpoint, at time 8 minutes (measurement 5). The decrease from the first to last measurement was found to be statistically significant for both systolic (-7.33, P<0.0001) and diastolic (-2.87, P=0.005).
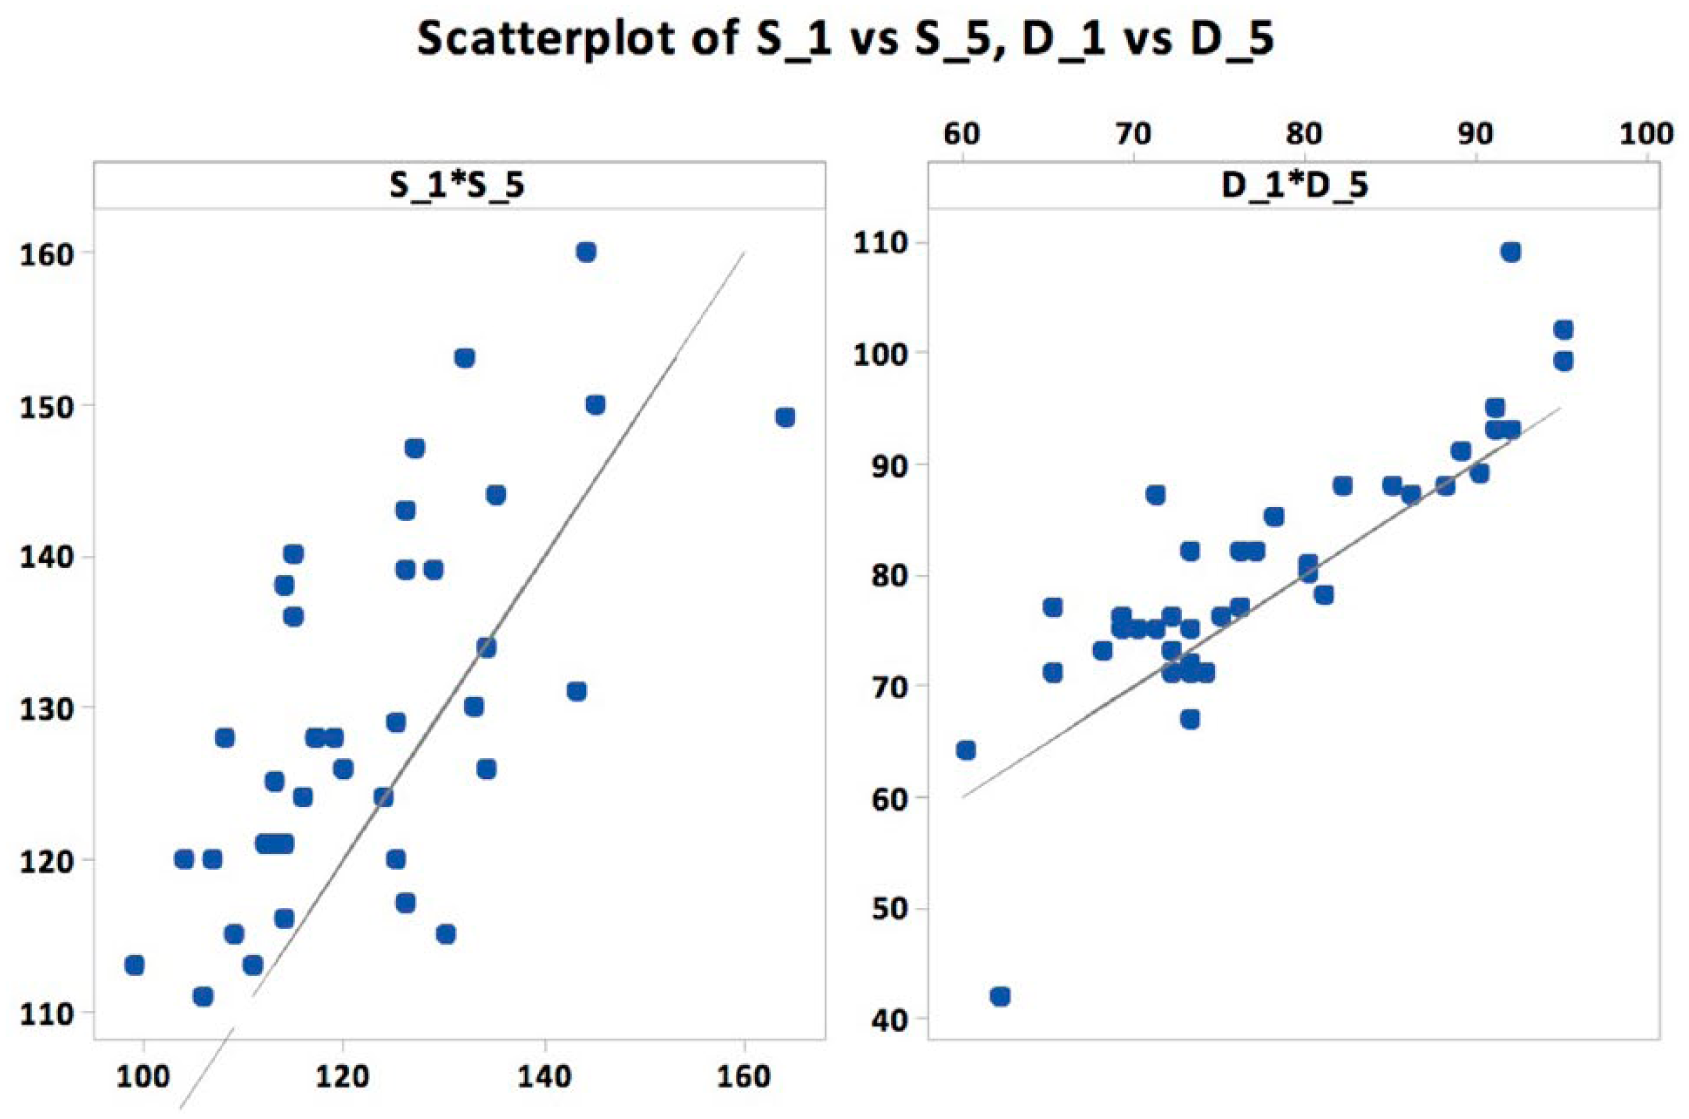
IQ-TY BP collected from Trial 1 vs Trial 5.
Additional statistical analysis was performed to further evaluate the data and associated findings. The matrix plots in Figures 2 and 3 visually compare the systolic and diastolic BP measurements, respectively, across each type of equipment. The line on each graph represents where the data point would be if the same BP measurement value was recorded for the conditions compared. MA-PR produced systolic BP measurements that were lower than all the other methods, for nearly all the participants (See Figure 1, bottom row). OM-PR recorded higher systolic BP measurements than IQ-PR (See Figure 1, row 2 column 3). A similar ranking of data was noted when reviewing the diastolic BP measurements, though the diastolic endpoints taken with IQ-PR, OM-PR, MA-PR all appear to be much closer in value than the systolic endpoints.
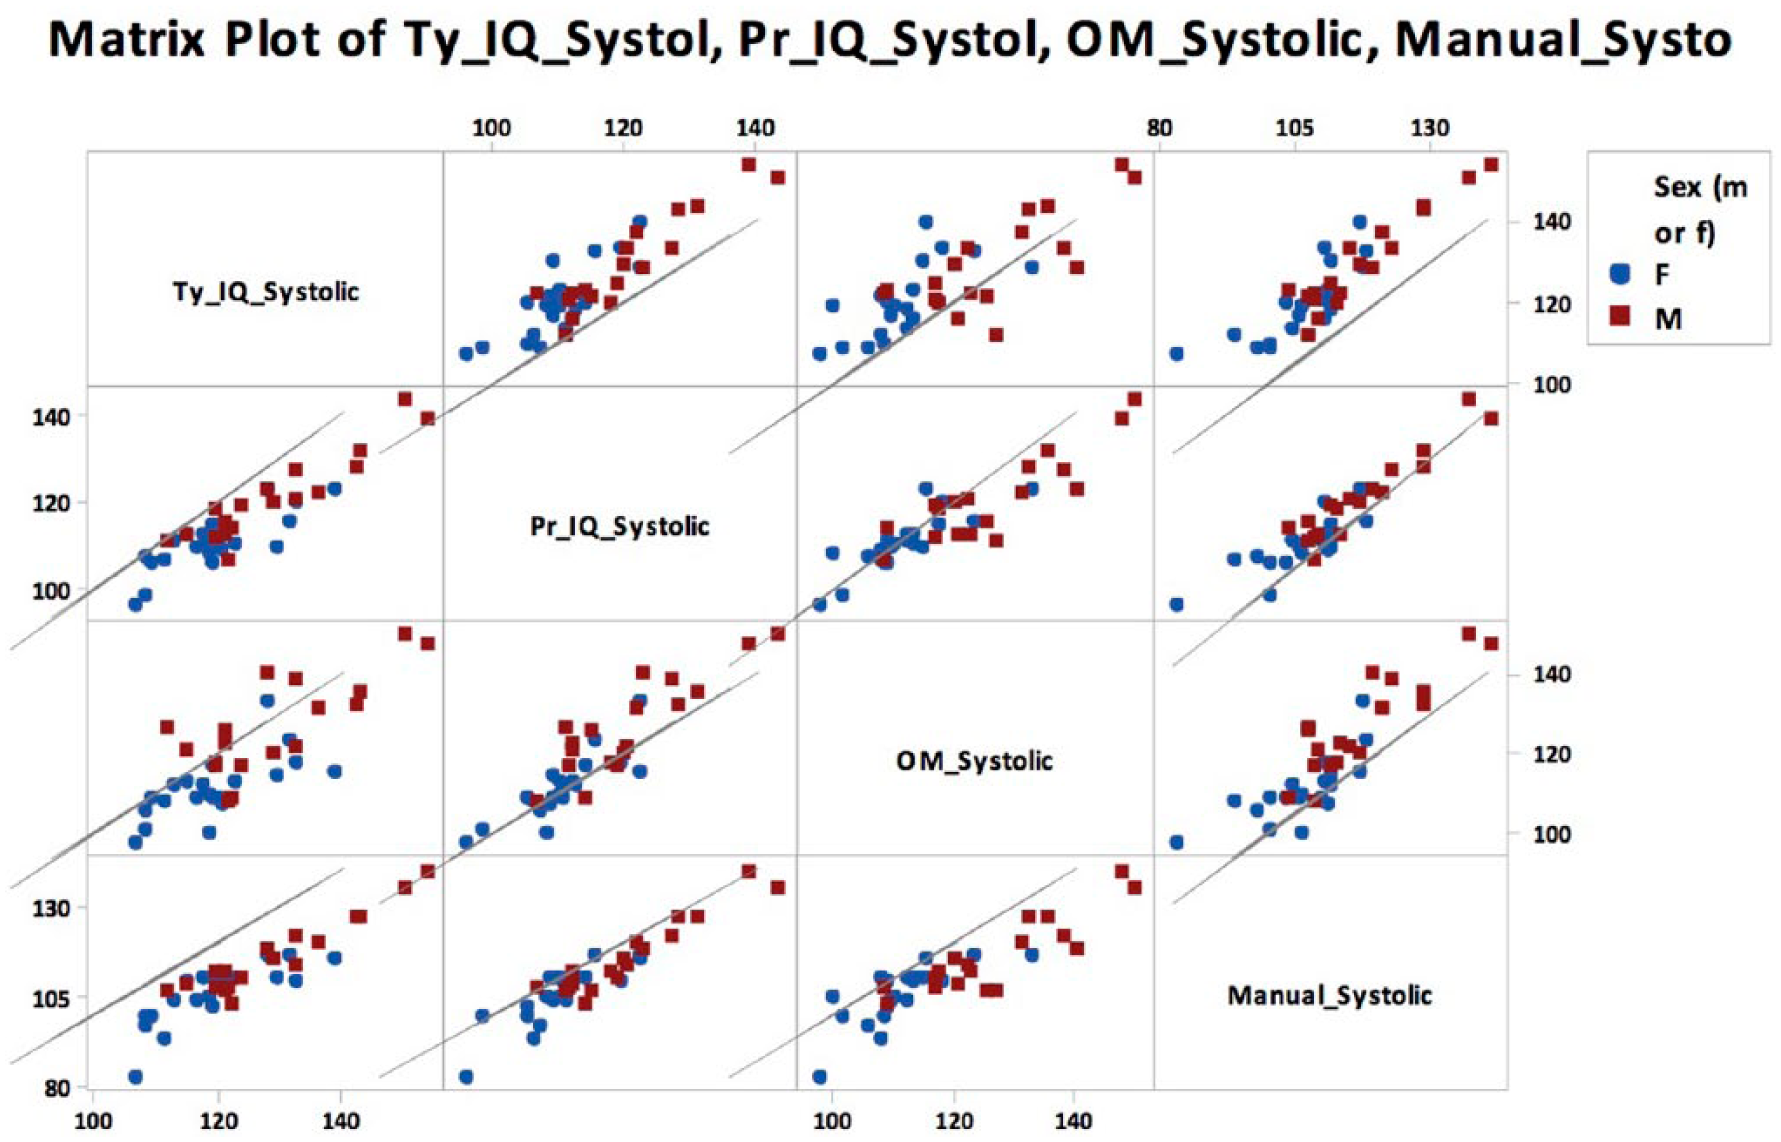
Systolic comparison between equipment and conditions, separated by gender.
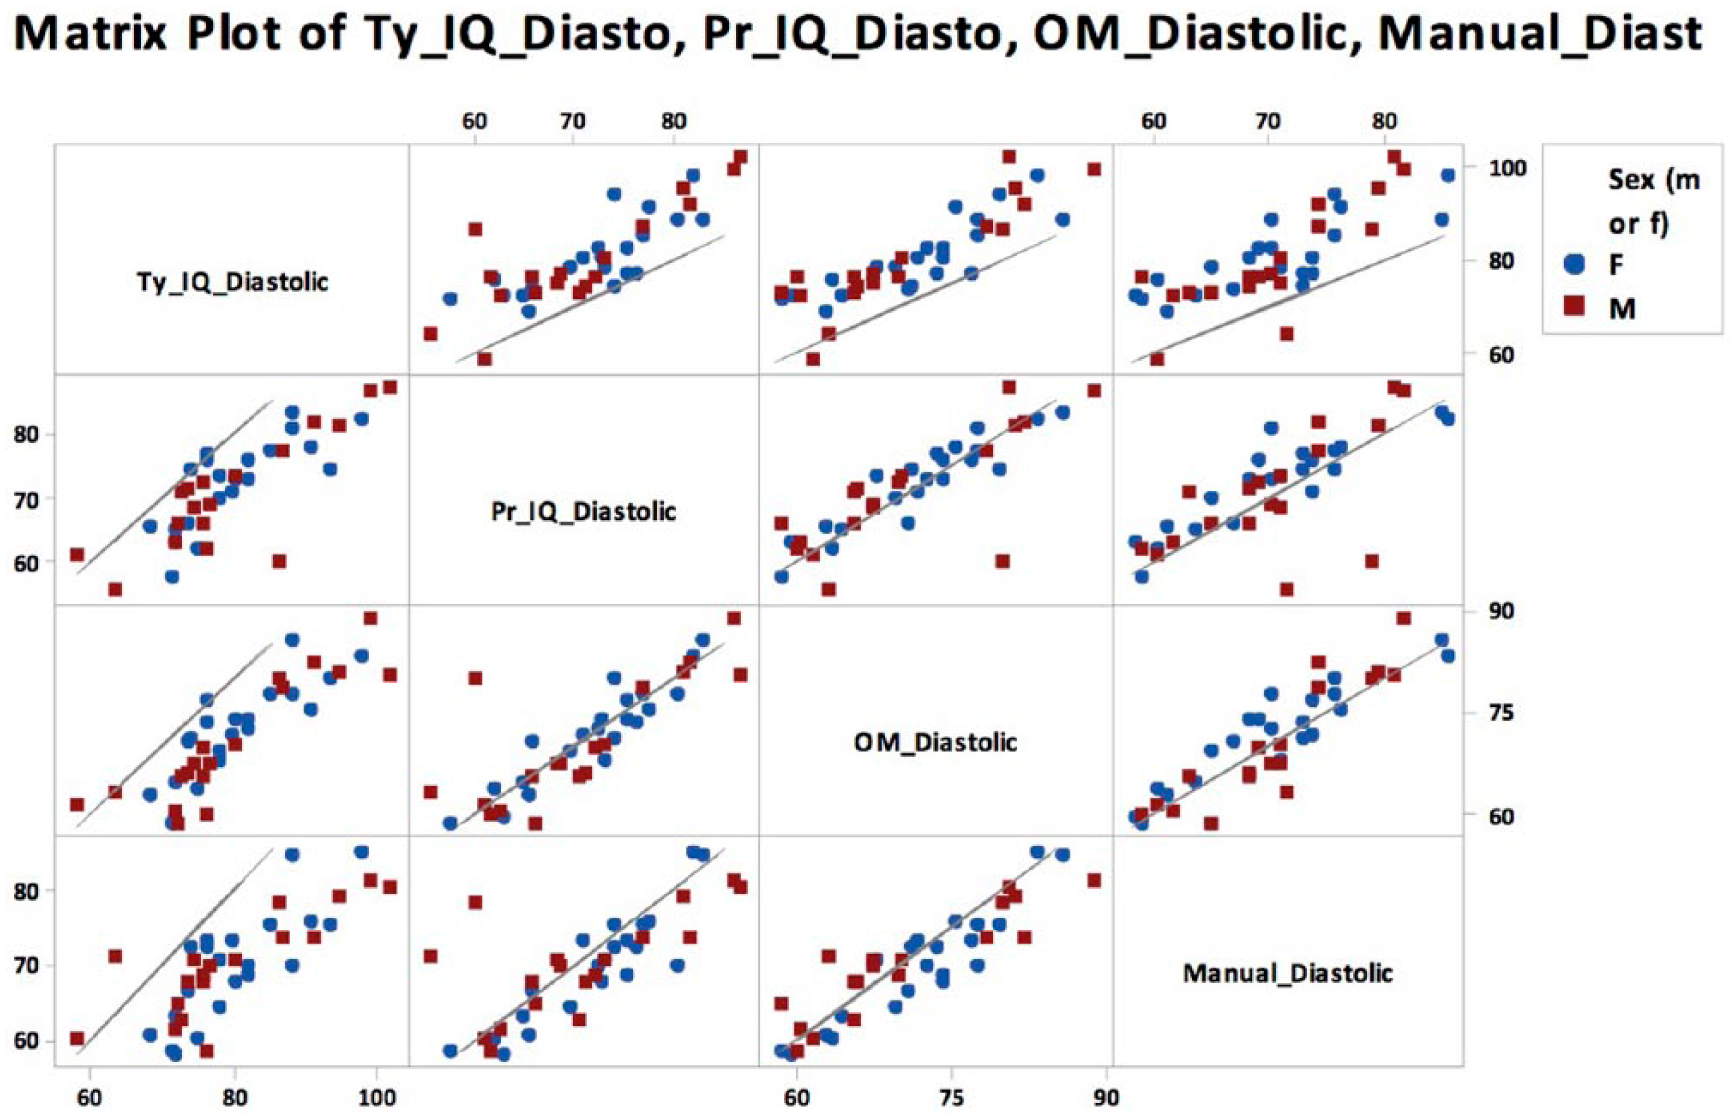
Diastolic BP measurement comparison between equipment and conditions, separated by gender.
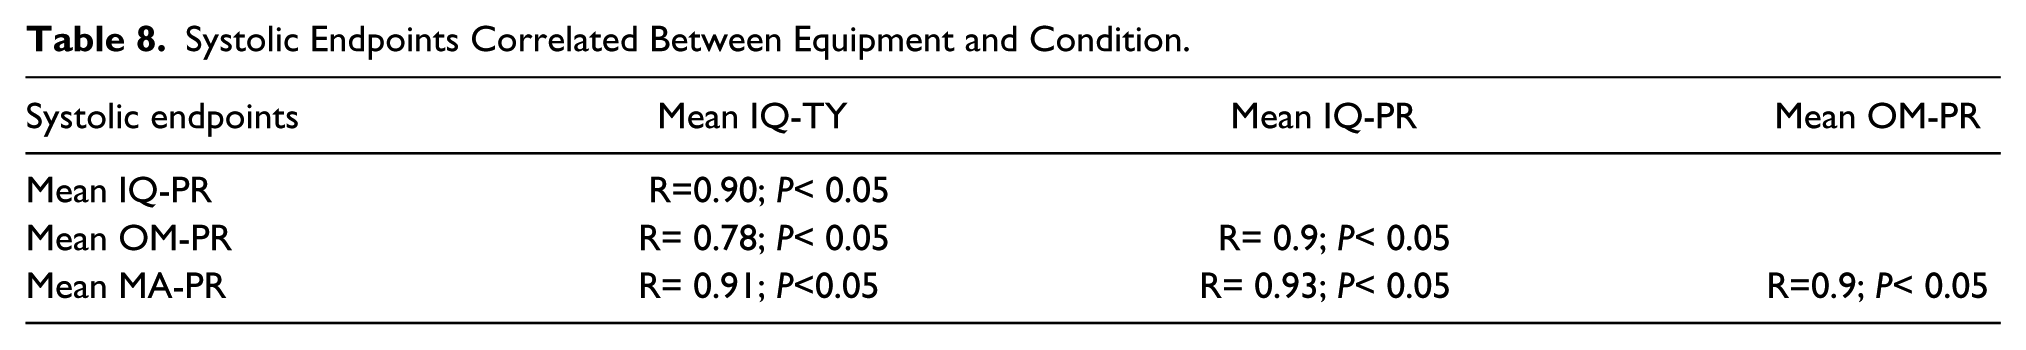
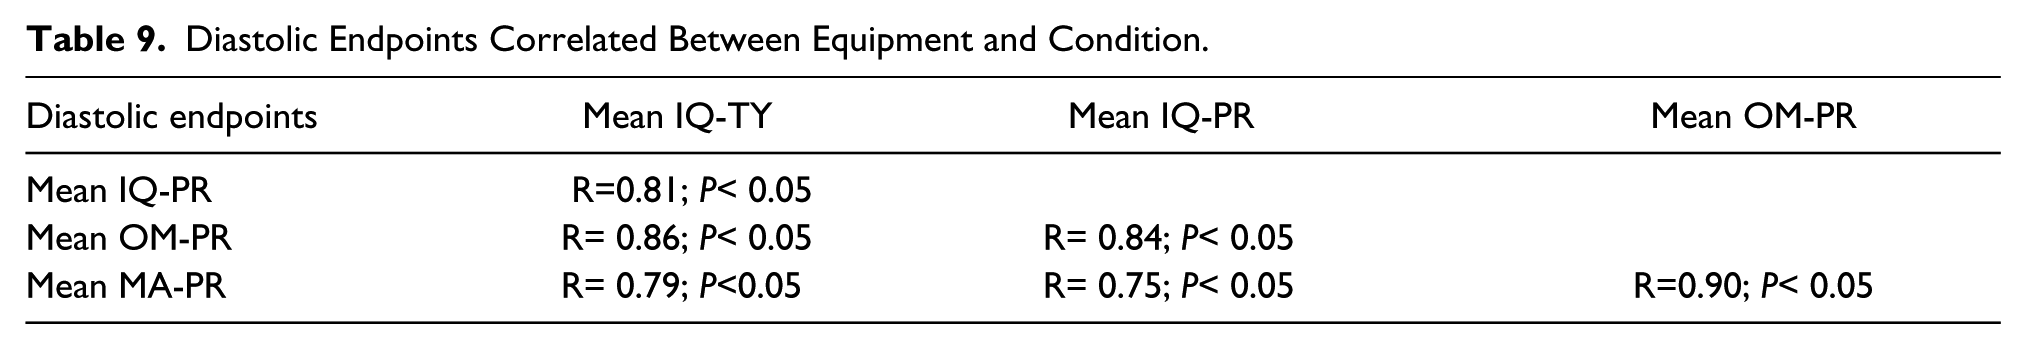
It was decided to add strength of association between each equipment type used to measure systolic and diastolic endpoints. Tables 8 and 9 provide the correlation coefficient and statistical significance when comparing the equipment type for recording systolic and diastolic BP measurements. Measurements made with the different devices were highly correlated, with most having a strength of association around 0.9. The only comparison that was noticeably different was the correlation between OM-PR and IQ-TY, which was still strong at 0.78. Similarly, the diastolic BP endpoint taken with the different devices demonstrated a similar strength of association with coefficients between 0.8 and 0.9. All the correlations were statistically significant (P<0.05).
Systolic Endpoints Correlated Between Equipment and Condition.
Diastolic Endpoints Correlated Between Equipment and Condition.
The pooled standard deviations for systolic and diastolic blood pressure across all three types of equipment are displayed in Figure 4. Based on observation, each subject appeared to have a wide range of readings. Comparing the measurement variance from repeated measures, as displayed in Table 10, the IQ vitals unit had the most measurement variance. The measurements taken with IQ-PR had the most systolic measurement variance of 4.1 mmHg. The measurements taken with IQ-PR had the most diastolic measurement variance of 6.3 mmHg. The MA-PR use had the least systolic measurement variance while OM-PR had the least diastolic measurement variance.
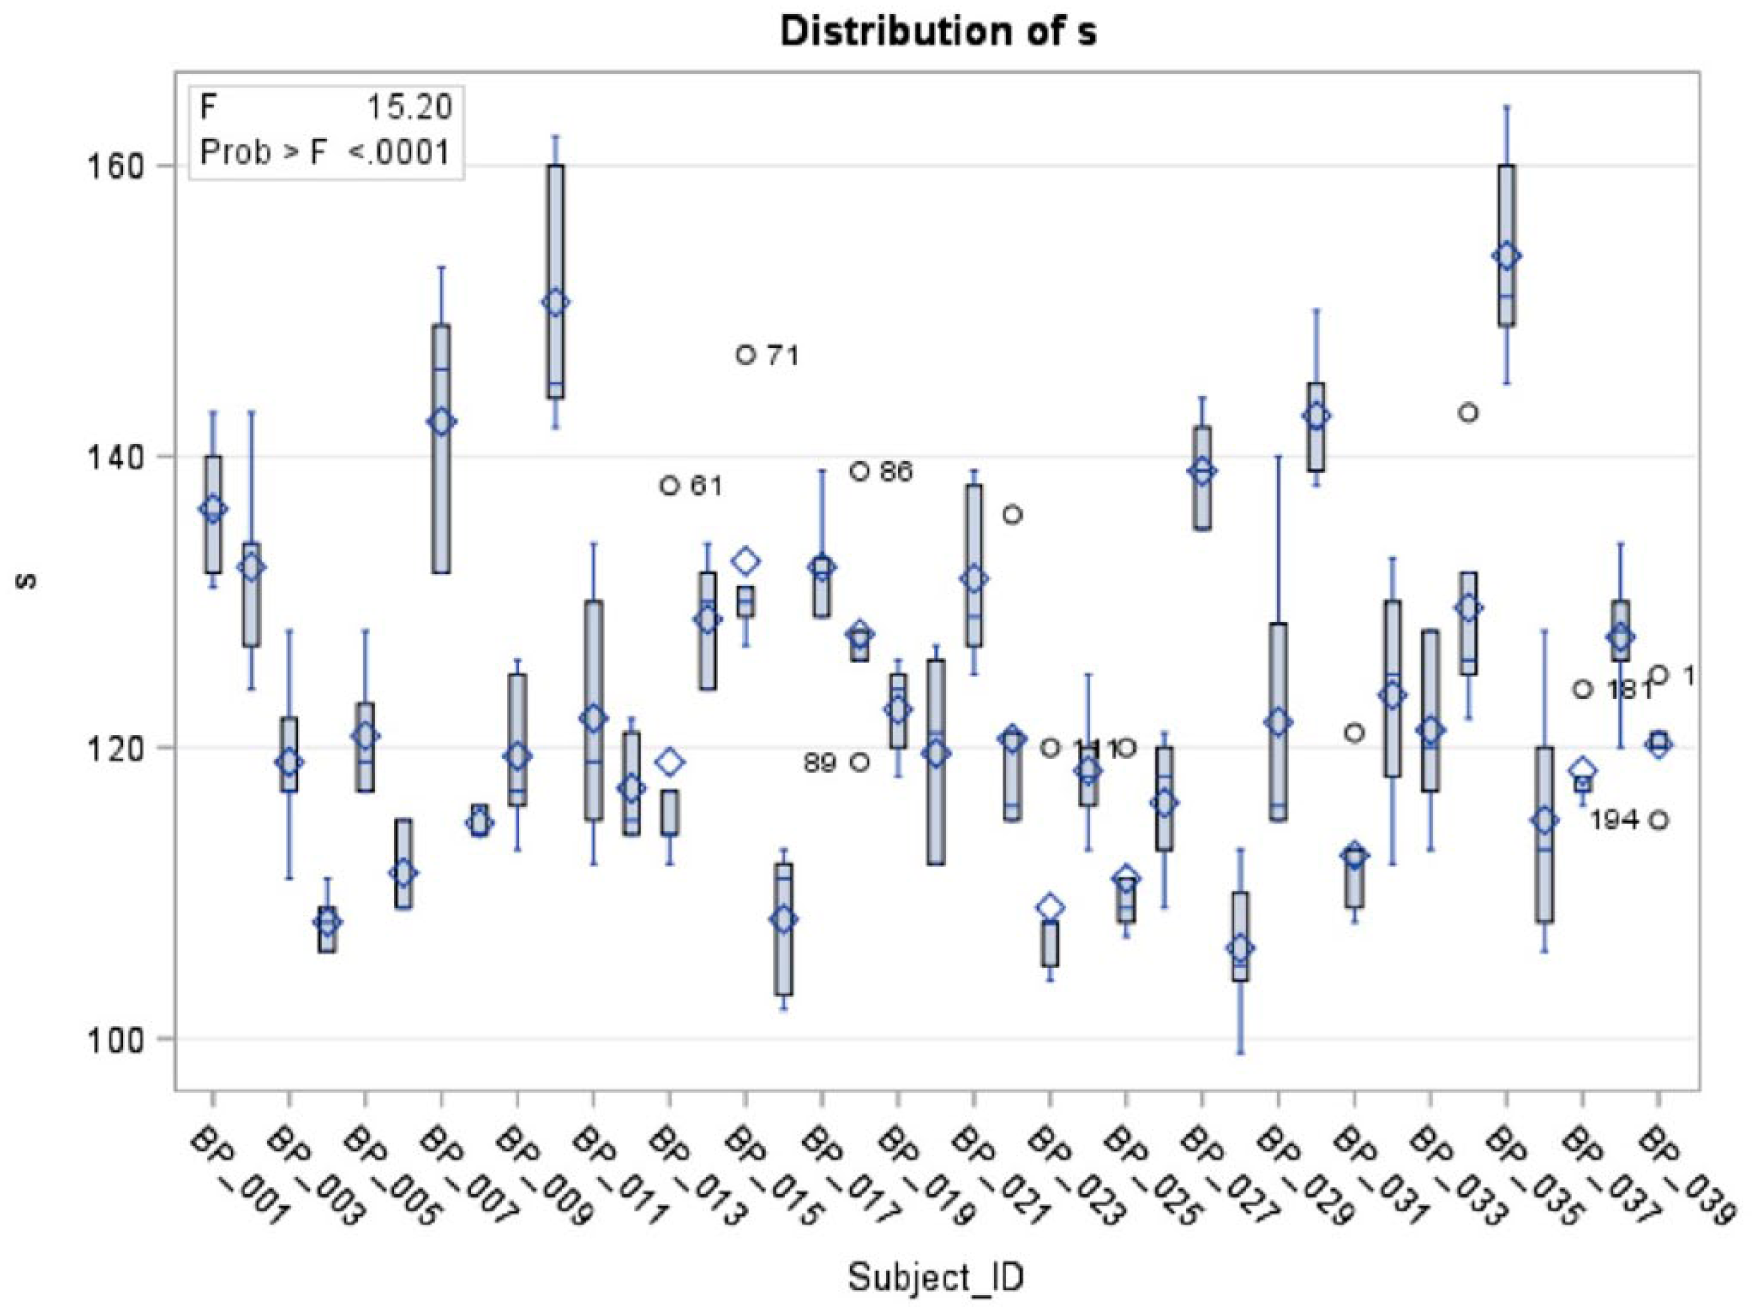
Pooled standard deviations for systolic and diastolic pressure.
Equipment and Protocol BP Measurement Error.
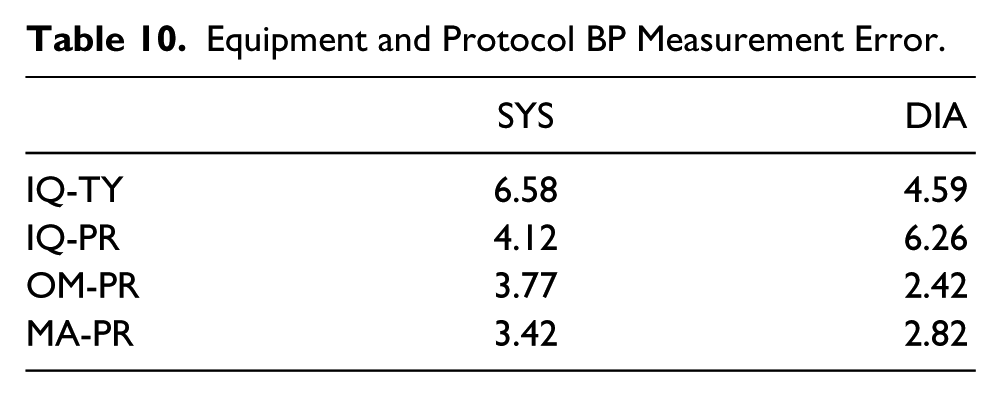
Figure 5 demonstrates how each participant would be classified using the current AHA hypertension guidelines. The MA-PR equipment measurements classified most of the participants as having a normal BP (N=31), while the IQ-PR data classified fewer participants as normal (N=28). The use of OM-PR for generating BP data classified participants differently with the cohort as normal (N=24), elevated (N=12) and stage 1 hypertension (N=3). Based on equipment, OM-PR classified more participants as both prehypertension and stage 1 hypertension compared to IQ-PR and MA-PR.
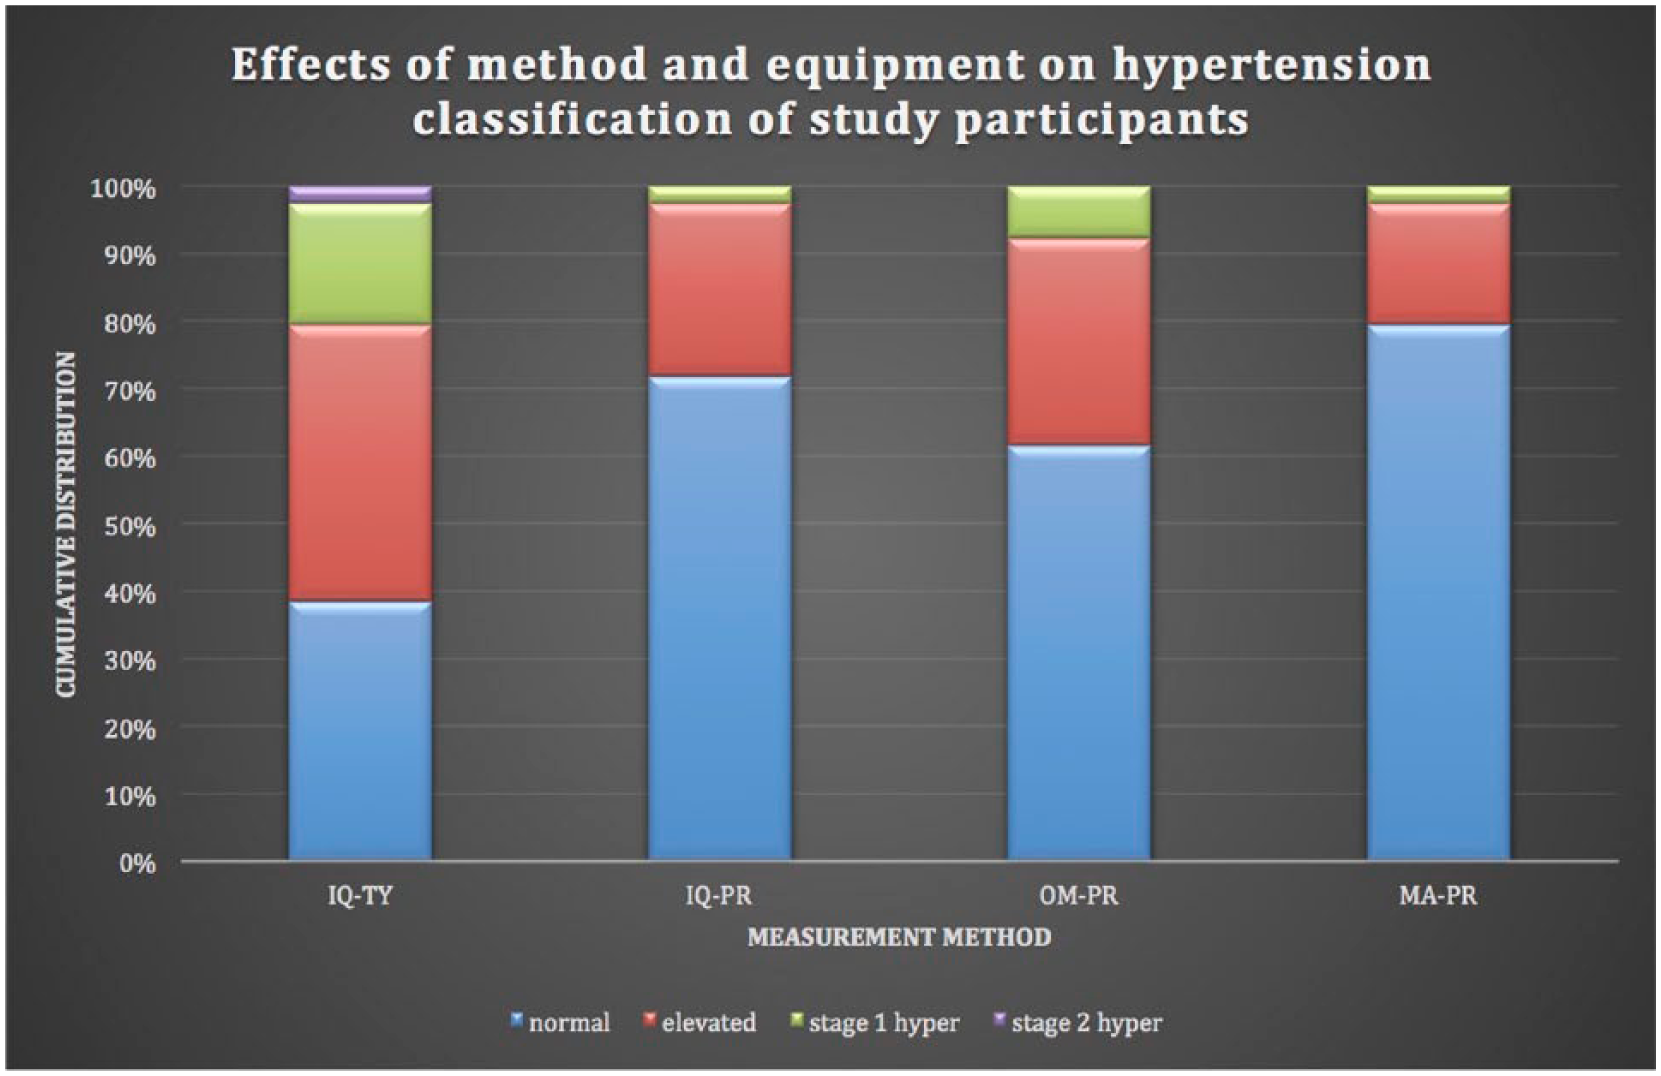
The cohort’s classification using the current hypertension categories of the American Heart Association.
The same additional measures used to compare the equipment were also useful to compare the different conditions. Referring to the top row in Figure 2, IQ-TY produced systolic BP measurements that were higher than the other methods for nearly all the participants. In Tables 8 and 9 it can be noted that IQ-TY had a high significant correlation between all the equipment for both systolic and diastolic BP measurements. The lowest correlation was 0.8. In Table 9 the measurement variance for IQ-TY can be seen as 6.58 mmHg for systolic and 4.59 mmHg for diastolic. The systolic was higher while the diastolic had a lower measurement variance compared to IQ-PR. When using IQ-TY to classify participants in hypertension stage, the data generated classified participants as either normal (N=15), elevated (N=16), stage 1 hypertension (N=7), or stage 2 hypertension (N=1) as seen in Figure 5. IQ-TY classified the most people as pre-hypertensive, stage 1 hypertension, and was the only method to have an individual as stage 2 hypertension compared to all the other equipment.
Additional data analyses were completed to determine the strength of relationship between the difference of IQ-PR and IQ-TY based on gender, BMI, BP medication, or age. None of these additional comparisons proved to be statistically significant. When considering that participants were allowed to talk during the BP data collection, this condition did not prove to significantly increase systolic BP. The average increase in the systolic BP endpoint due to talking was only 0.83 mmHg, with a standard error of 1.11 (P=0.46). However, allowing participants to talk during the BP data collection did prove to significantly increase the diastolic BP endpoint by an average increase of 1.88 mmHg with a standard error of 0.7 (P=0.01).
An intraclass correlation coefficient (ICC) was used to determine the reproducibility of the data obtained; for the systolic measurement it was 0.87 and for the diastolic it was 0.81.
Discussion
This cohort was recruited from a medical campus of college-aged students and employees of various ages and backgrounds. With 54% of the participants being female, mean age of 27.5 years, and an average BMI of 24.6, this cohort of participants appears to have a lower BMI in comparison to the average BMI of the US population, which is 26.5. 11 Along with a healthier body composition, this cohort of participants also had lower hypertension trends than the US population. The US trend, under the old guidelines (BP 140/90 or above) for hypertension among those 20 years and older was 30%, however in the survey, most in the cohort were older. 12 In that same survey group, those 20-44 years of age, which is more comparable to the current pilot sample of participants since the mean age was 27.5, had a rate of hypertension of 12%. 12 This was based on the old guidelines, so this number would be even higher if the new guidelines were used. Basing hypertension purely on a BP measurement of 140/90 or higher (using the old guidelines so that an even comparison can be made), no participant was hypertensive when following protocol on any type of equipment. The US trend for hypertension also indicates 33% of those 20 years and older are at risk for hypertension. 12 This risk for younger people is alarming and careful detection of an elevated BP is a means towards addressing the tendency for developing cardiovascular disease.
Blood pressure is a vital sign taken by providers in outpatient and inpatient facilities, serving as an indicator for numerous diseases ranging from the common cold to serious cardiovascular disease. Elevated blood pressure itself has the potential to lead to dangerous conditions such as stroke or heart attack. The significant discrepancy between equipment and protocol should underscore the need for consistency and accuracy when this critical vital sign is being measured.
First, taking the equipment into consideration, in the past several decades there has been a trend away from manual and towards automated BP measurement. With this transition came resistance due to not knowing how to handle potential discrepancies in the biometric data. Was the machine or the provider the source of inaccuracy? Based on the results of the current study, there was a significant difference between devices for the systolic BP, but not for the diastolic BP. The home unit had the highest BP measurements, while the manual had the lowest. Due to the ordered (OM-PR>IQ-PR>MA-PR) significant difference for systolic BP, hypothesis 1 has to be rejected. Literature produced from the clinical setting found slightly different results. Myers and colleagues found automated units to produce significantly lower measurements than manual methods and concluded that automated units have higher quality and accuracy due to the ability to reduce digit preference and white coat response, both of which were not studied in the current study. 13 Digit preference is the tendency to round a number so the last digit is a 0 or 5 when recording manual BP. White coat response is the tendency for an individual’s BP to raise when it is measured in a clinical setting. Mirdamadi, et al., as well as Eteban et al. also found manual BP measurement to be significantly higher than automated measurement. 14 A separate study by executed by Mansoor and colleagues, in the emergency department (ED), concluded that automated units produce readings that are too varied to be considered reliable for use in the ED. 15 The spectrum of information found in the present study as well as the literature makes it apparent that further investigation of the differences between manual and automated units is needed. It is important to keep in mind that this study did not account for white coat effect, which can be a major benefit of automated units. All the variation raises the important question of what is the most accurate means to measure patients’ blood pressure.
Next, based on comparing the two measurement protocols, condition (protocol) appeared to be a more influential factor than equipment, though this was only tested with one of the devices. The lack of protocol produced significantly higher systolic and diastolic BP measurements than the protocol measurements. This is evident in the higher systolic end point for IQ-TY (123.7 mmHg) compared to IQ-PR (114.8 mmHg), as well as the higher diastolic end point of IQ-TY, 79.6 mmHg, compared to IQ-PR, 71.15 mmHg. The effect of a lax protocol can also be easily visualized in Figures 2 and 3, which show nearly all the data points clustered above the regression line for the graphs involving IQ-TY’s. The dramatic increase in BP for IQ-TY allows hypothesis 2 to be confirmed. By examining the ranges of the axes in Figures 2 and 3 it is obvious that lack of protocol is much more influential than equipment (though this statement is limited by the fact that the effect of protocol was only tested using the IQvitals device). In order to obtain the best BP measurement to create a patient trend, it is imperative that protocol be followed consistently. That way when there is an increase or decrease in BP, the provider can assume it is due to a physiological change. There is already conflict over natural variation in BP and whether episodic or maximum BP is meaningful. The natural variation in BP is used to assess cardiovascular risk. Rothwell discusses this variation in BP and how it is used in the clinical setting to diagnosis diseases. 16 He also warns against relying too much on a single measurement as there are natural fluctuations depending on surrounding environment, but variation in BP, especially increases, can be signs of atrial disease and/or organ damage. If this perceived “natural” is merely just an inconsistency in the protocol that was used, then the diagnosis and treatment could be wrong and detrimental to the patient.
An interesting discovery when comparing IQ-TY and IQ-PR is that the mean increase for the systolic BP is only 9 mmHg and the increase in diastolic BP is only 8 mmHg. The difference between the two measurements is attributed to the fact that the participants had their feet elevated from the ground (+5-10 mmHg), back unsupported (+5-10 mmHg), arm unsupported (+10 mmHg), they were non-resting for 3-5 minutes (+10-20 mmHg), and potentially talking (+10-15mmHg) in IQ-TY. 8 If the different variables were cumulative, then they would add up to an increase of at least 30 mmHg. The increase seen in this pilot study with condition TY was less than 10 mmHg. This shows that the variables necessary to follow protocol and obtain a proper BP are not additive, which is consistent with the available literature. 8 Therefore the patient could have the same elevated BP if 1 or 5 variables of the protocol are not followed. Based on this information, it imperative to pay attention to proper BP measurement technique because one misstep could cause a significant difference.
One of the common aspects of protocol that is forgotten is waiting 3-5 minutes to allow the patient to rest before a BP is taken. The significant difference between the first and last BP measurement in IQ-TY shows that the effect of ignoring rest time is a higher BP measurement. Based on a study conducted by Ray et al. the typical patient spends 84 minutes in the clinic per visit. 17 This gives the facility plenty of opportunity to find 3-5 minutes to allow the patient to sit down and rest before BP is measured. The current healthcare push for speed and efficiency may make this more difficult, but it is definitely possible as the visit is substantially longer than 5 minutes. It is not worth rushing through a visit and obtaining improper measurements on the patient because these data points are intended to aid in the diagnosis and care of the patient. Potentially erroneous measurements could result in the inability to provide the best patient care, which should be the primary goal of providers.
Revisiting hypothesis 1, regarding the differences between equipment, it is important to consider how the indirect measure of BP is used in the medical management of the patient. The trend of a patient’s BP measurements can be a sign to detect various diseases. Although trend data was not obtained in this pilot study, the strong association between equipment as displayed in Tables 8 and 9 can point to how the various pieces of equipment can be used. For example, consider if a patient who was recording his or her BP at home with an Omron home automated unit came to a primary care visit and told the provider that recent his or her BP readings were high. With this information the provider assumes that the BP measurement in the office will also be high, though the provider cannot assume the BP measurements will produce exactly the same value. Along with the strong association, the two pieces of equipment normally used in the clinical setting, MA and IQ, only had a mean difference of 3 mmHg for systolic BP in this study. Since hypertension categories change every 10 mmHg, the difference of 3 mmHg is only a shift within a single category. Based on the strong association and minimal difference between clinical devices, the different pieces of equipment all still have value in the clinical setting.
Revisiting hypothesis 2, when protocol is not followed, it is important to think about how BP measurements are used to categorize patients. The categorization allows providers to determine the best treatment to reduce hypertension at any stage and lower the risk for potential cardiovascular disease. The AHA worked together with the American College of Cardiology (ACC) to provide revised guidelines for hypertension classification and management in the fall of 2017. 4 Referring to Figure 5, the present cohort is profiled using the revised classifications and demonstrates how the participants are categorized based on the data generated by the equipment in the context of condition (‘protocol’). It can be clearly seen that the IQ-TY categorized more participants as having elevated BP as well as stage 1 and stage 2 hypertension than all the other conditions where protocol was followed. Further, when comparing IQ-TY to IQ-PR, there was a difference of 8.9 mmHg for systolic and 8.4 mmHg for diastolic, which is nearly the difference between most hypertension categories. Given this result, which suggests that the failure to follow protocol leads to a shift from a lower to a higher hypertension category, it is evident that protocol must be followed whenever BP measurements are taken.
The revised BP classification presents the perfect opportunity for practices to revisit the way BP is acquired. Hypertension is definitely an issue, as a third of the US population was deemed to be hypertensive under the previous AHA categories. It is possible that around half of the US population will now be considered hypertensive, based on the revised classification system. 5 Hypertension is a major issue and should be treated when diagnosed, but it is imperative that those at risk are first properly diagnosed and then properly treated. Anti-hypertensive medications are the most common method to treat hypertension, yet they have many side effects. Only individuals who truly need medication should be taking it. Additional methods for treating elevated BP, such as lifestyle changes, have far fewer potential side effects and many more potential benefits. As the AHA guidelines have been revised and BP thresholds lowered, the number of patients being placed on medication is likely to increase. This study would suggest that lack of adherence to protocol significantly increases the BP measurement; therefore it is imperative that the AHA protocol be followed and the patient’s BP measurement not be artificially elevated due to a protocol error. The BP measurement should truly reflect the diagnostic condition of the patient. The goal of providers is to provide the best patient care, and in order to do this, it is important to obtain the best data for making critical diagnostic decisions.
Limitations
There were several limitations with this study. One of the major limitations was the design of this study as pre-experimental and therefore there are threats to internal and external validity. The sample of participants was a purposive group of volunteers so these results are unique to the group and cannot be translated to a larger population.
Conclusion
This study was begun at the time that the AHA released an amendment to their diagnostic thresholds for hypertension. Therefore these pilot results were timely for assessing effects of equipment, protocol, and resting on BP. The goal of this pilot work was to provide information about obtaining BP that could assist providers, improve diagnostic practice, and patient care. It also begins a very important discussion on the potential for collecting reliable BP data that can assist in correctly classifying patients based on the new AHA hypertensive guidelines.
Footnotes
Acknowledgements
The authors would like to thank the Midmark Corporation for their support of this research endeavor and providing the IQ Vitals BP equipment. The research was supported by a grant from the Dr. Rosita Schiller scholarship fund. Special thanks to Xueliang “Jeff” Pan, PhD, Center for OSU Biostatics, for assisting with the statistical analysis.
Declaration of Conflicting Interests
The authors declared no potential conflicts of interest with respect to the research, authorship, and/or publication of this article.
Funding
The authors received no financial support for the research, authorship, and/or publication of this article.