
Abstract
The aim was to establish reference values of bladder wall thickness (BWT), detrusor wall thickness (DWT), and bladder weight (BW) in apparently healthy adults in a Nigerian population. Therefore, a cross-sectional study of healthy adult participants was conducted from May 2015 to April 2016. The urinary bladder was sonographically evaluated on a convenient sample of 384 adult participants. The BWT, DWT, and BW of the participants were measured and documented. The BW was estimated based on the surface area, thickness, and bladder muscle specific gravity. The mean BWT, DWT, and BW were 2.8 ± 0.3 mm, 1.3 ± 0.1 mm, and 23.3 ± 4.1 g, respectively. There was no statistically significant correlation between anthropometric variables with BWT, DWT, and BW except age, which had a weak positive correlation with BWT (P = .05). This data set could be used for future research, in other parts of the country, for a possible nationwide nomogram.
Accurate determination of bladder wall thickness (BWT), detrusor wall thickness (DWT), and bladder weight (BW) can be used as a clinical tool to exclude bladder and detrusor pathologies in a healthy adult population. Studies conducted in the past established that bladder outlet obstruction (BOO) is accompanied by compensatory increases in BWT, DWT, and BW.1–3 The urinary bladder is roughly spherical in shape, although its shape and size vary among individuals, and it depends greatly on the volume of urine that it contains. The normal adult bladder can accommodate 300 to 600 mL of urine. 4 Many tiny wrinkles known as rugae line the inner surface of the bladder and allow it to stretch as it fills with urine. As urine accumulates, the rugae flatten and the wall of the bladder thins as it stretches, allowing the bladder to store larger amounts of urine without a significant rise in internal pressure. 5 The bladder wall consists of three layers: the outer adventitia, the middle detrusor, and the inner mucosa. Sonography is routinely used in the determination of BWT, DWT, and BW because it is noninvasive, simple, fast, and widely accepted. 6 With sonography, the detrusor is hypoechogenic while the adventitia and mucosa layers are hyperechogenic. 7
Bladder wall thickness is affected by the volume of urine the bladder contains and by disease conditions. As the volume of urine in the bladder increases, the BWT decreases. Differential diagnosis for bladder wall thickening depends on whether the bladder is adequately distended. The bladder is considered to be thickened if it is greater than 3 mm when distended or greater than 5 mm when nondistended. 8 The bladder volume is calculated as the product of sonographic measurements of bladder length, width, depth, and a correction factor of 0.6. 9 Oelke et al. 10 established that BWT remains almost stable at 250 mL of bladder filling until maximum bladder capacity and also that all parts of the bladder have the same thickness in one individual. Therefore, the anterior bladder wall is a reliable location to obtain information about BWT, DWT, and BW. On a sonogram, the BWT can be measured using a 3.5-MHz curvilinear transducer with the thickness calculated as the distance between the outer and inner surfaces of the bladder wall.
The detrusor is a layer of the bladder wall made of smooth muscle fibers. The detrusor contracts whenever the bladder is stretched. This contraction of the detrusor muscle encourages the bladder to expel urine through the urethra. According to Oelke et al., 10 DWT remains almost stable at 250 mL of bladder filling until maximum bladder capacity is achieved, which is in the range of 1.2 to 1.4 mm. They recommended the use of high-frequency ultrasound arrays (7.5 MHz) with an enlargement function for the sonographic image to achieve a precise measurement of DWT.
Sonographic estimated bladder weight (SEBW) is calculated manually as the product of bladder surface area, BWT, and bladder muscle specific gravity. 11 The normal SEBW among healthy adults according to Chalana et al. 11 is 42 g (SD, 6 g). They also established that SEBW was fairly consistent across a single participant at bladder volumes between 200 and 400 mL.
Anthropometric variables like sex, weight, height, body mass index (BMI), age, and parity could influence the values of BWT, DWT, and BW, with Ozdedeli et al. 12 previously reporting a slight difference in BWT and BW of men compared to women (2.1 mm vs. 1.9 mm and 46 g vs. 43 g, respectively). They, however, reported no correlation between BWT and BW with BMI, age, and parity. Blatt et al. 13 also reported a slightly thicker bladder wall in males than in females (2.1 mm vs. 1.9 mm). Hadi et al. 14 reported in 2009 that there is a significant positive correlation between age, height, and weight with BWT. They also noted that there is no significant correlation between BMI and BWT. Muller et al. 15 reported a slightly higher DWT in boys than in girls, whereas Uluocak et al. 16 reported no significant difference in DWT between boys and girls.
There are few studies on the sonographic determination of BWT, DWT, and BW in a Caucasian population and few studies in a black population. Racial variations in BWT, DWT, and BW may exist. The objectives of this study, therefore, were to determine normal values of BWT, DWT, and BW in a healthy adult Nigerian population using a sonographic method, as well as to determine the association between BWT, DWT, and BW with anthropometric variables.
Methods
This was a cross-sectional study carried out between May 2015 and April 2016 in a private hospital in southeastern Nigeria. This study targeted the apparently healthy adult population of people resident in that locality. The research design and protocol were approved by the Human Research and Ethics Committee of Nnamdi Azikiwe University, Nnewi. The participants consisted of volunteers who expressed willingness to participate in the study at the time that they were approached for enlistment. The selection of prospective participants was done with a convenient sampling method. Participants who met the inclusion criteria had a sonographic examination of the bladder. The inclusion criteria were as follows:
Healthy adults within the age range of 18 and 64 years. The upper age limit was 64, due to the difficulty of finding participants without disease that affects the function of the lower urinary tract, in an elderly population.
Participants with a full bladder of at least a 250-mL capacity.
Exclusion Criteria
The participants were excluded if they had a history of lower urinary tract injury or surgery, benign prostatic enlargement or prostatic neoplasm, neurologic disease or diabetes mellitus, renal disease, open wound in or around the suprapubic area, renal stasis, or bladder dysfunction affecting the kidneys.
Pregnant women.
Women with fibroid, overactive bladder, and pelvic organ prolapse were also excluded from the study.
The exclusion is based on the fact that the abovementioned conditions could affect the BWT, DWT, and BW.
Sonography of the Urinary Bladder and Detrusor and Data Collection
The participants were briefed about the study, and written consent was obtained from each participant prior to enrollment in the study. The demographic characteristics (weight, height, BMI, age, and sex) and parity of female participants were recorded. Scheduled participants were asked to come with a full bladder, but those without appointments were asked to drink glasses of water and wait for their bladder to fill.
Sonography was conducted with Mindray DC7 ultrasound equipment and both 3.5-MHz and 7.5-MHz curvilinear transducers (Manufactured in 2012 by Shenzhen Mindray Bio-Medical Electronics Co., Ltd., Shenzhen, China). The scanning protocol by Sanders and Hall-Terraciano 17 was adopted and used for each participant. Each participant changed into a clean gown and lay supine on the examination couch, and coupling gel was applied to the midline slightly above the symphysis pubis. A pelvic sonogram was used to obtain the measurements. The measurements were taken using the electronic calipers on the ultrasound equipment and the freeze-frame function.
First, a 3.5-MHz curvilinear transducer was placed suprapubically to assess the participant’s bladder volume. 18 In assessing the bladder volume, the bladder was scanned in both the longitudinal and transverse planes. Bladder length was measured from the longest axis of the longitudinal plane of the bladder. The breadth and depth measurements were obtained from the transverse plane. The bladder volume was then calculated as the product of sonographic measurements of bladder length, breadth, depth, and a correction factor of 0.69 (Figure 1).
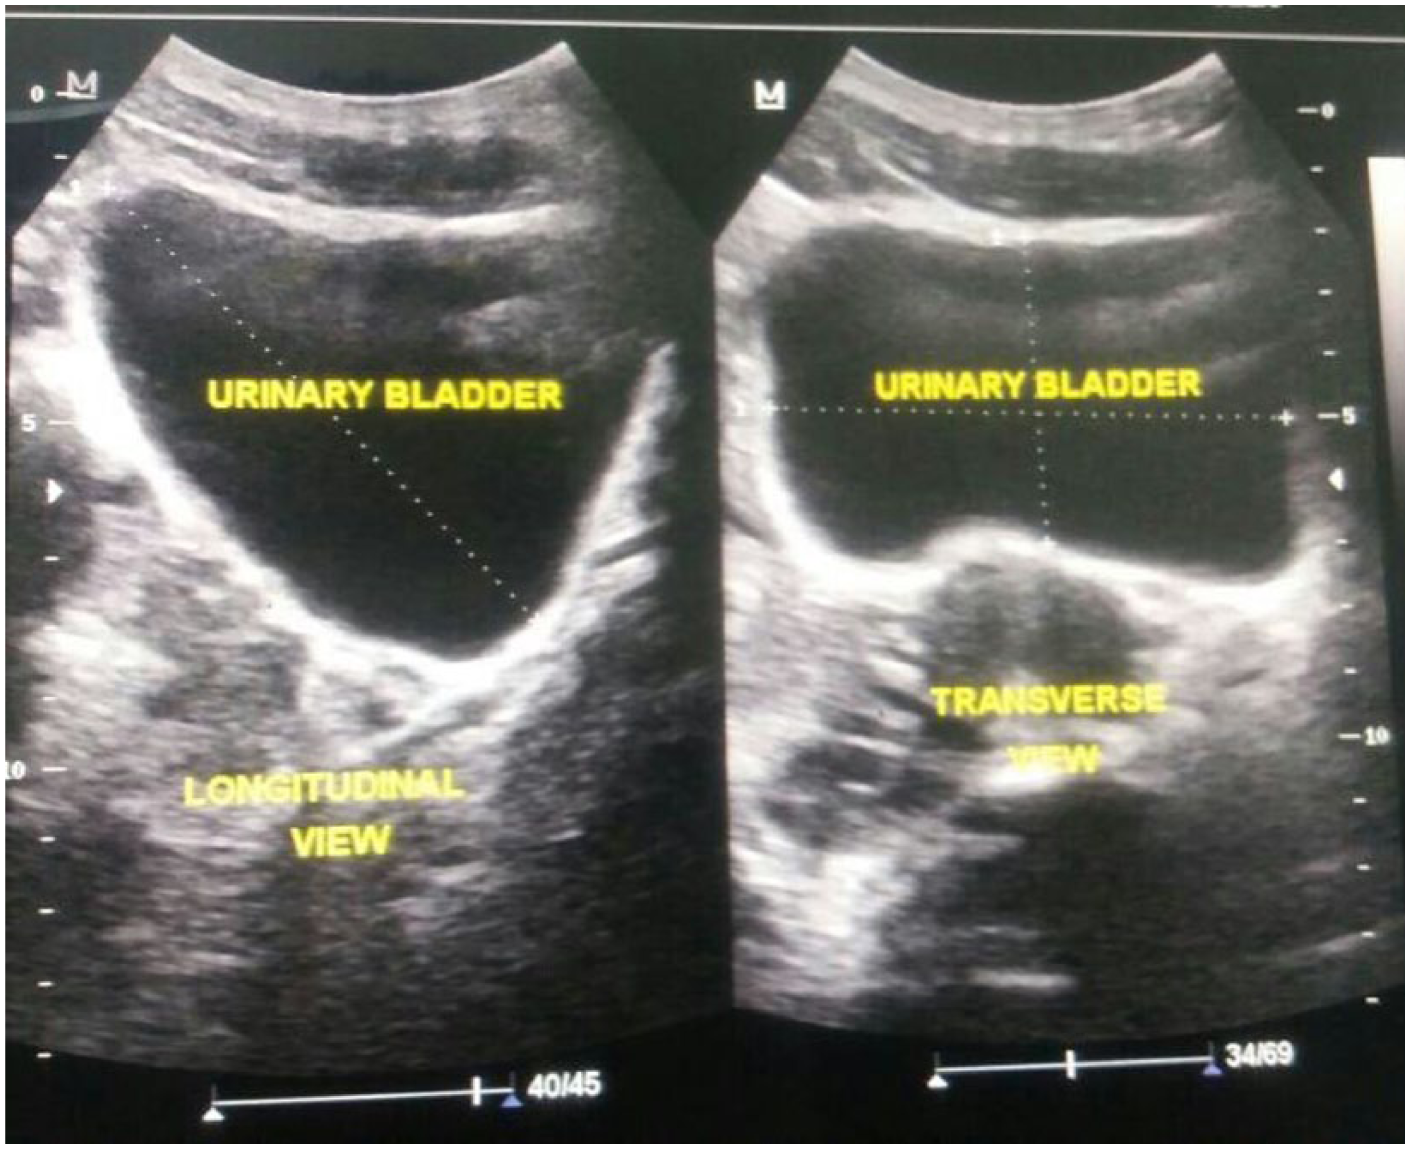
Sonographic image showing bladder volume measurement.
If the bladder volume was up to 250 mL, the study continued. 19 A bladder volume of 250 mL was used as an inclusion criterion because studies carried out in the past by Oelke et al. 10 and other researchers established that the BWT and DWT remain almost stable at a bladder volume of 250 mL until maximum bladder filling. The 3.5-MHz curvilinear transducer was placed slightly above the symphysis pubis and BWT measurement obtained from the anterior bladder wall in both longitudinal and transverse planes. The bladder region was first delineated precisely. From this delineated bladder region, the bladder wall thickness was calculated as the distance between the outer and inner surfaces of the bladder wall (Figure 2). Multiple measurements of the BWT for each participant were taken, and the average value for each participant was used.
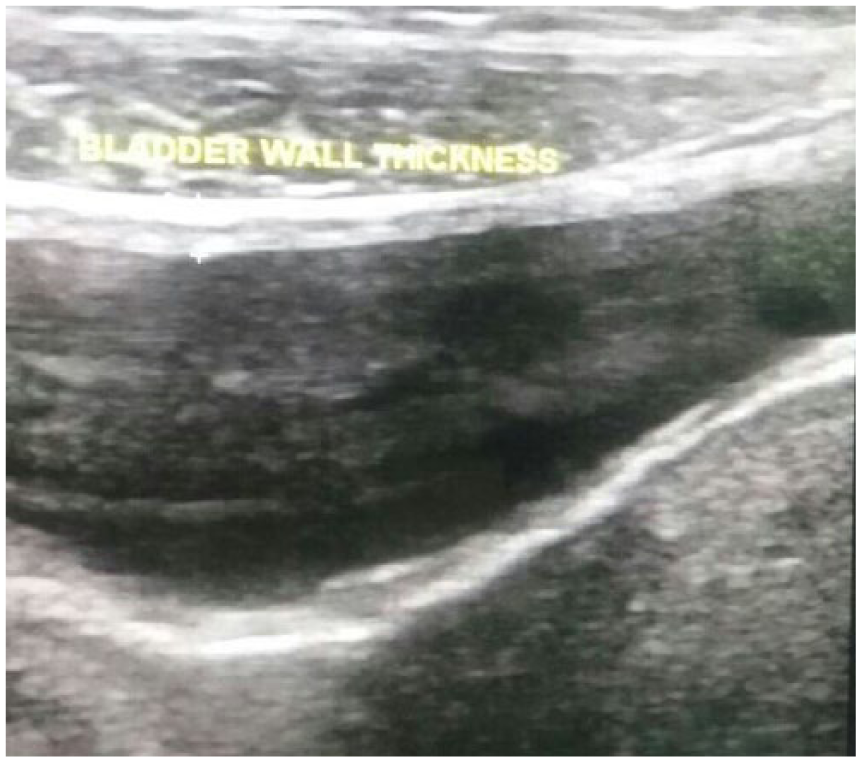
Sonographic image showing bladder wall thickness measurement.
The DWT was obtained at the anterior bladder wall using a 7.5-MHz curvilinear transducer positioned suprapubically. The scan was conducted in both longitudinal and transverse planes. The anatomical structures were first identified, after which the image was enlarged maximally (×10) so that the three layers of the bladder wall could be identified (Figure 3).
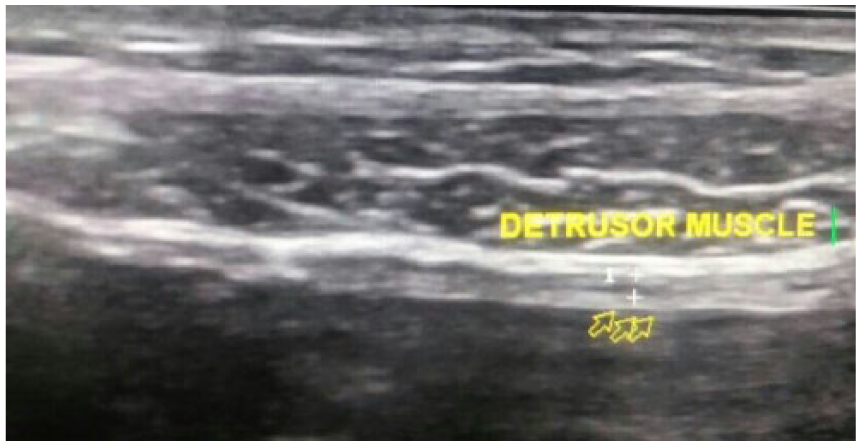
Sonographic image showing detrusor wall thickness measurement.
The hypoechogenic area between the hyperechogenic adventitia and mucosa represents the detrusor muscle. 11 To obtain an accurate measurement, the calipers were placed from the inner to outer borders of the detrusor muscle. Three measurements of the DWT for each participant were taken, and the average value for each participant was used.
In determining the bladder weight, the actual surface area of the bladder was calculated as the product of the bladder height and breadth. The bladder weight was then estimated as the product of the surface area (S), thickness (t), and bladder muscle specific gravity, p. 11 The specific gravity used for estimation of bladder weight in this study was 0.957, as determined by Kojima et al. 19
The weight and height of each participant were obtained using a weighing scale with an attached adjustable meter rule (Model ZT-150; Shenzhen Mindray Bio-Medical Electronics Co., Ltd., Shenzhen, China). The weight (in kg) was measured with the weighing scale placed on level ground and the participant standing barefooted and wearing lightweight clothing. The height (in cm) was measured with the participant standing in the Frankfurt position. The age of each participant was obtained from his or her birth certificate and recorded on the data capture sheet.
Data Analysis
The BMI of each participant was calculated with the following formula: weight (kg)/height 2 (m). Statistical analysis was done using Statistical Package for Social Sciences (Windows Version 20; SPSS, Inc., an IBM Company, Chicago, IL). Descriptive and inferential statistics were calculated. Spearman’s correlation was used to ascertain the correlation of BWT, DWT, and BW with the anthropometric variables. Independent sample t test was used to test the equality of means in the anthropometric variables and bladder indices. Statistical significance was considered at P < 0.05.
Results
Table 1 summarizes the characteristics of the participants. A total of 384 participants, 170 men (44.3%) and 214 women (55.7%), participated in the study. Their mean weight, height, and BMI were 76.0 ± 1.0 kg, 170 ± 1.1 cm, and 27.0 ± 8.0 kg/m2, respectively. Age was significantly higher in men than in women while BMI was higher in women compared to men. BWT, DWT, and BW all demonstrated comparable results for both male and female participants.
Mean of the Measured Variables.
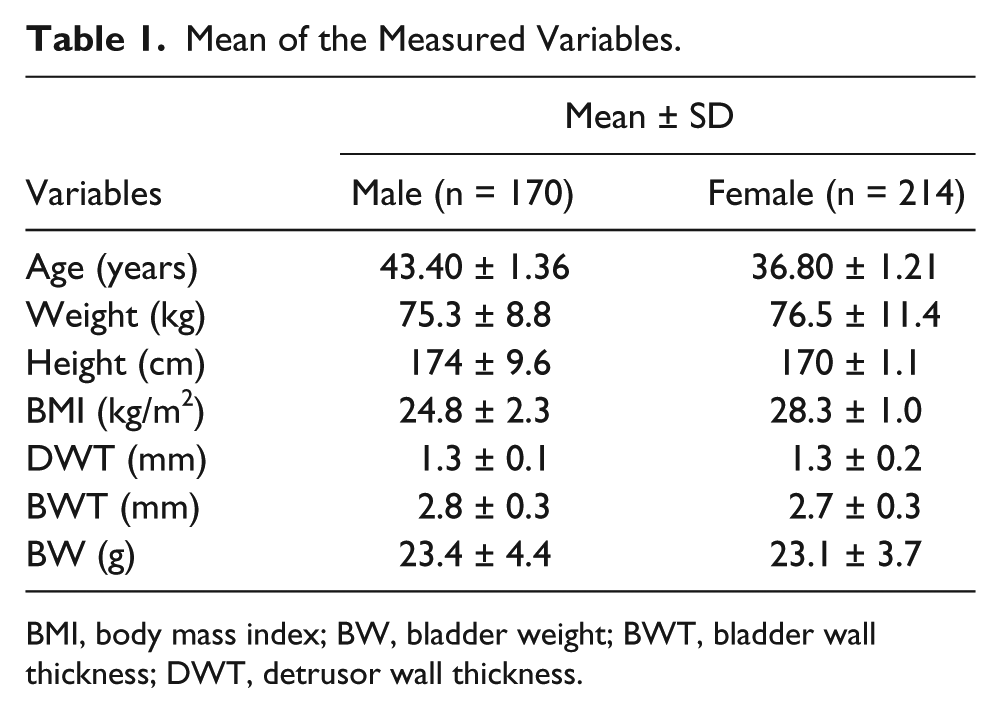
BMI, body mass index; BW, bladder weight; BWT, bladder wall thickness; DWT, detrusor wall thickness.
Independent sample t test for equality of means in bladder indices and anthropometric variables showed there was a significant difference in means of age, height, and BMI but no significant differences in means of BWT, DWT, and BW (Table 2).
Independent Sample t Test for Equality of Means.
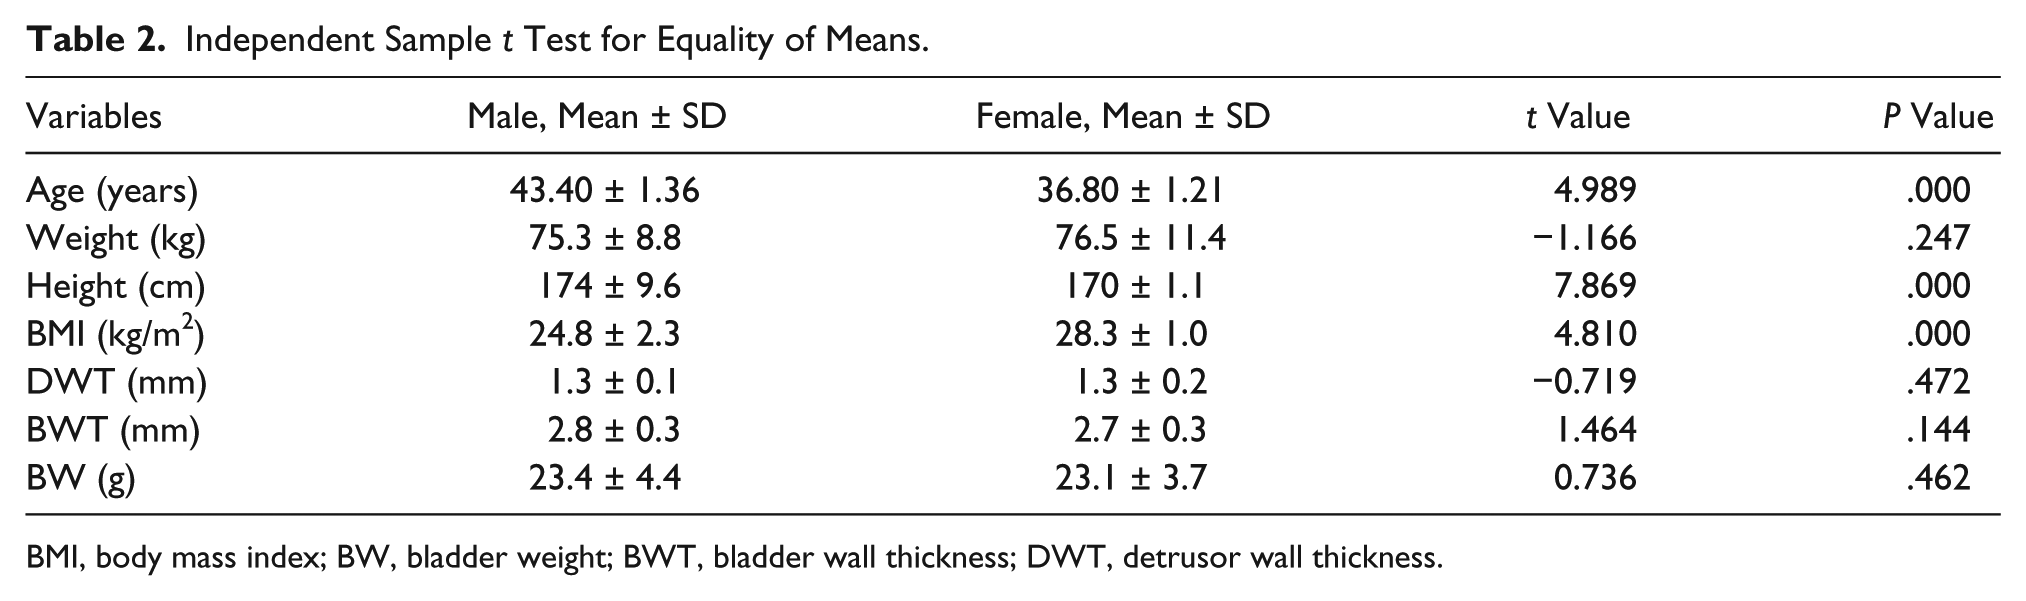
BMI, body mass index; BW, bladder weight; BWT, bladder wall thickness; DWT, detrusor wall thickness.
Table 3 provides the Spearman’s correlation between BWT, DWT, and BW with anthropometric variables. Height, weight, and BMI had no statistically significant correlation with BWT, DWT, and BW. Age had a weak correlation with BWT (P < 0.05) but no correlation with DWT and BW. Table 4 shows an independent sample t test to investigate the impact of parity on BWT, DWT, and BW. A total of 214 women participated in the study, of whom 118 women (55.1%) were nulliparous while 96 women (44.9%) were multiparous. There was no statistically significant difference in BWT, DWT, and BW of nulliparous and multiparous participants.
Spearman’s Correlation of DWT, BWT, and BW Compared to Anthropometric Variables.
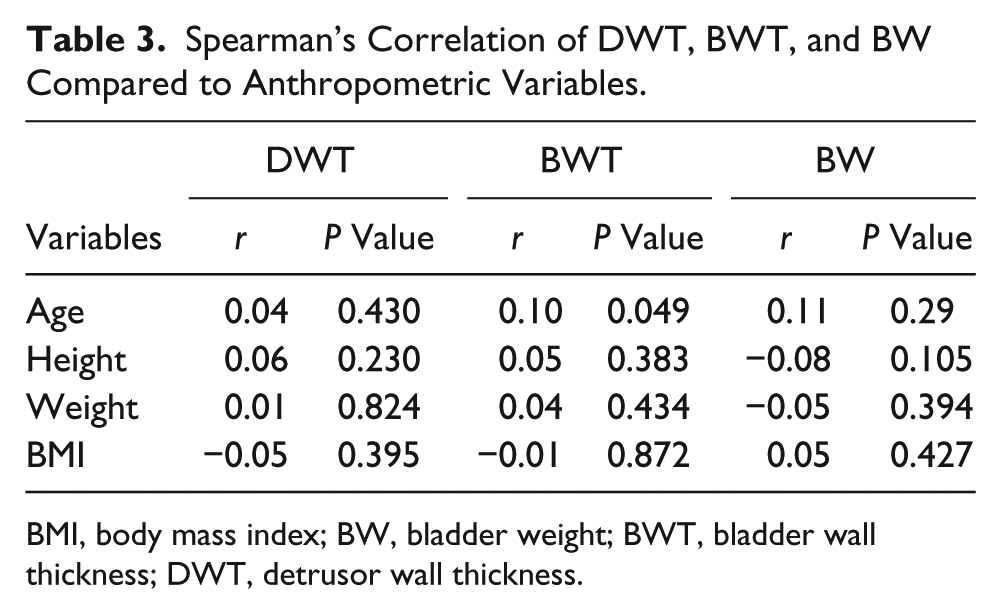
BMI, body mass index; BW, bladder weight; BWT, bladder wall thickness; DWT, detrusor wall thickness.
Impact of Parity on DWT, BWT, and BW Using Independent Sample t Test.
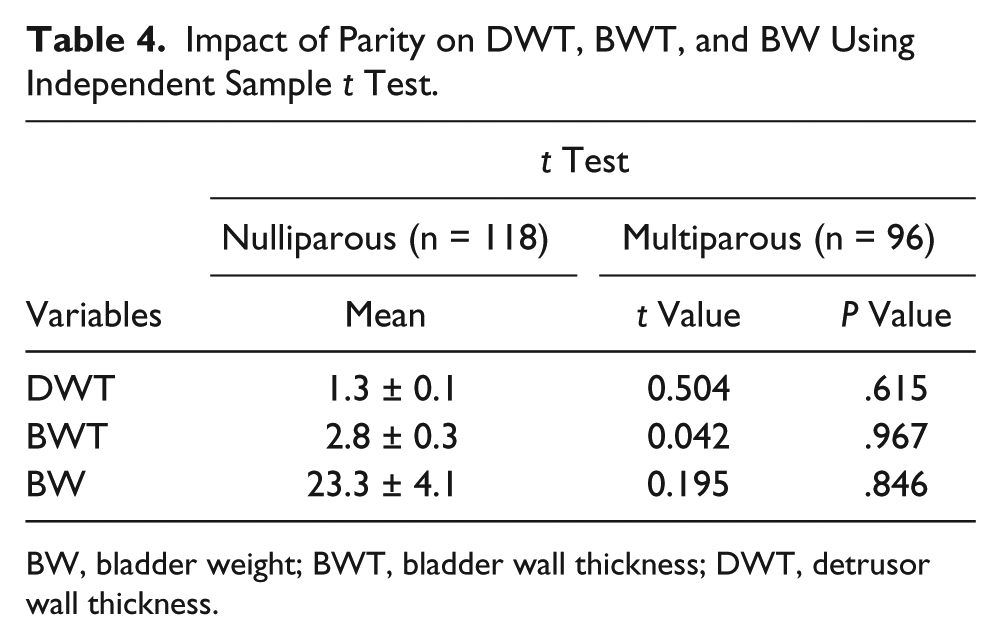
BW, bladder weight; BWT, bladder wall thickness; DWT, detrusor wall thickness.
Discussion
The bladder wall and its layers can be easily imaged with sonography. The use of sonography to determine BWT, DWT, and BW values to diagnose BOO and detrusor instability has increased because it is a noninvasive procedure. Hence, the determination of normal BWT, DWT, and BW values in healthy adults is important because it provides normal-pathologic boundaries. In this study, a total of 384 participants were sonographically examined to establish a nomogram of BWT, DWT, and BW values in a Nigerian population. The results of the present study showed that normal BWT value was 2.8 ± 0.3 mm. This present work showed variation from the findings of Blatt et al., 13 who found mean male and female BWT values of 2.1 mm and 1.9 mm, respectively. Kanyilmaz et al. 20 and Chan et al. 21 derived a mean BWT of 2.0 ± 0.4 mm and 1.79 ± 0.2 mm, respectively, which were lower than the values within this study. The published variations may be due to recruited participants being Caucasian, whereas participants in this study were identified as indigenous to the area (negroid/congoid).
Age (P = .05) had a weak positive correlation with BWT in the present study. The findings support those reported by Hakenberg et al., 9 who found a weak positive correlation between BWT and age for men and women. Height, weight, and BMI in the present study had no significant correlation with BWT. This disagrees with the work of Bright et al., 22 who found a statistically significant but weak correlation between BWT versus weight and BWT versus BMI. Sorkhi et al., 23 however, established a significant correlation between height and weight with BWT. This disparity may be due to the fact that Sorkhi et al. 23 worked with set of pediatric participants, with a maximum age 15 years.
The mean DWT value reported from this study was 1.3 ± 0.1 mm for men and 1.3 ± 0.2 mm for women. This is similar to the findings by Oelke et al., 10 who established a range of 1.2 to 1.4 mm and found slightly increased DWT in males (1.4 mm) compared with females (1.2 mm). The difference in the value of DWT from this study and that of Oelke et al. 10 points to the fact that DWT may be similar across racial groups. Based on the present study, no correlation was found between DWT with age, height, weight, and BMI.
The derived BW from this study was 23.3 ± 4.1 g. There was no statistically significant difference between male and female values (P = .462). The result of this study is in agreement with the work by Bright et al., 22 who established a range of 21 to 65 g for bladder weight in asymptomatic adult participants. The findings of this study differ significantly from the published studies by Al-Shaikh and Al-Mandeel, 24 who established a bladder weight of 32.25 g, as well as Kanyilmaz et al., 20 who derived a mean bladder weight of 44.6 ± 8.3 g. The observed variations may have been as a result of their method of calculation. While manual calculations were used to derive bladder weight in the present study, automatic computation by the ultrasound equipment was used by other researchers. However, the mean BW derived from this study fell within the range established by Bright et al. 22 and underscores the fact that this manual method of computing BW may be reliable. No statistically significant correlation was observed between BW and age, height, weight, or BMI in the present study. This is in agreement with the work by Al-Shaikh and Al-Mandeel, 24 who found no correlation between BW and age or height. The finding of this study is in opposition to Jenn-Ming et al., 25 who found a significant correlation between height and age with BW. In addition, Bright et al. 22 reported a statistically significant but weak correlation between BW and weight as well as BW and BMI.
Limitations of the Study
Many researchers have proposed the measurement of BWT, DWT, and BW automatically. When measured manually, as was done in this study, the bladder wall measurements suffer from inter- and intraobserver variability. Given that this was a convenient sample that excluded participants older than 64 years, these results cannot be generalized.
Conclusion
This study has determined normal values of BWT, DWT, and BW in a healthy set of adults, using a sonographic method. While BWT, DWT, and BW did not differ significantly with sex and parity, there were significant differences in BWT, DWT, and BW compared with published Caucasian values.
Footnotes
Acknowledgements
We thank Dr. Charles Ugwoke Eze for his useful critiques.
Declaration of Conflicting Interests
The authors declared no potential conflicts of interest with respect to the research, authorship, and/or publication of this article.
Funding
The authors received no financial support for the research, authorship, and/or publication of this article.