
Abstract
Three-dimensional sonography enables assessment of uterine morphology. While the pattern of endometrial growth has been well described, little information is available on changes in endometrial and myometrial volume, area, and perimeters. We evaluated the ratio between myometrial and endometrial dimensions and its relation to endometrial thickness of inpatients with normal uterine morphology from our hospital. Routine hormonal assessment on the day of the sonographic exam was extracted from electronic medical records. Correlations between different dimensions of the uterus were examined. A total of 38 3D sonographic data sets were reviewed. A significant correlation was found between estradiol blood levels and endometrial thickness, area, and volume (R = 0.35, 0.53, 0.55, respectively; P < .05). The ratio between the endometrial and myometrial area remained constant regardless of endometrial thickness. The findings of this study suggest that endometrial thickness, area, and volume may correlate with circulating estradiol levels. Endometrial and myometrial changes correlated in more than one dimension.
Introduction
Three-dimensional (3D) sonography is a noninvasive diagnostic modality that enables a detailed assessment of uterine morphology. 1 Hysterosalpingography and laparoscopy are considered the “gold standard” for diagnosing uterine morphology and pathologies, but these are invasive techniques. Hence, a noninvasive technique such as 3D sonography is a useful alternative for evaluating the uterus2,3 as it is considered to be reproducible and has been shown to be more accurate for diagnosing congenital uterine anomalies than 2-dimensional (2D) sonography.4,5
While the pattern of endometrial growth in humans has been accurately described using 2D sonography,6 –8 little information is available on cyclical changes in endometrial and myometrial biometry in terms of volume, area, and perimeters. Raine-Fenning et al. 9 described endometrial growth during the menstrual cycle using 3D sonography. Both endometrial volume and thickness increased significantly during the follicular phase, reaching a plateau around the time of ovulation and remaining relatively stable throughout the luteal phase. These changes in endometrial thickness and volume were significantly correlated. However, to the best of our knowledge, myometrial dimensions were not studied.
The objective of this study was to evaluate the ratio between myometrial and endometrial dimensions and its relation to endometrial thickness in women with normal uterine morphology who were undergoing in vitro fertilization (IVF) treatment. Knowing the normal ratios between uterine dimensions can be useful for future comparisons to the ratios in uteri with congenital anomalies. The magnitude of deviation from the normal ratio might be helpful in assessing the role of uterine abnormalities among patients with infertility.
Materials and Methods
Selection of the Study Group
This retrospective study examined blood test results and stored 3D data sets of uterine images compiled from patients under evaluation or treatment for infertility from the IVF unit at a tertiary medical center. Patients with normal uterine morphology were included, whereas individuals with congenital or acquired (i.e., fibroids, polyps) uterine malformations were excluded. As all women seen in this facility have baseline sonographic imaging before starting an IVF protocol, uterine malformations and pathology were ruled out at that time.
The study was approved by the local Institutional Review Board. Patients undergoing IVF treatment had blood tests in the unit on the same day as their sonogram. Then, they were referred to the sonography unit for a transvaginal sonogram to capture endometrial and ovarian follicle measurements as part as the standard IVF treatment protocol. Routine hormonal assessment (circulating LH, estradiol [E2], and progesterone levels) on the day of the sonographic exam was extracted from computerized records.
The correlations and ratios between different parameters of the normal uterus were studied. The rationale for using ratios between parameters as outcome measures and not the actual measurements was because the exams were performed at different phases of the menstrual cycle, which were recorded for all cases.
Imaging Protocol
All patients underwent transvaginal sonography using a Voluson E8 expert ultrasound machine equipped with a 6 to 12 MHz transvaginal transducer (GE Healthcare Ultrasound, Milwaukee, WI, USA). Images were acquired during a routine examination and stored.
All images of the uterus that were used for data analysis were obtained by acquiring a midsagittal image of the uterus and performing an automated, 120°, 3D sweep. Dimensional measurements were performed by postprocessing features with Virtual Organ Computer-aided Analysis (VOCAL) software.
Measurements obtained included endometrial thickness measured from outer to outer borders at the point of maximum thickness (Figure 1), endometrial area measured at the coronal plane starting from the internal os of the uterine cervix (defined as the midpoint of the area where endometrial borders become parallel) (Figure 2), and endometrial perimeter measured in the same plane as the area (Figure 3). Endometrial volume was automatically calculated using the 3D images. Myometrial area and perimeter were measured at the coronal plane (Figure 4); length of the uterus was measured at the midline of the uterus from the fundus to the internal os of the cervix (Figure 1). The 3D images were obtained using the VOCAL imaging program. The measurements were performed by an experienced obstetrician-gynecologist (OB GYN) physician with a subspecialization in OB GYN sonography. All the measurements were done by the same physician, who is trained in imaging.
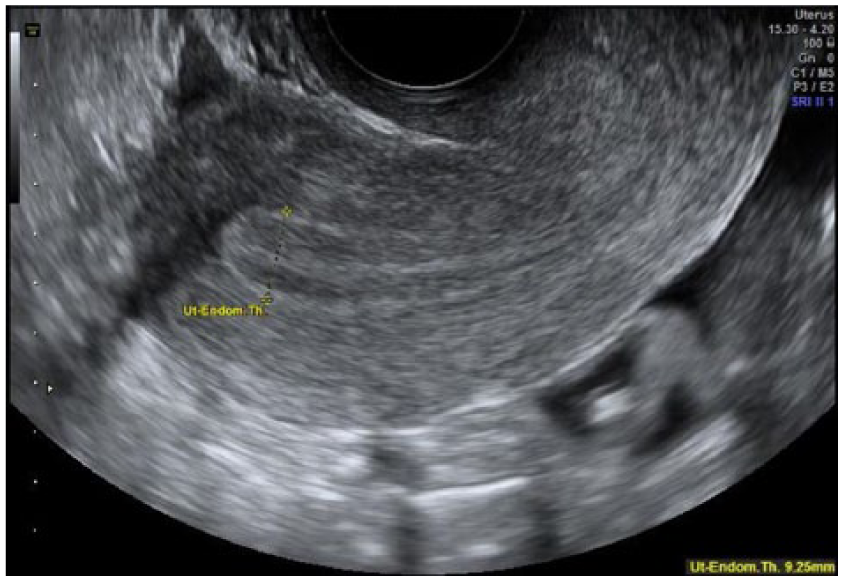
Endometrial thickness measured from outer to outer borders at the point of maximal thickness.
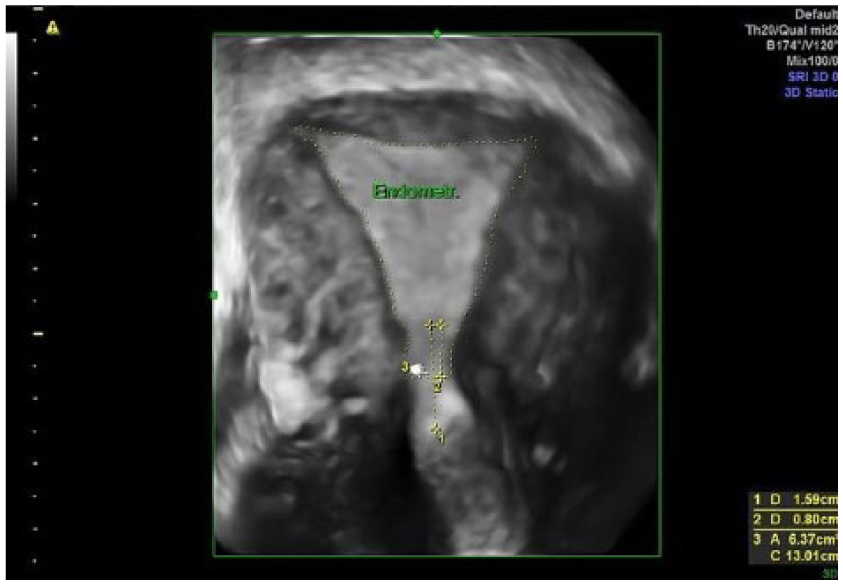
Endometrial area measured at the coronal plane starting from the internal os of the uterine cervix-defined at the midpoint of the area were endometrial borders become parallel (arrow to number 2).
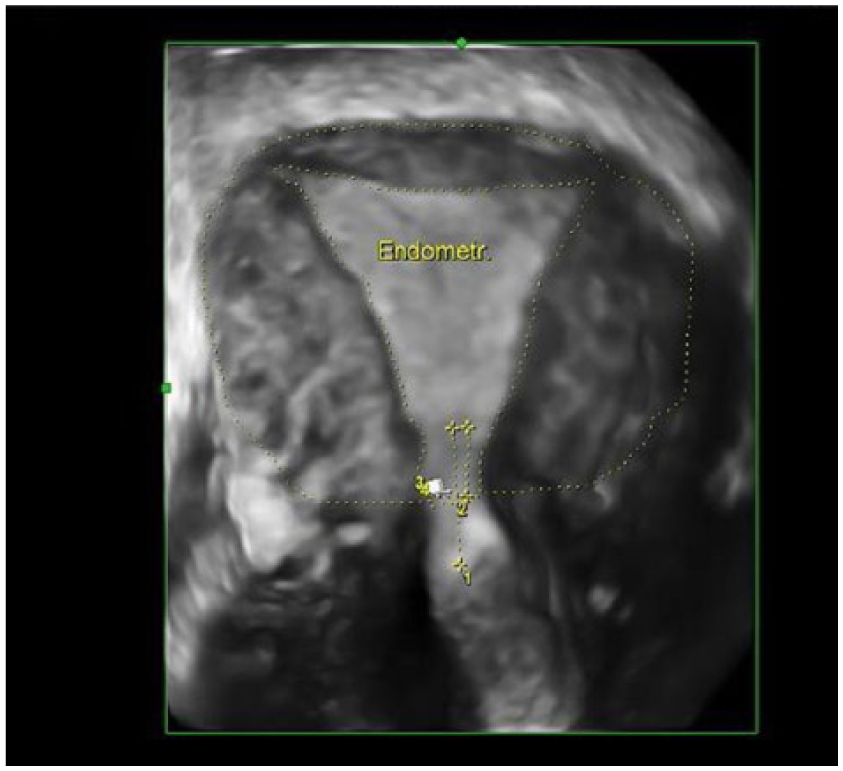
Endometrial & myometrial areas.
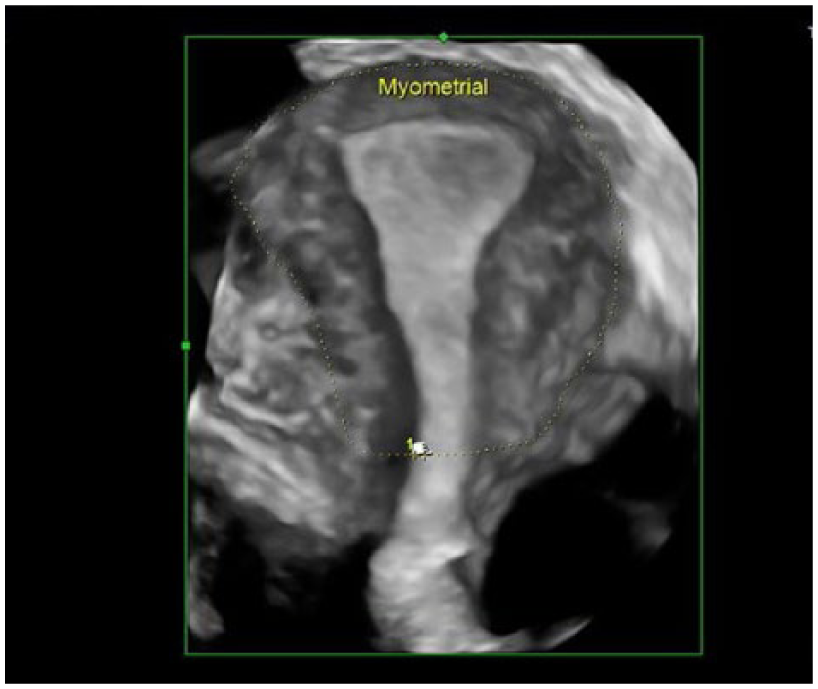
Myometrial area and perimeter were measured at the coronal plane.
Statistical Analysis
Statistical analysis was performed using SPSS 21. Shapiro-Wilk test was used for normally distributed parameters. As we were looking for a correlation between different uterine dimensions, we chose the Spearman correlation and Pearson correlation between two variables; Pearson correlation was chosen for normally distributed data, and Spearman’s correlation was chosen for abnormally distributed data. P values <.05 were considered statistically significant.
Results
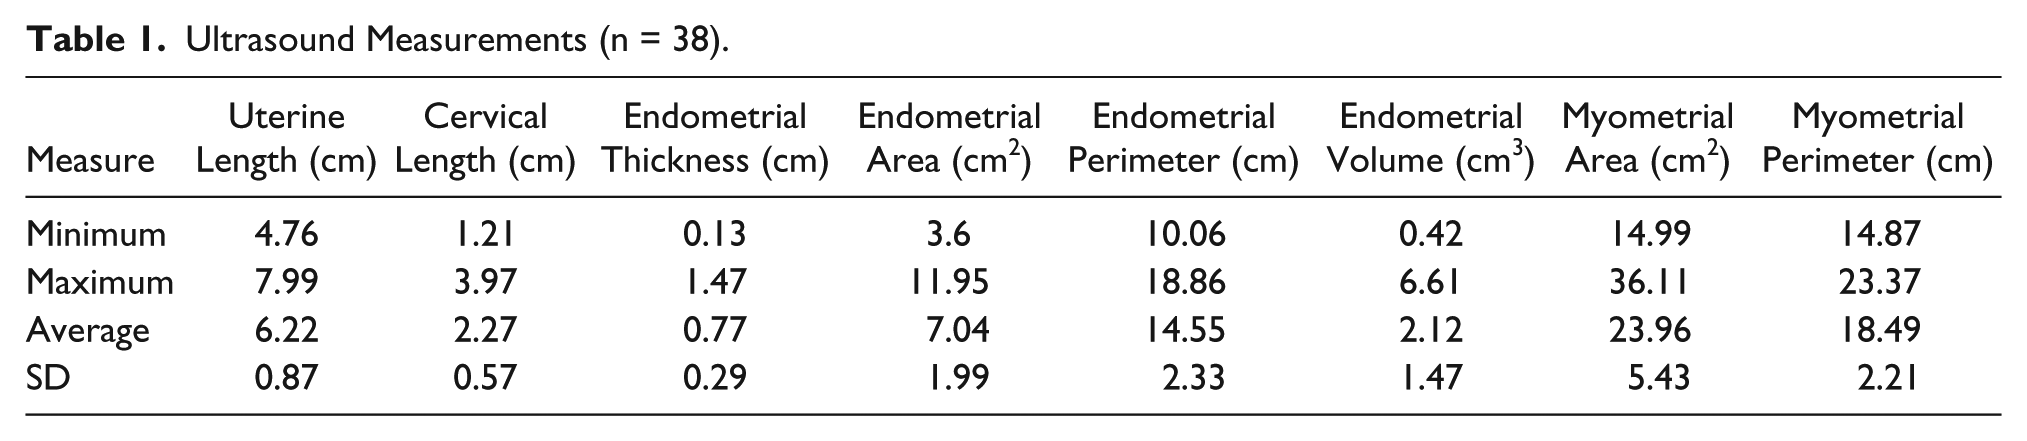
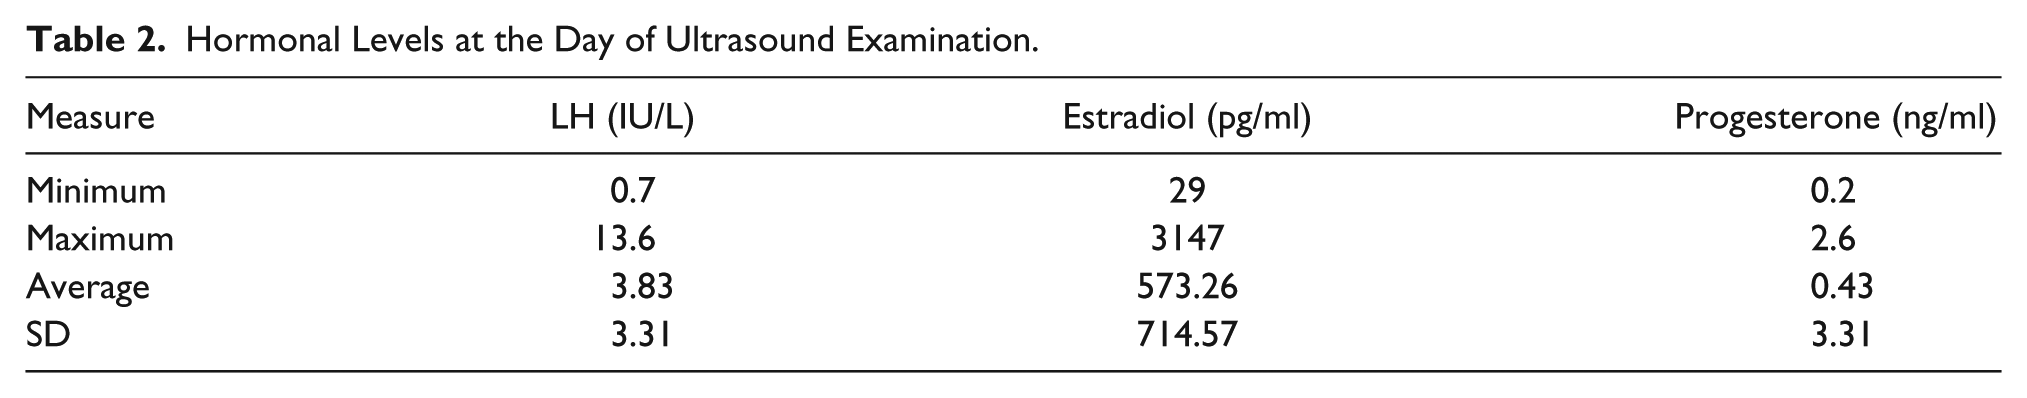
The 3D sonography data sets of uterine dimensions from 38 women were reviewed. The cohort was a mean age of 37.9 years (SD = 6.43; range, 24.4–47.4 years). The average dimensions of the uterus are shown in Table 1. Circulating LH, estradiol, and progesterone levels on the day of the exam are depicted in Table 2.
Ultrasound Measurements (n = 38).
Hormonal Levels at the Day of Ultrasound Examination.
Figures 5 through 8 show the correlations between endometrial thickness and endometrial area (Pearson correlation R = 0.37, P = .021), endometrial area and myometrial area (Pearson correlation R = 0.80, P = .000), endometrial and myometrial perimeters (Pearson correlation R = 0.87, P = .000), endometrial thickness and the endometrial volume (Pearson correlation R = 0.64, P = .000), as well as the endometrial area and volume of the endometrium (Pearson correlation R = 0.57, P = .000).
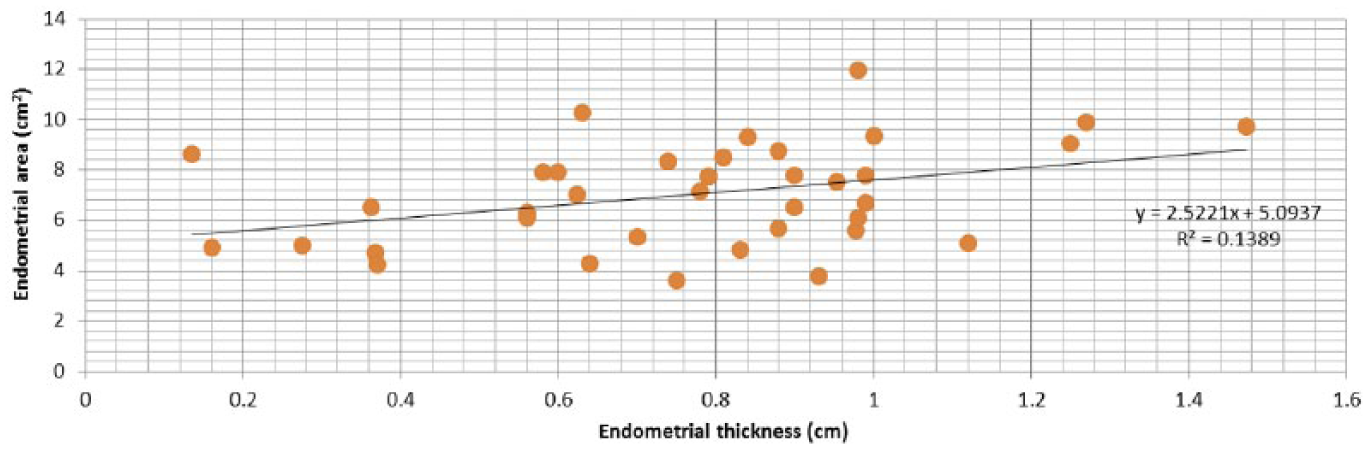
Correlation between endometrial thickness and area (N = 38). Pearson correlation R = 0.37, P < .05.
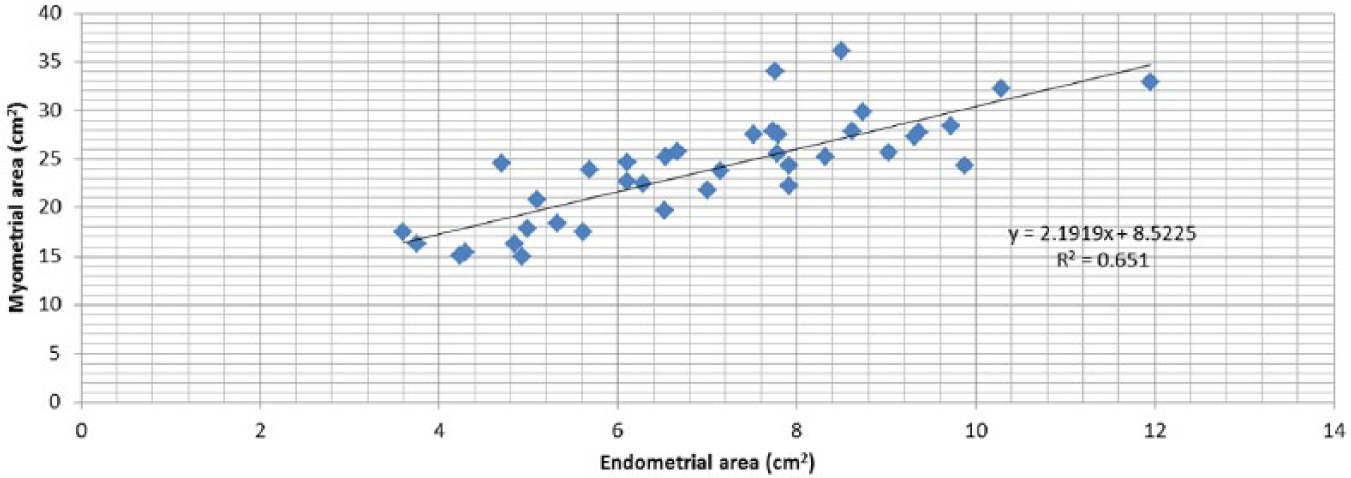
Correlation between endometrial area and myometrial area (N = 38). Pearson correlation R = 0.80, P < .05.
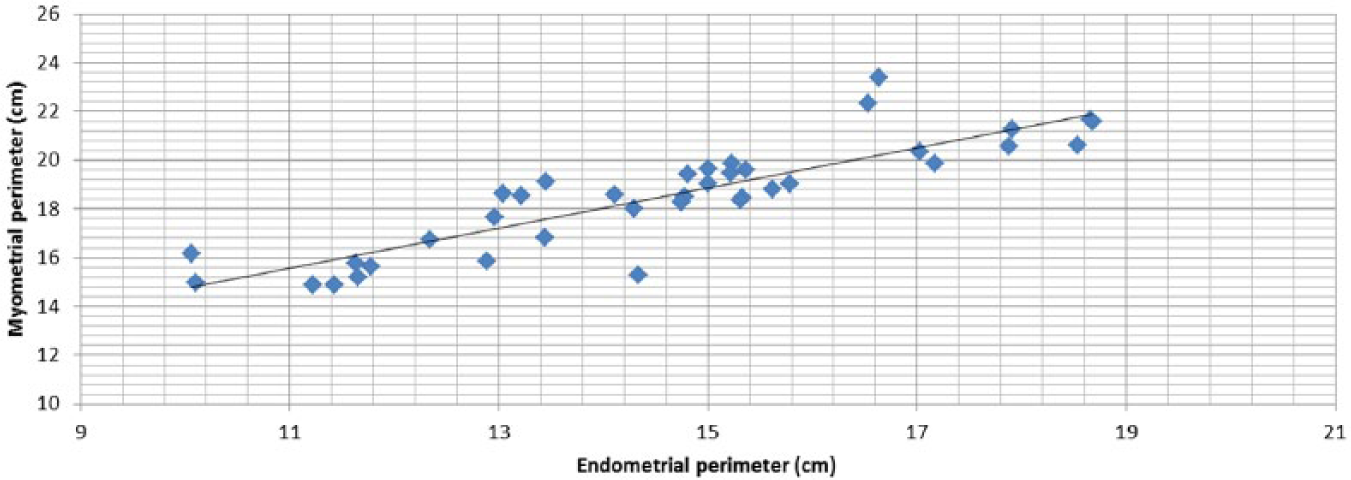
Correlation between endometrial perimeter and myometrial perimeter (N = 38). Pearson correlation R = 0.87, P < .05.
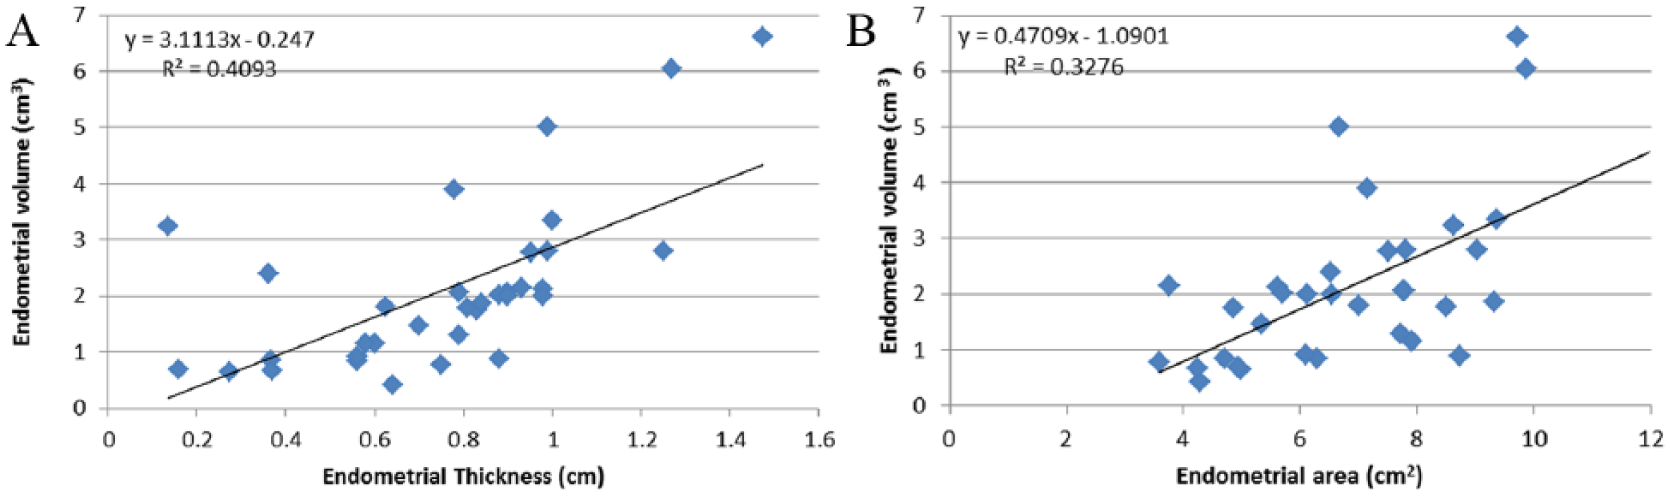
(A) Correlation between endometrial thickness and volume (N = 34). Pearson correlation R = 0.64, P < .05. (B) Correlation between endometrial Volume and area (N = 34). Pearson correlation R = 0.57, P < .05.
A significant positive correlation was found between estradiol blood levels and endometrial thickness, area, and volume (Spearman correlation R = 0.35, P = .032; R = 0.53, P = .001; and R = 0.55, P = .001, respectively).
In a normal uterus, the ratio between the endometrial and myometrial areas (EA/MA) remains relatively constant regardless of endometrial thickness (Figure 9). For an endometrial thickness of 2 to 15 mm, almost all uteri have an EA/MA ratio of 0.28 to 0.3 mm (range, 0.19-0.4 mm; mean = 0.29, SD = 0.046). This observation was also valid for the relationship between the endometrial/myometrial perimeter ratio and endometrial thickness (Figure 10; range, 0.62-0.93 mm; mean = 0.78, SD = 0.064).
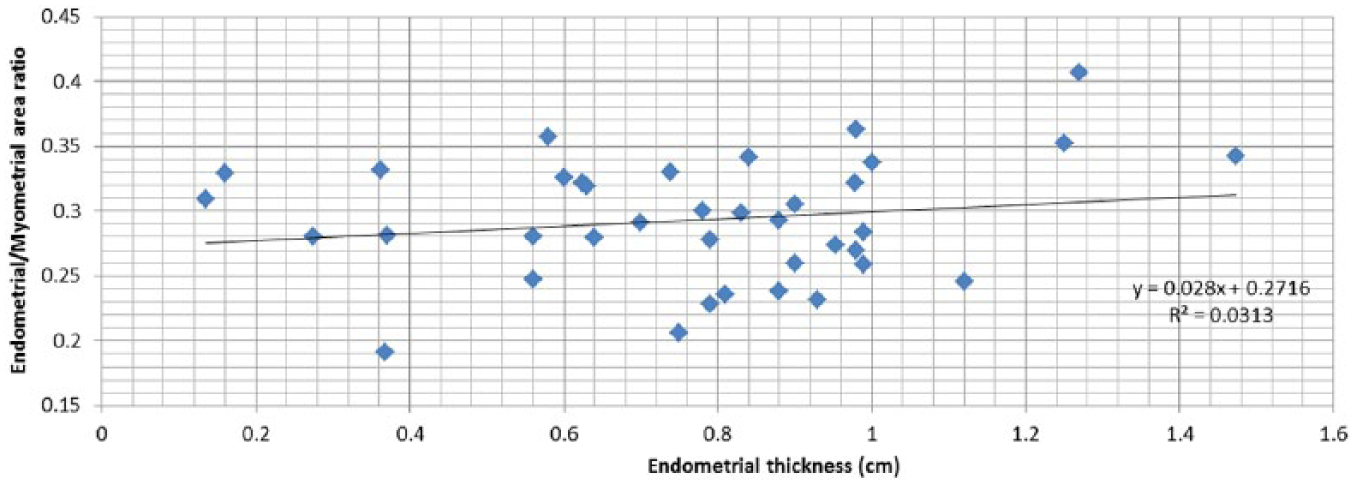
Relationship between endometrial thickness and the ratio between endometrial and myomatrial areas (N = 38). R = 0.177 Pearson.
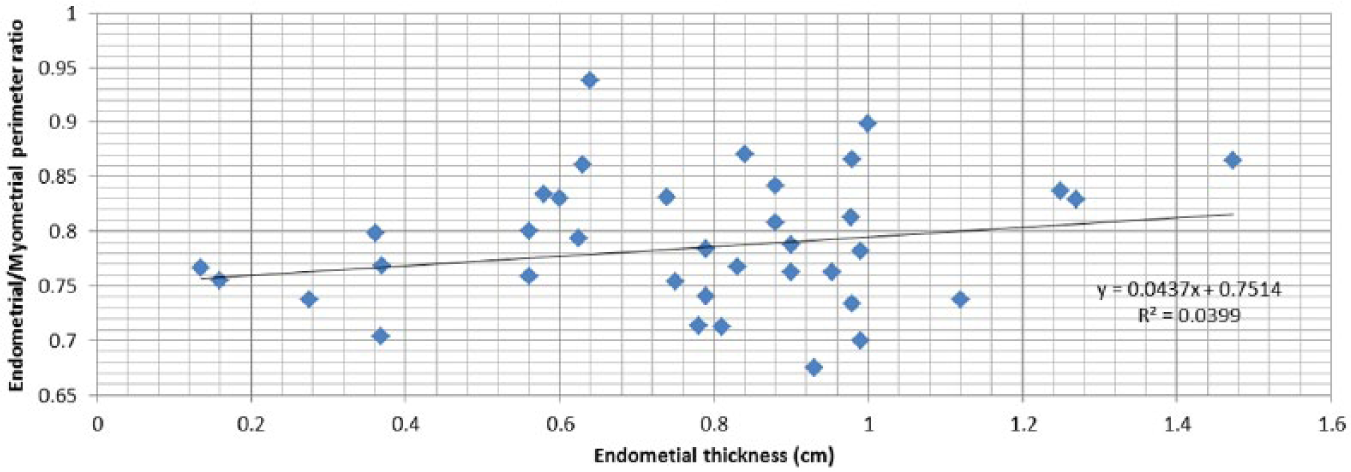
Relationship between endometrial thickness and the ratio between endometrial and myometrial perimeters (N = 38). R = 0.199 Pearson.
Discussion
Endometrial changes are traditionally assessed by measuring the endometrial thickness and morphological echogenicity.6,10 Endometrial thickness increases from 1 to 3 mm with a simple hyperechogenic pattern, to a maximum of approximately 12 mm, with a triple line pattern in the late follicular phase. In the current study, endometrial thickness ranged from 1.3 mm to 14 mm, and E2 levels ranged from 29 pg/ml to 3147 pg/ml.
Endometrial proliferation is mediated by the distribution of estrogen and progesterone in the endometrium and fluctuations during the menstrual cycle.10–15 Endometrial proliferation during the follicular phase is regulated by estrogen receptors (ER). All tissue components (glands, stromal cells, and endothelial cells) demonstrate proliferation, which is marked by increased mitotic activity, reflecting increasing circulating estradiol levels and maximal estrogen receptor concentrations in the endometrium. Data in the present study demonstrated that endometrial thickness, as well as endometrial area and volume, correlate with circulating E2 levels. Furthermore, as reported by Raine-Fenning et al., 9 the present study demonstrated that endometrial volume increases in direct correlation with endometrial thickness.
It might have been expected that the endometrium, under the influence of estrogen and progesterone, would proliferate equally in all three dimensions of the uterus. Our findings indicate that both the anterior-posterior (A-P) plane (endometrial thickness) of the uterus and the coronal plane (endometrial area) increase proportionally (Figure 5) in this cohort of patients. This indicates that endometrial proliferation is seen at the lateral walls of the uterus as well as anteriorly-posteriorly (which is the dimension used for routine measurement of endometrial thickness). However, these are perpendicular planes, one of which is length and the other is area (the length is not part of the area calculation); therefore, their growth is not necessarily correlated.
The correlation between endometrial thickness and volume is stronger than the correlation between endometrial thickness and area (Figure 8). This could be explained by the calculation method: When measuring area in a coronal plane, the A-P thickness is not part of the calculation (perpendicular parameters). However, when measuring endometrial volume, the A-P plane is part of the calculation, and the correlation between endometrial thickness and volume is stronger. It is possible that the geometrical presentation of the axial plane explains the lower than expected correlation. In the axial plane, the maximal thickness of the endometrium is measured at the midline, and there is a consistent decrease in thickness toward the edges. The decreasing endometrial thickness in the axial plane was specific for every single uterus, thus influencing the strength of the correlation between endometrial thickness and volume.
Results of this study demonstrated that in these patients, the myometrial perimeter and area were significantly correlated with changes in the endometrial perimeter and area (Figures 6, 7). These results indicate that their endometrial proliferation during the menstrual cycle occurred in three dimensions and suggests a parallel proliferation in the myometrial dimensions. To the best of our knowledge, this is the first time these changes in the myometrium have been presented.
The results regarding the changes in the myometrium have several possible explanations. One is the presence of estrogen receptors, which are expressed in the smooth muscle tissue of the myometrium.16–19 In addition, the changes in myometrial size can also result from vascular changes. Jokubkiene et al. 20 described significant changes in the endometrial-subendometrial vascularization during the normal menstrual cycle. They measured vascularity indices in the endometrial-subendometrial area and demonstrated an increase throughout the follicular phase. A change in the subendometrial area could affect the measurement of the total myometrial area and explain our finding of a correlation between endometrial area and myometrial area growth.
The current study also found that in these patients, the ratio between the myometrial and endometrial areas did not change regardless of the absolute thickness of the endometrium. Furthermore, the same observation was found for the ratio between the myometrial and endometrial perimeters.
This finding might help provide a better evaluation in cases of congenital mullerian anomalies. Understanding the different ratios in an abnormal versus a normal uterus could assist in future evaluation and classification of the different types of uterine malformations.
This study was limited by its retrospective nature as well as the small number of patients evaluated. Uterine measurements from IVF patients were used because this population undergoes transvaginal sonography as part of the standard treatment protocol during the menstrual cycle. This enabled the retrospective evaluation of uterine measurements during different phases of the menstrual cycle as well correlation with hormonal levels. However, this might also be a limitation of the study results since these patients were in some stage of the IVF process and measurements were taken at various stages of the menstrual cycle. These factors could greatly affect the results because the endometrium is influenced by the IVF medications, and this sample might initially have different measurements than those in the general population of women.
As this is a pilot-level study on the multidimensional measurements of the normal uterus in patients undergoing infertility treatment, it would be interesting to compare our results to a cohort of women with no infertility and try to determine whether the ratios differ. Further studies in which women treated for infertility are compared to the normal population (or to a population of women treated for male infertility) can shed light on this issue. Future larger scale research studies are needed with data in both normal infertile and normal fertile patients in the same stage of the menstrual cycle. It is also suggested that more than one trained professional perform the measurements to calculate interrater reliability.
In this study, women with infertility and normal uterine shape were evaluated to learn about the different dimensions in the normal uterus. Knowledge of the normal ratios between uterine dimensions can be beneficial in the future by comparing them to the ratios in uteri with congenital anomalies. The magnitude of deviation from the normal ratios might be helpful in assessing the role of uterine abnormalities in infertility. Future studies are needed to compare the results of the current study to the measurements of uteri with congenital anomalies as well as to the ratios in women with normal fertility.
In addition, the findings of this study may suggest that the endometrial volume correlates better with circulating E2 than with the thickness. These 3D measurements might be a better approach to evaluate the endometrial response during IVF treatments.
Conclusion
In summary, the present study found that endometrial and myometrial changes correlate in more than one dimension. A significant correlation was found between estradiol blood levels and endometrial thickness, area, and volume. The ratio between the endometrial and myometrial area remained constant regardless of the endometrial thickness. This observation was also found for the relationship between the endometrial/myometrial perimeter ratio and the endometrial thickness.
The goal of this study was to describe the normal ratios between uterine dimensions to have baseline knowledge about the normal uterus. The consistent ratio between endometrial area and myometrial area could form a basis for evaluating congenital and acquired uterine anomalies. Knowing the baseline ratios of normal uteri could help in the assessment of congenital anomalies in terms of the degree of deviation from the normal ratios and might be beneficial in understanding the role of uterine abnormalities in infertility. Additional studies are needed to establish the role of these changes among different uterine pathologies and their implications for pregnancy rates and outcome.
Footnotes
Declaration of Conflicting Interests
The authors declared no potential conflicts of interest with respect to the research, authorship, and/or publication of this article.
Funding
The authors received no financial support for the research, authorship, and/or publication of this article.