
Abstract
Sonography is an accurate and commonly used method of determining the presence, location, and acuity of deep vein thrombosis (DVT). A retrospective data analysis of 284 venous examinations was performed to determine if imaging presets increase the ability to detect an acute DVT. There were no significant differences between the outcomes of three modalities of sonographic imaging. If a patient had a prior DVT, the likelihood of observing another DVT using only two-dimensional imaging, resolution presets, or the B-color option was approximately nine times greater than for a patient who did not have a prior DVT. Sex, age, body mass index, ethnicity, and comorbidities of diabetes and/or hypertension were not significant predictors of observing a DVT. Using a resolution-enhancing preset that increases the overall frequency range to reduce artifacts and improve border definition and/or using the B-color preset to tint the overall image did not improve the likelihood of detecting an acute DVT during a lower extremity venous duplex sonogram.
Introduction
A deep venous thrombosis (DVT) is a blood clot that forms within the lumen of one of the deep veins of the body. Sonographically, a DVT presents as an echogenic soft tissue mass within the lumen of the deep vessel. 1 In the setting of an acute DVT, the vessel lumen diameter typically will also be enlarged compared to the normal resting lumen diameter. 2 The accurate diagnosis of a DVT is vitally important since, if untreated, a DVT can lead to pulmonary embolism and death or chronically cause damage to venous valves, leading to venous reflux.3,4 In the presence of an undetected acute DVT, the development of a pulmonary embolism is the most serious complication. Several limitations of lower extremity venous duplex sonography include patient obesity, soft tissue edema, swelling, extrinsic pressure from an abscess or mass limiting full compression of a vein or extrinsically compressing the vein already, and duplication of femoral veins. False positive results for DVT can be the result of inaccurate gain settings or slow flowing blood mimicking a thrombus. 5 Despite these limitations, sonographic assessment for lower extremity DVT has an overall accuracy and sensitivity of 95% and specificity of 98%. 5 This study was designed to determine whether or not additional ultrasound imaging presets would aid in the diagnosis of an acute DVT.
Materials and Methods
A retrospective data analysis was performed on 284 patients referred for venous duplex examinations from March 2013 to December 2013 at a regional hospital in the western United States. Inclusion criteria included adults older than 18 years referred for evaluation for possible lower extremity DVT using venous duplex sonography. There were no exclusion criteria. The goal was to determine whether using available image enhancements of B-color and resolution sonography presets would increase the visualization and detection of lower extremity deep vein thrombosis. Institutional review board approval was obtained prior to the collection of data. All sonograms were performed using the department-specific lower extremity venous duplex sonography protocol. All examinations were performed by ARDMS-certified sonographers using an L9-3 linear array transducer on the Philips IU22 (Philips Ultrasound, Bothell, Washington, USA) ultrasound machine. All examination data and images were obtained from sonographic databases and electronic medical records.
Patients presented as both inpatients and outpatients to the hospital ultrasound department. The patients’ presenting findings and symptoms included lower extremity pain, swelling and/or erythema, history of DVT or pulmonary embolism, and elevated D-dimer. The examination protocol calls for the patient to lie in a supine position with the head slightly elevated and the leg to be examined uncovered with slight external rotation. Conventional two-dimensional (2D) graded compression, color, and pulsed wave Doppler techniques were used to examine the common femoral, great saphenous, femoral, and popliteal veins. Figure 1 demonstrates the initial side-by-side 2D image of graded compression of the femoral vein in the setting of an acute DVT. B-color and resolution imaging presets were then used in a side-by-side dual image comparison with standard 2D imaging at the level of the common femoral, femoral (upper thigh), and popliteal veins. Examples in a patient with an acute DVT are shown in Figure 2, a side-by-side 2D image alongside the B-color preset, and in Figure 3, a side-by-side comparison of 2D imaging and the resolution preset. Figure 4 shows a longitudinal B-color image of the femoral vein.
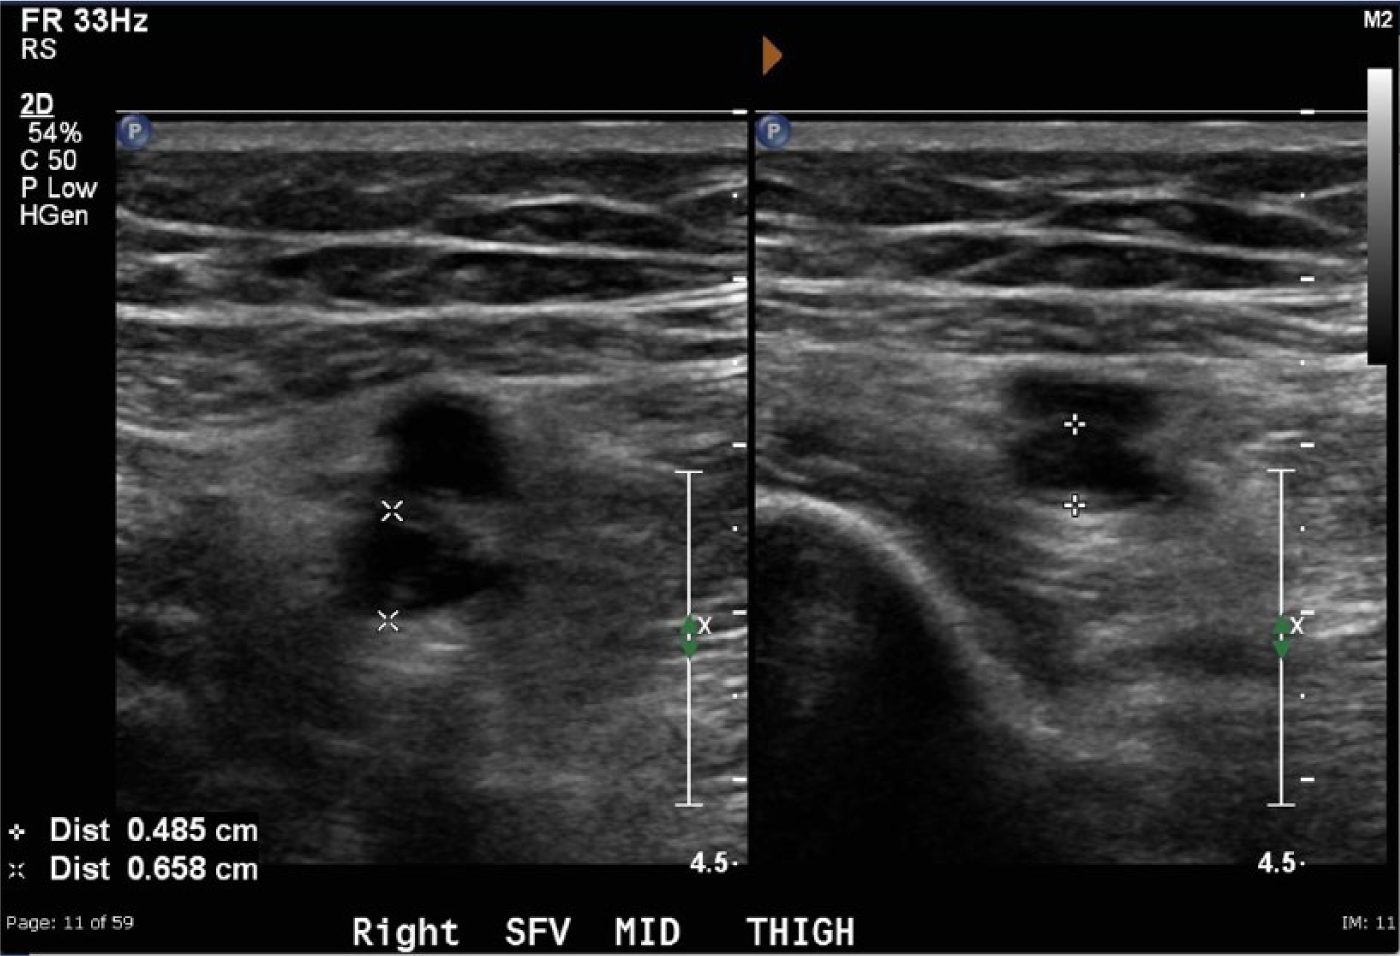
Side-by-side conventional two-dimensional gray-scale image of an acute deep vein thrombosis shown without (left) and with (right) probe compression.
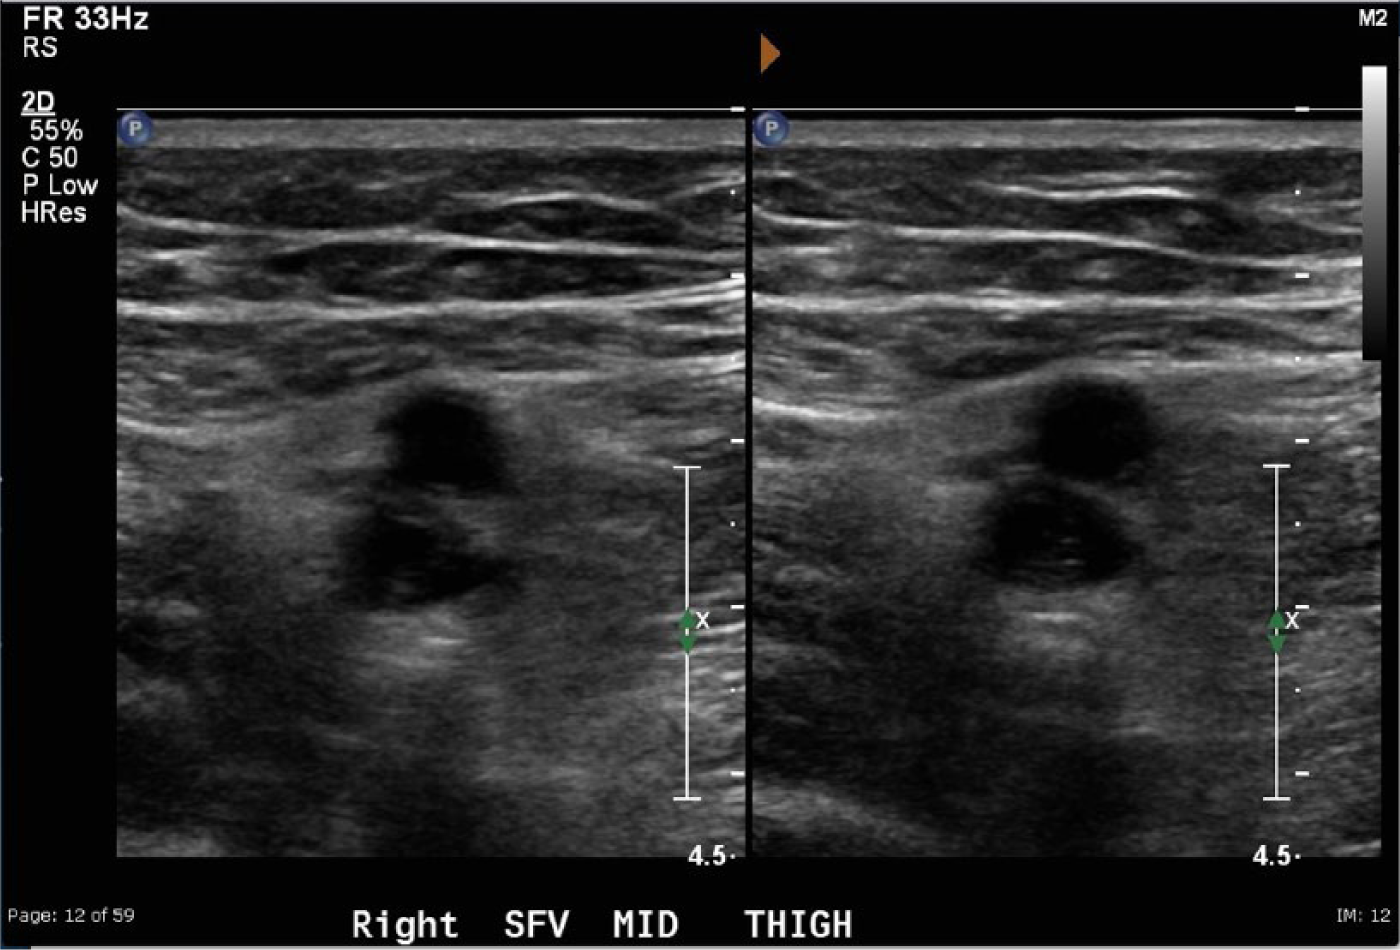
Side-by-side two-dimensional gray-scale images of the same acute deep vein thrombosis shown in Figure 1 using conventional gray scale settings on the left and with the resolution presets on the right.
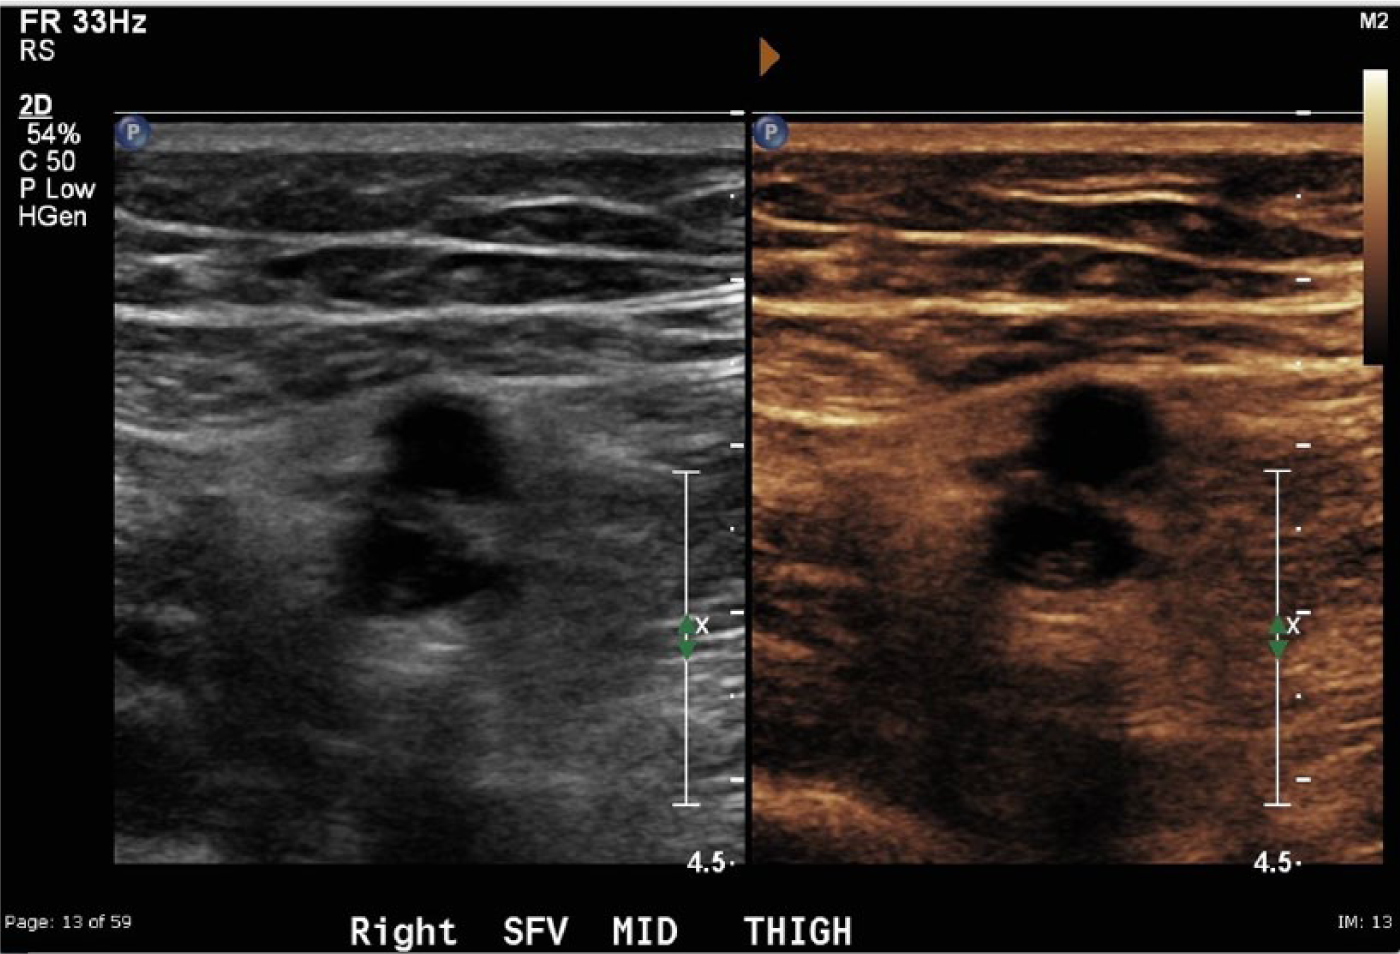
Side-by-side two-dimensional images of the same acute deep vein thrombosis shown in Figure 1 using conventional gray-scale settings on the left and with the B-color settings on the right.
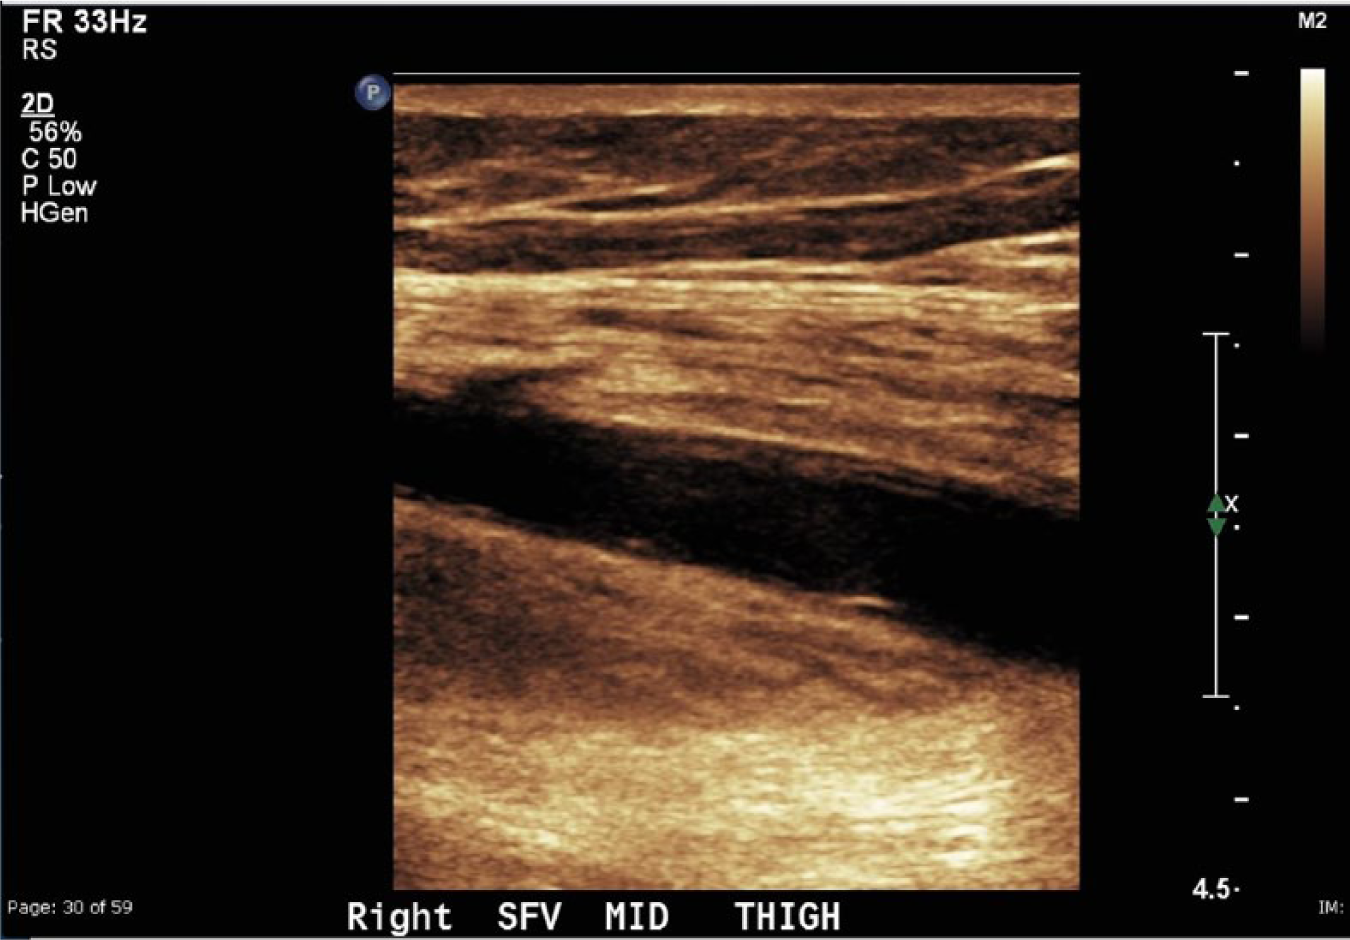
Longitudinal view of the acute deep vein thrombosis shown in the preceding figures using the B-color preset showing enhanced tissue border detail.
The dependent variable was the presence or absence of DVT. The independent patient variables for this study included age, sex, ethnicity, body mass index (BMI), diabetes, and hypertension. The additional independent imaging variables were DVT seen with standard 2D imaging, DVT seen with the resolution preset, and DVT seen with the B-color preset. Examination results and patients’ clinical information were abstracted from electronic medical records and documented in an Excel (Microsoft, Redmond, Washington, USA) data sheet. A key was made to de-identify patient information with a sequentially coded numeric value. All dependent and independent variables were included on the data sheet.
Data Analysis
The frequencies of observing an acute DVT by the three modalities of sonographic imaging (2D only, with the resolution presets, or with the B-color option) were computed and classified by seven demographic-clinical patient factors (sex, age, BMI, ethnicity, and prior diagnosis of diabetes, hypertension, and DVT). Chi-square tests were applied to determine if there were significant differences at α = .05 between the frequencies of DVT observed using the three modalities. Binary logistic regression models were constructed to predict the likelihood of observing a DVT by the three modalities, using the demographic-clinical factors as predictors. The regression coefficients (β) and odds ratios (ORs) were tested for statistical significance at the α = .05 level. The statistical analysis was conducted using SPSS version 20.0 (IBM Software Solutions Group, Rochester, New York, USA).6–9
Results
Table 1 presents the frequencies of DVT observation using the three imaging modalities, classified by the seven demographic-clinical factors. The sample consisted of 284 patients, more than half of whom were female (162, 57.0%). Most of the patients were older than 50 years (179, 63.0%). More than three quarters (218, 76.8%) were classified as overweight or obese (BMI ≥ 25 kg/m2). White/non-Hispanic patients were in the minority; the ethnicity of more than half of the patients was classified as Hispanic, black/non-Hispanic, or other (161, 56.7%). More than one third of the patients were previously diagnosed with diabetes (103, 36.4%), and nearly two thirds with hypertension (181, 63.7%); however, relatively few patients had had a prior DVT (39, 13.7%).
Frequency of DVT Observation by Three Modalities of Sonographic Imaging among 284 Patients Classified by Seven Demographic-Clinical Factors.
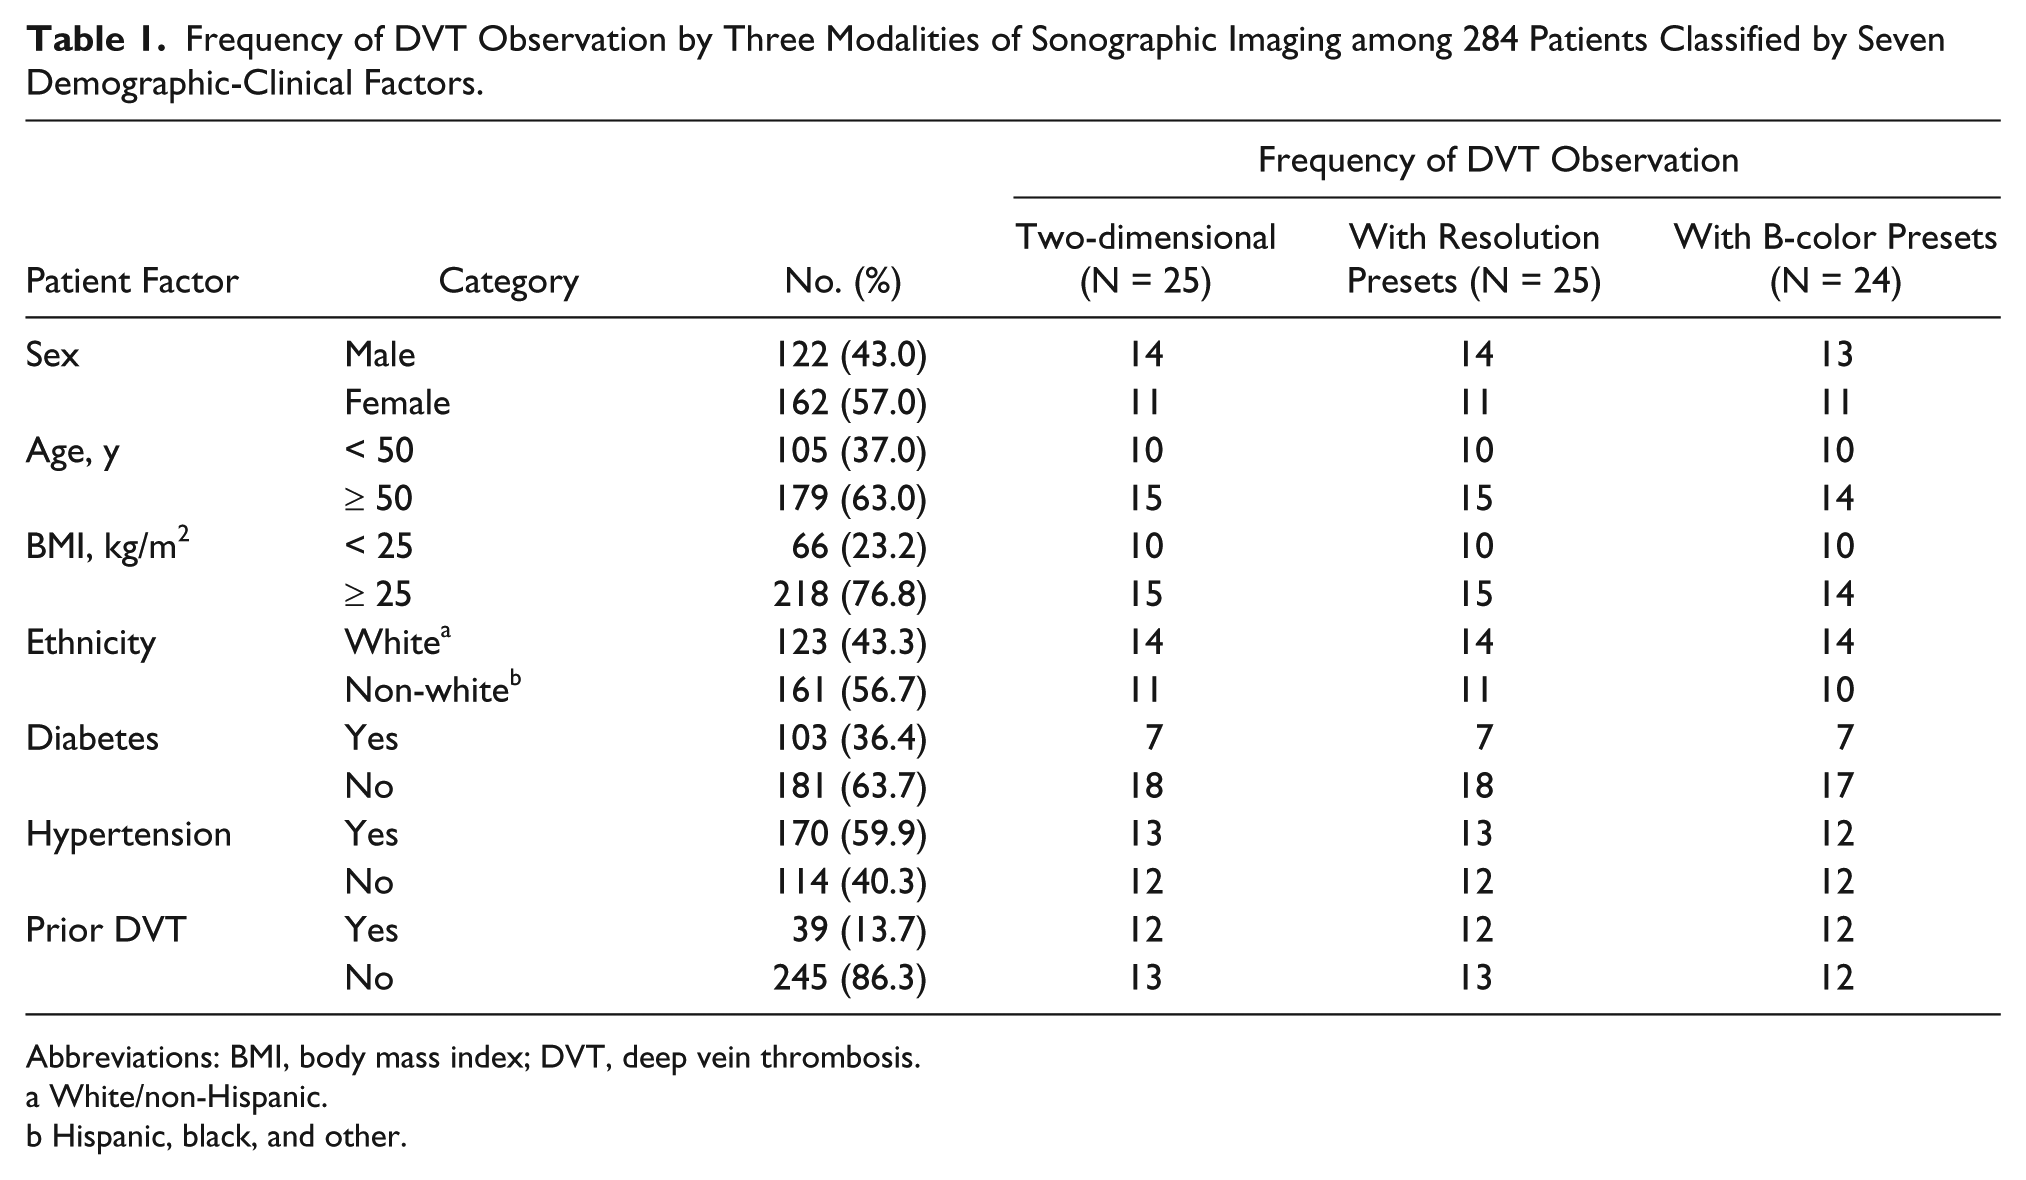
Abbreviations: BMI, body mass index; DVT, deep vein thrombosis.
White/non-Hispanic.
Hispanic, black, and other.
Using 2D imaging, an acute DVT was observed in 25 patients (8.8%). These cases of DVT were also seen in the same patients using the resolution presets. Using the B-color option, a DVT was observed in 24 of the patients (8.5%). A DVT was seen in one patient (male, Hispanic, age 59, no diabetes, with hypertension, and no prior DVT) using conventional 2D imaging and with the resolution presets, but not with the B-color option. Chi-square tests indicated no significant differences (P = 1.000) between the frequencies of DVT observed using the three imaging modalities. An incidental observation during the study, not quantified, was an apparent enhancement of tissue border definition when using the B-color preset.
Table 2 presents a binary logistic regression constructed to predict the likelihood of observing a DVT using only 2D sonographic imaging, without presets. Sex, age, BMI, ethnicity, diabetes, and hypertension were not significant predictors at α = .05. One patient factor was statistically significant (P < .001); if a patient had a prior DVT, then the likelihood of observing another DVT was about nine times greater (OR = 8.8; 95% CI, 3.4-22.6) than in a patient who did not have a prior DVT. Exactly the same model was computed to predict the likelihood of observing a DVT using the resolution presets with the same results.
Binary Logistic Regression Model to Predict the Likelihood of Observing DVT by Two-dimensional Sonographic Imaging (Identical Results Were Found with or without Resolution Presets).
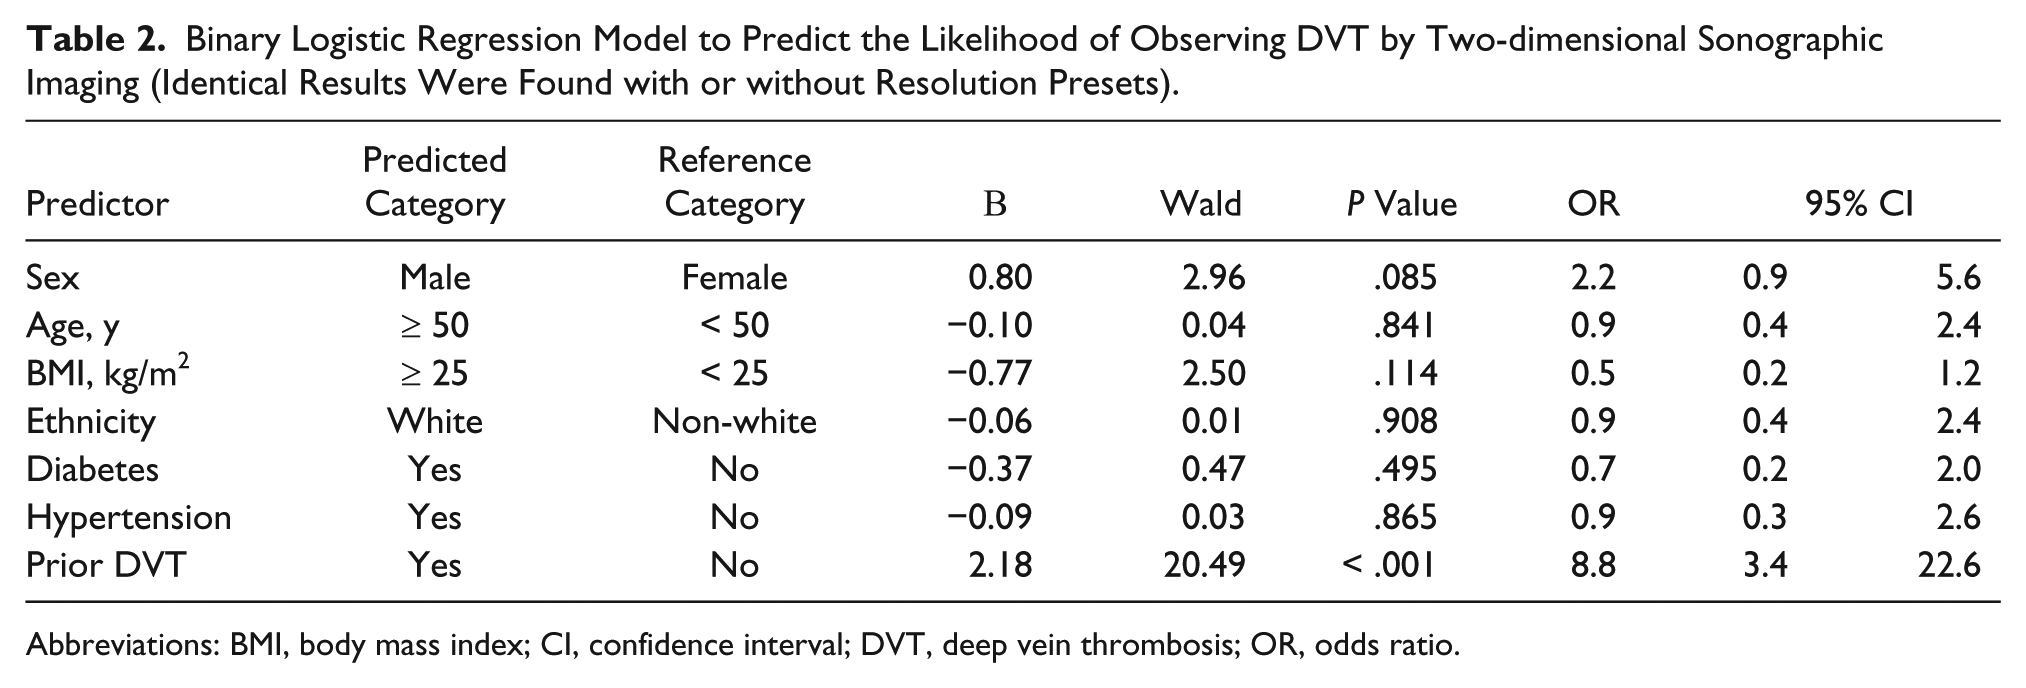
Abbreviations: BMI, body mass index; CI, confidence interval; DVT, deep vein thrombosis; OR, odds ratio.
Table 3 presents the binary logistic regression model constructed to predict the likelihood of observing a DVT using the B-color option. This model predicts that if a patient had a prior DVT, the likelihood of observing another DVT using the B-color option was also about nine times greater (OR = 9.3; 95% CI, 3.6-24.2) than in a patient who did not have a prior DVT. The overlapping 95% CIs for the ORs indicated that the model in Table 3 was not significantly different from the model in Table 2. 9
Binary Logistic Regression Model to Predict the Likelihood of Observing DVT Using the B-color Option.
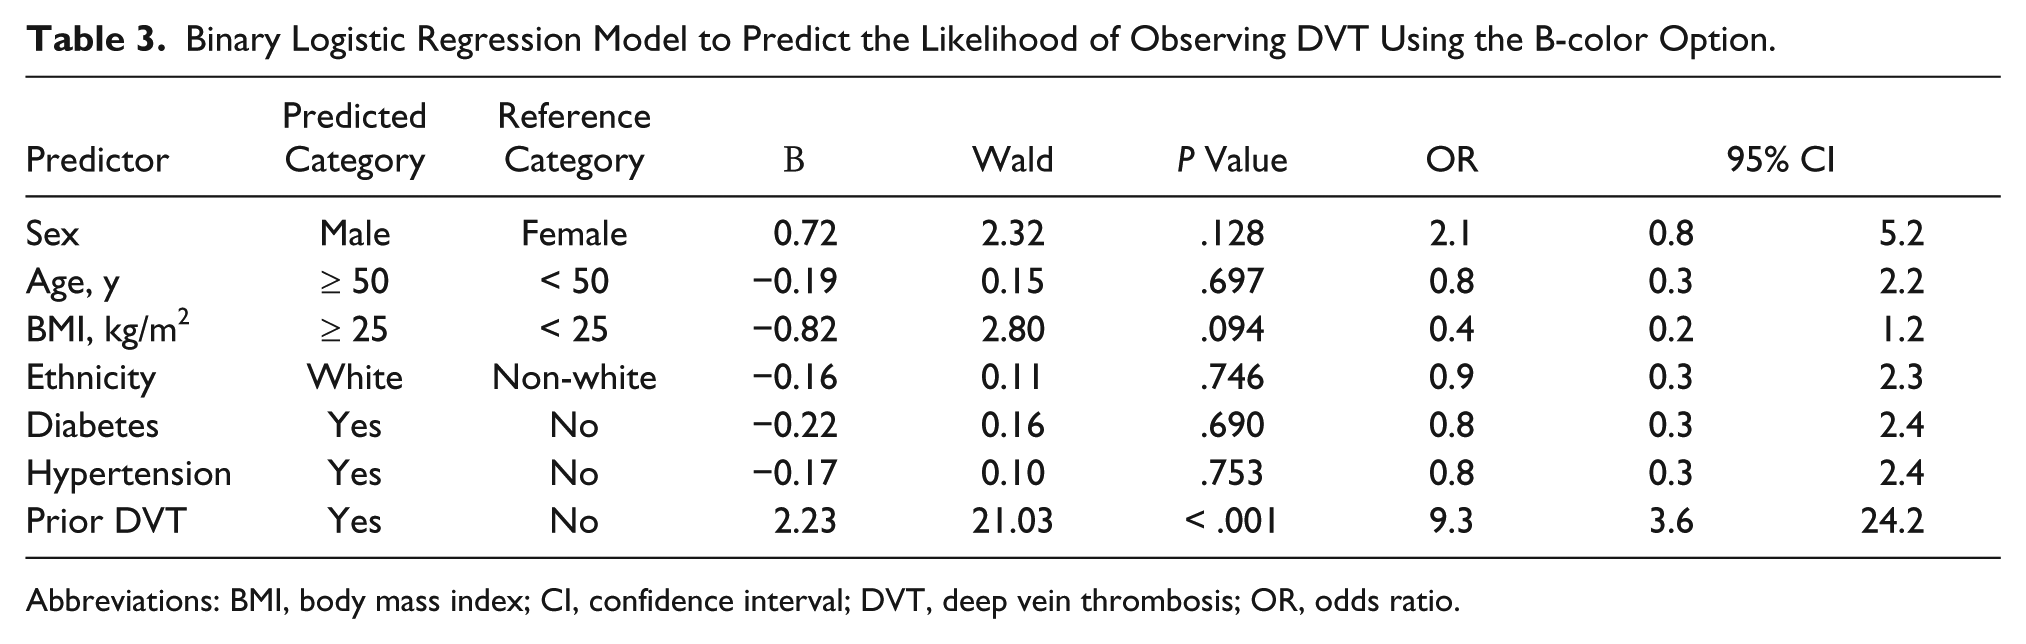
Abbreviations: BMI, body mass index; CI, confidence interval; DVT, deep vein thrombosis; OR, odds ratio.
Discussion
There is a variety of causes of deep venous thrombosis. In the mid-1800s, Rudolph Ludwig Karl Virchow proposed a groundbreaking theory on venous thrombosis that is still relevant today. Virchow’s triad of venous thrombosis states that thrombosis results from a confluence of three causative factors: hypercoagulability, venous stasis, and vascular endothelial injury. These three factors still hold true today in the clinical diagnosis of deep venous thrombosis. 10 In conjunction with these causes, research has shown that the leading clinical risk factors for DVT include obesity, diabetes, immobility, and cancer. Hypertension has also recently been listed as a potential risk factor for deep venous thrombosis. 11 In a registry of patients with DVT confirmed by sonography, the most frequent comorbidities included prior DVT, surgery, immobility, and cancer. Cancer patients had up to twice the incidence of DVT than patients without cancer, and of those patients, those with pancreatic cancer had the highest incidence.11–13 Kyrle et al. 14 reported on recurrent DVT in male and female patients and determined that males have a much higher risk of recurrent DVT. There is also a marked increase in DVT diagnosis with increasing patient age. 15 The prevalence of DVT in the United States currently is estimated to be approximately 300 000 to 600 000 patients per year 16 with an estimated 100 000 to 180 000 deaths attributed to pulmonary embolisms annually. 17
Historically, the standard modality for detection of a DVT was the contrast venogram. 18 This x-ray guided examination began in the 1930s and is still used, though rarely, today. 10 The emergence of diagnostic sonography in medicine began in the 1950s, and in the early 1980s, sonography was introduced as a diagnostic tool for detection of DVT.19,20 Since then, advances in imaging technology have enabled it to become the initial and most practical choice for diagnosis, especially in symptomatic patients. 21 Sonography is the only imaging technique that eliminates the cost, radiation, and contrast media exposure that other modalities employ such as venography, computed tomography, or magnetic resonance imaging.
Sonographic evaluation for DVT was quick to be shown to provide a more effective diagnosis in the emergency department.1,19,22 In 1995, Miller et al. 23 compared duplex sonography and contrast venography, finding that with accurate technique in sonographic scanning, diagnosis of an acute DVT was highly accurate. In their study, more than 90% of cases were able to forgo a contrast venogram; other studies at the time showed very similar results.23–25 Magnetic resonance imaging (MRI) is another imaging tool for DVT that was found in some instances to be more sensitive than sonography, particularly in anatomic regions not readily accessible to ultrasound such as cases of pelvic thrombus. 24 However, MRI still carries potential limitations and risks to the patient such as an inability to perform examinations because of metal implants. Potential risks to patients include contrast reactions and patient claustrophobia, and compared to sonography, MRI is significantly more costly.5,20 In 2003, Tovey and Wyatt 26 described contrast venography as the current gold standard but highlighted its limitations of being invasive, involving ionizing radiation, and carrying a risk of allergic reaction.
Sonography today remains the best initial procedure for diagnosing DVT as long as a complete protocol is followed. The American College of Radiology has indicated that a thorough sonographic examination for DVT includes real-time imaging of compression of the vessel, color flow imaging, and spectral Doppler evaluation. 25 Compression is accomplished by applying probe pressure directly over the site of visualization of the lumen of the vessel, with full vessel compression indicative of absence of any intraluminal thrombus and negative for DVT. Spectral Doppler signals are able to evaluate the blood flow and velocity at a specific site in the blood vessel and can indicate the hemodynamic abnormalities associated with a DVT. Color flow imaging is able to show filling defects associated with a partially occlusive DVT.26,27 A large-scale meta-analysis by Goodacre et al. 27 showed that compression sonography had a greater specificity when diagnosing DVT, whereas the combination of color and spectral Doppler techniques had a greater sensitivity. Prandoni et al. 28 evaluated thrombus thickness with compression sonography to determine the likelihood of recurrent proximal vein thrombosis. Recently, Zhao et al. 29 reported on the use of three-dimensional (3D) ultrasound to document deep vein thrombus and measure echogenicity in first-time DVT patients. They found that 3D imaging accurately measures thrombus volume and evaluates echogenicity over a period of time.
Although a significant amount of research has been compiled to compare and contrast different imaging modalities as they relate to lower extremity DVT diagnosis, very little has been done to assess the capabilities of alternative imaging presets available on most ultrasound machines in this diagnosis. This project analyzed the detection of acute lower extremity deep venous thrombosis (DVT) comparing standard 2D sonographic imaging with the resolution and B-color presets. The resolution selection on the machine is based on the utilization of a transducer with a broad bandwidth, resulting from probe construction with increased damping material allowing a shorter spatial pulse length. The resolution preset will select the higher frequency range of the multi-Hertz transducer, improving the (axial) spatial resolution in the image at the cost of some decrease in penetration. For example, for a linear array transducer with a specified frequency range of 6 to 9 MHz, using this function would shift the central frequency toward 9 MHz. The B-color selection applies a color map to the overall sonographic image, taking advantage of the wider response of human vision to color than to gray-scale. An orange B-color preset was the standard protocol for lower extremity venous duplex examinations used for this study, and an incidental observation during the study was the enhancement of tissue borders in the B-color images compared to conventional 2D sonography. The results of this study have shown that use of these presets does not increase the accuracy or ability of sonography to make a positive diagnosis of DVT.
Conclusion
The statistical evidence indicated that there were no significant differences between the outcomes of the three modalities of sonographic imaging. If a patient had a prior DVT, then the likelihood of observing another DVT whether using only 2D imaging, the resolution presets, or the B-color option was about nine times greater than in a patient who did not have a prior DVT. The sex, age, BMI, ethnicity, and comorbidities (diabetes and hypertension) of the patients were not significant predictors of observing a DVT. The practical implications are that using the resolution preset to adjust frequency to reduce artifacts and improve margin and border definition, and/or using the B-color option to tint the overall ultrasound image a specific color, does not improve the likelihood of detecting an acute DVT during a lower extremity venous duplex study. It was observed that while using the B-color option to tint the overall image, border definition was enhanced when imaging an acute thrombus, as shown in Figure 4. Further investigation of the significance of this border definition could be used in future research.
Footnotes
Acknowledgements
The author would like to thank and acknowledge the sonography staff at Community Regional Medical Center for their assistance in obtaining the raw data for this research study and to thank Joy Guthrie, PhD, for her guidance and mentorship throughout this research project.
Declaration of Conflicting Interests
The authors declared no potential conflicts of interest with respect to the research, authorship, and/or publication of this article.
Funding
The authors disclosed receipt of the following financial support for the research, authorship, and/or publication of this article: This research was supported in part by a grant from the Sonography Research Institute of the Society of Diagnostic Medical Sonography Foundation.