
Abstract
Surveillance following abdominal aortic endovascular aneurysm repair (EVAR) is imperative to confirm graft patency, analyze residual sac size (RSS), and evaluate for complications. This retrospective study evaluated ultrasonographic (US) surveillance after EVAR compared to computed tomography (CT). US was done by 1 of 11 experienced registered technologists. US was ordered for surveillance more frequently than CT, with a ratio of 4:1. Compared to CT, US endoleak evaluations were 74% sensitive and 76% specific with a 63% positive predictive value and 84% negative predictive value. However, 11 CT scans were likely false negatives, and 1 CT was a false positive. For true positives that stated endoleak type, there was a 93% agreement between the type on US and CT. US had a 75% accuracy for RSS (95% CI, −1.02 to 1.16). These data support the use of US along with clinical symptoms as a first-line surveillance program after EVAR and are widely applicable to the majority of vascular laboratories that employ multiple registered vascular technologists. The adaptation of increased US surveillance would decrease the number of CT scans, thereby significantly reducing cost and radiation/contrast exposure to patients.
Introduction
The incidence of abdominal aortic aneurysm (AAA) increases with age, with 5.2% of women and 12.5% of men aged 75 to 84 having an aneurysm between 2.9 and 4.9 cm in diameter. 1 The risk factors for developing an AAA include age, gender, smoking, hypertension, hypercholesterolemia, atherosclerosis, and a family history of aneurysm.1,2 Larger diameter AAAs have an increased risk of rupture with a risk of death up to 90% if rupture occurs. 1 Ultrasonography (US) is currently the preferred method of initial diagnosis and surveillance for AAA. 3
Although open surgical repair traditionally had been the standard therapy for expanding AAAs, endovascular aneurysm repair (EVAR) was introduced as an alternative in the past 20 years and has become the predominant treatment modality.2,4,5 In fact, the number of elective EVAR surgeries for AAA increased from 39% to 72% between 2001 and 2006. 6 EVAR has been shown to have reduced perioperative morbidity and mortality and a more rapid recovery when compared to open surgical repair.2,3,5–10 Surveillance following EVAR is imperative to confirm graft patency, analyze residual sac size (RSS), and evaluate for complications such as endoleak that can potentially lead to rupture.2,6,9–13 A 2012 study by Baumueller et al. 14 noted, “The most important predictor for the presence of complications is the continuous growth of the excluded aneurysm sac” and “an increase in diameter of the aneurysm sac is the first sign for an adverse outcome.” Traditionally, computed tomography (CT) and CT angiography (CTA) have been utilized for surveillance, but they are costly and involve significant radiation and contrast exposure.6-9,13
Many vascular surgeons are ordering the safer and less expensive duplex US that combines gray-scale, color Doppler, and spectral Doppler imaging. A 2013 study by Patel et al. 15 acknowledged, “Despite the frequent use of CT in the first year post-EVAR, there does appear to be a trend towards using ultrasound after the first year of follow-up.” Another study reported that physicians requesting post-EVAR imaging increased their ordering of abdominal US from 10% to 34% between 2004 and 2011. 6 To date, the majority of studies done comparing US to CT after EVAR were conducted with only one person performing the US studies; however, it is widely accepted in the literature that US is particularly dependent on the operator.1,7,9,11,12,16 Although a greater amount of variability is potentially introduced by having multiple registered vascular technologists (RVTs) perform studies, the research is widely applicable to the majority of vascular laboratories that employ multiple RVTs. This study evaluated current outcomes of US surveillance after EVAR in a dedicated vascular laboratory with multiple RVTs to further assess if US can be reliably used as a first-line surveillance modality.
Methods
Institutional review board (IRB) approval was obtained for this study prior to data collection. Patient data were extracted from the database of a vascular laboratory based in a large multispecialty medical group in the northeast United States. From 2006 to 2013, the vascular laboratory performed approximately 3300 abdominal aortic US studies. This retrospective study reviewed US and CT reports from patients who had undergone abdominal aortic EVAR. All patients who had an abdominal aortic EVAR with at least one abdominal US between the years of 2011 and 2013 were reviewed for inclusion in this study, and the data for this group of patients were reviewed from 2006 to 2013.
US Data Collection
US reports were obtained from Datacheck (DataStar Systems, Toms River, NJ), the database and reporting system used by the vascular laboratory. US data were acquired by 1 of 11 experienced, certified RVTs who were credentialed through the American Registry for Diagnostic Medical Sonography (Rockville, MD). Stent graft (SG) images and measurements were obtained using a curved 2.0-5.0 MHz transducer on a Philips iU22 xMatrix US System (Philips Healthcare, Andover, MA). Following our vascular laboratory protocol, transverse (TRV) and sagittal (SAG) gray-scale images of the abdominal aortic SG were acquired with maximum anterior-posterior (AP) and TRV measurements of the residual sac obtained by placing the electronic calipers from outer wall to outer wall (Figures 1 and 2). Color Doppler imaging was optimized and utilized to assess for the presence of flow at first within the SG and then outside of the SG but within the residual sac (Figure 3). Spectral Doppler velocity measurements were used to confirm patency of the SG, the bilateral proximal common iliac arteries, and if applicable, the presence of any flow outside of the SG but within the residual sac. Peak systolic velocity was recorded from all of the spectral Doppler recordings. US examinations were read by experienced, qualified vascular surgeons. The US reports were reviewed to collect data on the date of service, patient gender, patient age, RVT performing the study, SG patency, RSS, presence or absence of an endoleak, and the type of endoleak if one was present.
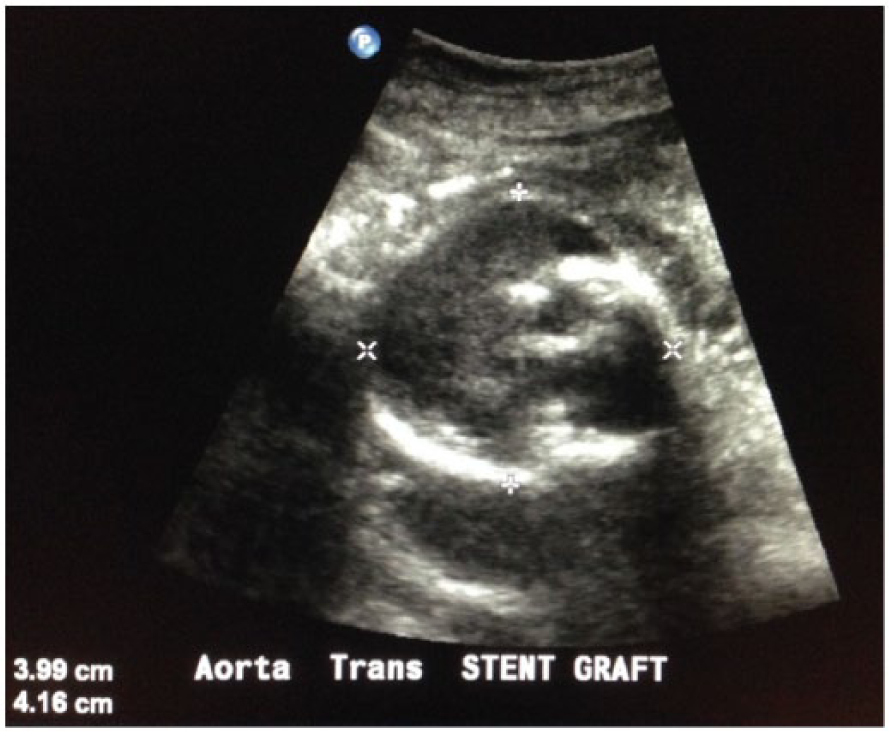
Transverse gray-scale image of aortic stent graft showing the anteroposterior and transverse aneurysm diameter measurements.
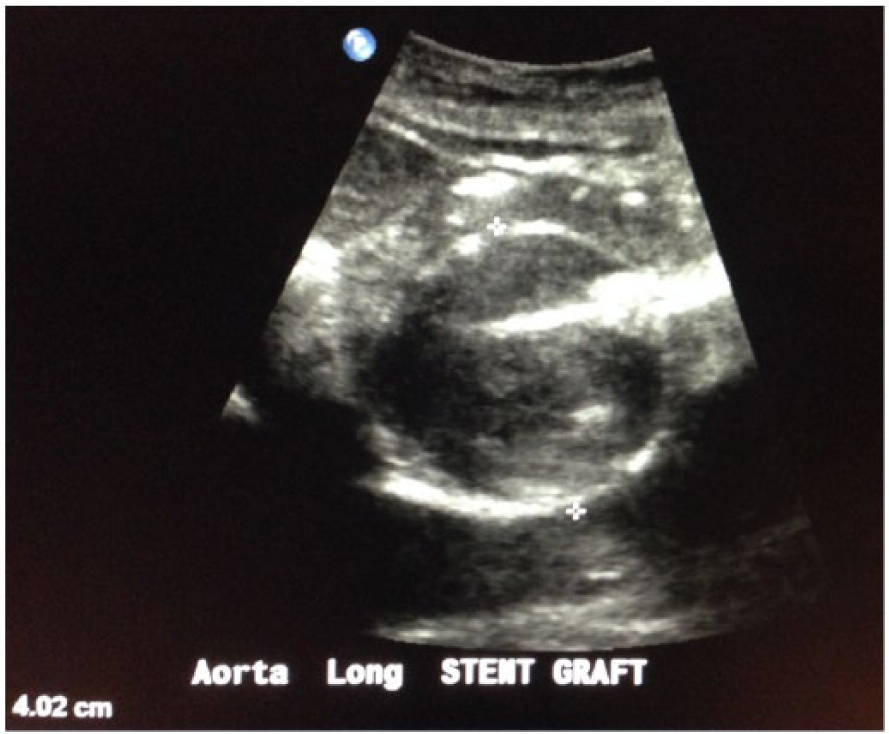
Sagittal gray-scale image of aortic stent graft on the same patient showing the anteroposterior aneurysm diameter measurement.
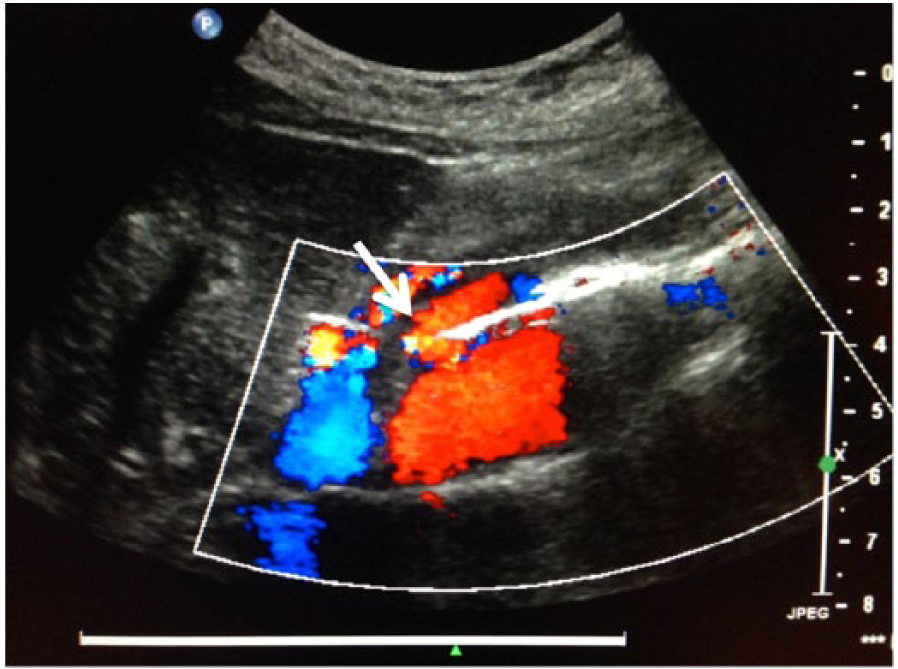
Sagittal color Doppler image of aortic stent graft on the same patient showing a prominent endoleak (arrow) anteriorly within the residual sac.
CT Data Collection
The medical practice database and the patient chart provided information on whether a corresponding abdominal CT had been performed within six months of an abdominal US. All of the patients who had both an abdominal CT and US done within six months of each other were reviewed for inclusion in this study. The CT reports were obtained from the database and/or the patient chart. The CT scans were done following a standard EVAR protocol using helical multislice multidetector axial images with multiple reformatted coronal and sagittal images obtained according to protocol, and when ordered, contrast was administered per protocol (Figures 4 and 5). CT reports were read by qualified radiologists or qualified surgeons. The CT reports were reviewed to collect data on the date of service, SG patency, RSS, presence or absence of an endoleak, and the type of endoleak if one was present. When multiple abdominal CT scans were performed within six months of one abdominal US, the CT within the closest time frame was used in this study unless the CT did not mention RSS or the presence or absence of an endoleak. If this was the case, then the CT performed within the next closest time frame was used in this study. Fifteen CT scans that were done within six months of an US were excluded from this study according to the aforementioned criteria, as additional CT scans had been performed within six months of the same US. On one patient, two CT scans had been done within three days of each other. One of these CT scans only mentioned the RSS and did not evaluate for endoleak, while the other only evaluated for endoleak and did not mention RSS. Both of these CT scans were used in the comparison to the one US (one for RSS and the other for endoleak).
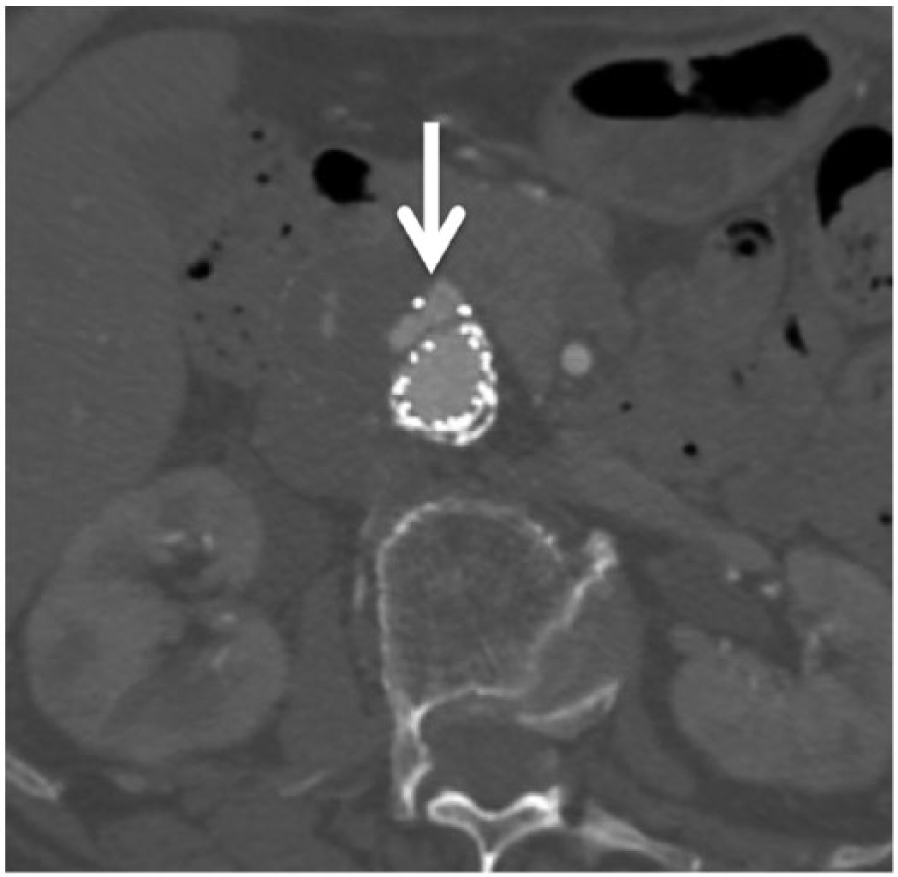
Axial computed tomographic (CT) image with contrast of aortic stent graft on the same patient showing the endoleak (arrow) seen in Figure 3.
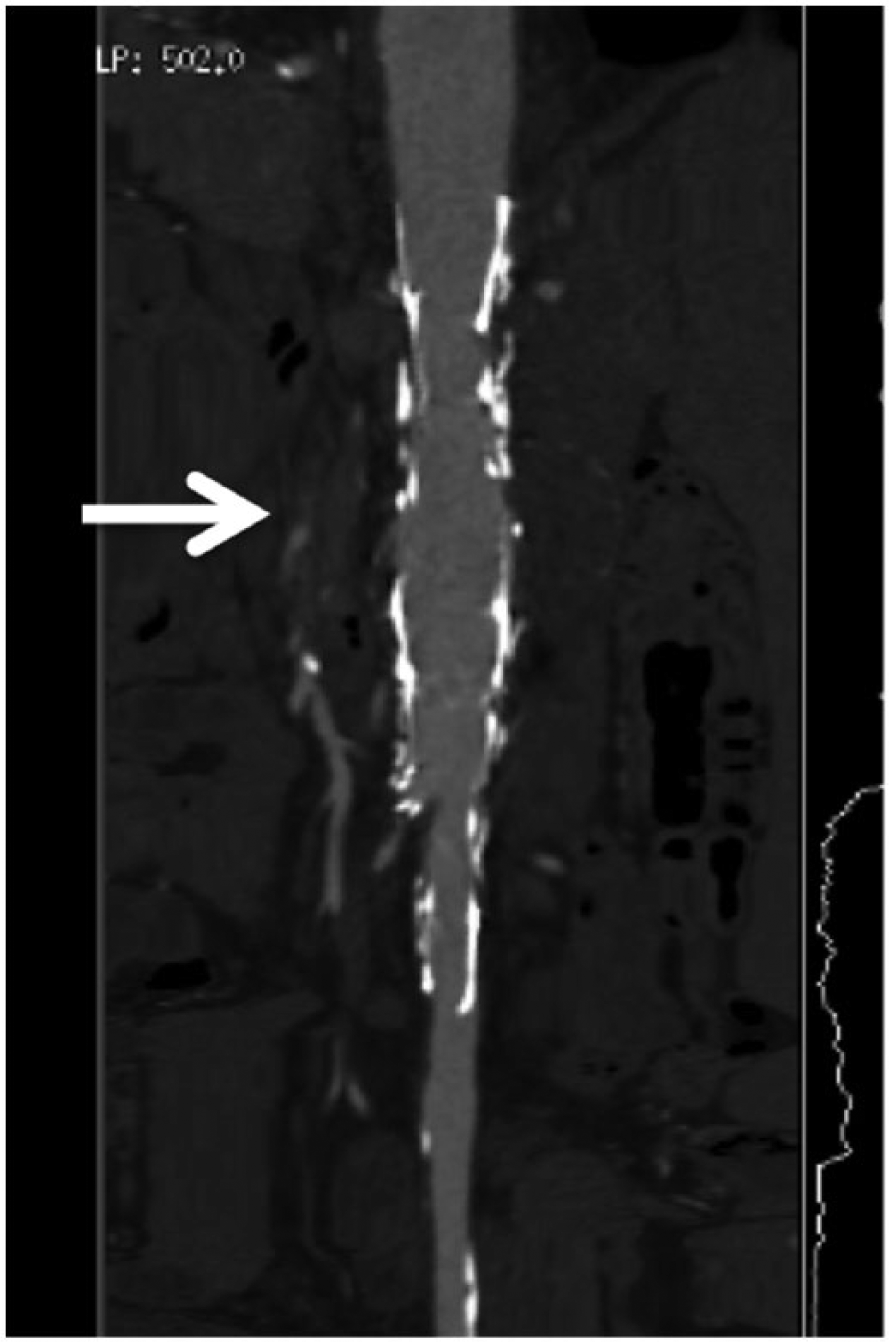
Reconstructed 3-dimensional computed tomographic image with contrast of aortic stent graft on the same patient showing the endoleak (arrow).
Analysis of the Prevalence of US Surveillance
The analysis of the database showed US surveillance for 350 EVAR patients. The Datacheck database provided a record of all of the US studies performed on this group of patients from 2006 to 2013, and these patients had a total of 1196 abdominal US studies performed during this time period. A total of 298 abdominal CT scans had been performed on this group of patients within six months of an abdominal US.
Patency, Endoleak, and Residual Sac Size Analyses
The number of patients ultimately analyzed for this study was 169 while the number of paired abdominal US and CT scans analyzed was 282 (Figure 6). The US and CT scans were all performed between August 2007 and December 2013. Thirteen patients and 25 paired studies (9%) were excluded from this analysis for the following reasons: intervention between the 2 studies in 4 pairs (16%), SG repair on only 1 study in 6 pairs (24%), no mention of RSS/endoleak on 1 study in 11 pairs (44%), US not performed by RVT in 3 pairs (12%), and SG repair of the iliac arteries only in 1 pair (4%). After these initial exclusions, 156 patients with 257 paired abdominal US and CT scans remained. Consistent with the current literature, for analysis purposes the CT results were considered the gold standard.1,7-9,11,17
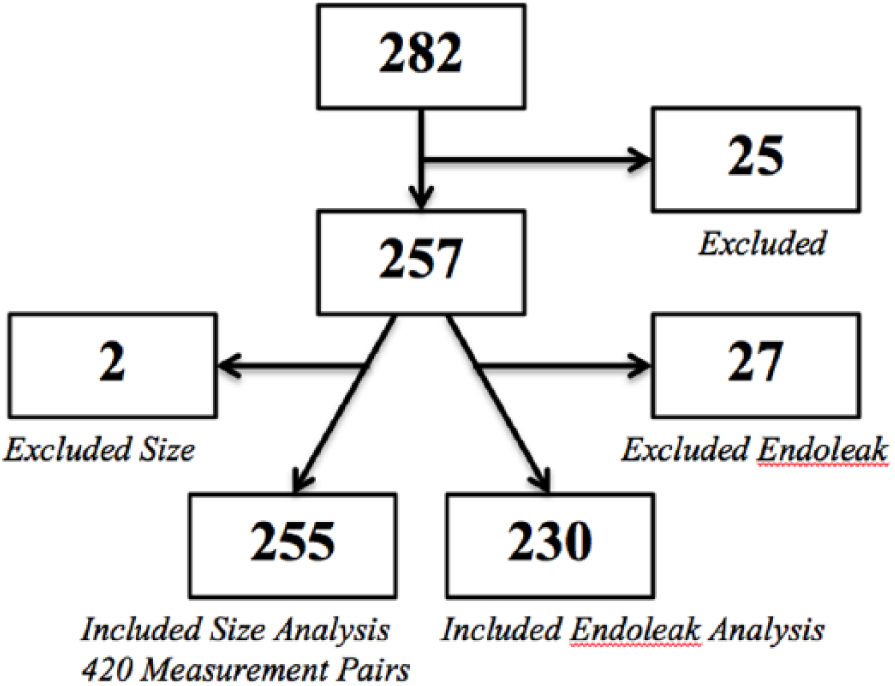
Block diagram showing the number of excluded and included paired studies in the residual sac size and endoleak analyses. A total of 282 paired ultrasonographic (US) examinations and computed tomographic (CT) scans were analyzed in this study. Twenty-five paired studies were excluded from both the RSS and endoleak analyses for a total sample size of 257. The RSS analysis was comprised of 255 paired studies (consisting of 420 measurements pairs) as 2 additional paired studies were excluded. The endoleak analysis was comprised of 230 paired studies as 27 additional paired studies were excluded.
Patency Analysis
Of the 257 remaining pairs, an additional 13 (5%) were excluded only from the patency analysis. In 2 of these studies (1%), the US report was equivocal, and in the remaining 11 studies (4%), the CT was either performed without contrast or the CT report was equivocal. For CT reports that commented on the “successful exclusion of aneurysm” or “graft without complications,” the studies were coded as patent grafts. CT reports that described various degrees of narrowing without full thrombosis were also considered patent. The patency analysis included 244 studies. The numbers of true positives, true negatives, false positives, and false negatives were determined from the data.
Endoleak Analysis
Of the 257 remaining pairs, an additional 27 (11%) were excluded only from the endoleak analysis. In 7 of these studies (3%), the US report was equivocal, and in the remaining 20 studies (8%), the CT was either performed without contrast or the CT report was equivocal. The endoleak analysis thus included 230 studies. For US or CT reports that commented “suggestive of endoleak” or “suspicious for endoleak,” the studies were coded as positive for endoleak. The numbers of true positives, true negatives, false positives, and false negatives were determined from the data.
Endoleak Type Analysis
For the studies with an endoleak in which the type of endoleak was reported, the true positives were analyzed to determine agreement, and the false positives and negatives were reviewed for discrepancies. The US and CT reports classified endoleaks as either type I (incomplete proximal or distal seal), type II (collateral vessels), type III (graft modular defect), type IV (graft porosity), or type V (endotension).6,13,18 Twenty-eight of the 61 true positives (46%) were included in the endoleak type analysis and 33 were excluded (54%). For those excluded, the reports did not mention the type of endoleak: 12 cases for US, 12 cases for CT, and 9 cases for both. Twenty-two of the 36 false positives (61%) were included in the endoleak type analysis and 14 (39%) were excluded as the US did not mention the type of endoleak. Sixteen of the 21 false negatives (76%) were included in the endoleak type analysis and 5 (24%) were excluded as the CT did not mention the type of endoleak.
Residual Sac Size Analysis
Of the 257 remaining pairs, an additional 2 studies (1%) were excluded only from the RSS analysis as the CT results did not mention the RSS. The RSS analysis included 255 studies, and each AP and TRV measurement was analyzed separately for a total of 420 measurement pairs. For CT measurements that were listed without dimensions (AP/TRV), the maximum CT/US measurements were compared and the minimum CT/US measurements were compared. As is consistent with the current literature, US measurements within 5 mm of the reported CT measurements were considered equivalent.1,7,14,19 US measurements outside this limit when compared to the CT measurements were considered discordant.
Statistics
Descriptive statistics were calculated using Microsoft Excel for Mac 2011 Version 14.3.9 (Microsoft Corporation, Redmond, WA) and MedCalc Version 13 at www.medcalc.org (MedCalc Software, Ostend, Belgium).
Results
Analysis of the Prevalence of US Surveillance
The 350 patients reviewed for inclusion in this study had a total of 1196 abdominal US studies that had been ordered and performed from July 2006 to December 2013. Twenty-three percent of patients had one US, 21% had two US studies, 16% had three US studies, 12% had four US studies, and 13% had five US studies. The remaining 15% of the patients had six or more US studies each. The average number of US studies performed per patient was 3.4 with a range of 1 to 17 and a median of 3. The average time between US studies on the same patient was 9.3 months with a range of less than 1 month to 58 months, a median of 8 months, and a mode of 12 months. A total of 298 abdominal CT scans had been performed on this group of patients within six months of an abdominal US.
Patency, Endoleak, and Residual Sac Size Analyses
After the exclusions detailed in the methods section, 156 patients were included in the patency, endoleak, and RSS analyses and 257 paired abdominal US and CT scans were analyzed. The percentage of the patients included in this study who had one paired US and CT scan was 60% while 23% had two, 12% had three, and 3% had four. There were three patients who had more than four paired US and CT scans in this study (one patient had five, one patient had six, and one patient had seven), accounting for 3% of the total patients included in this study. Seventy-one percent of the paired studies were performed within 30 days of each other, 89% were performed within 60 days of each other, and 93% were performed within 90 days of each other (Figure 7). The remaining 7% were performed between 91 and 180 days of each other. Of the 71% paired studies that were performed within the same month, 31% of these were performed within the same week, and 13% were performed the same day. Of the paired studies that were not performed the same day, the average elapsed time between the US and CT was less than one month (0.9 month). Excluding those pairs of studies that were performed the same day, the US studies were done prior to the CT scans in 44% of the pairs and performed after the CT scans in 43% of the pairs.
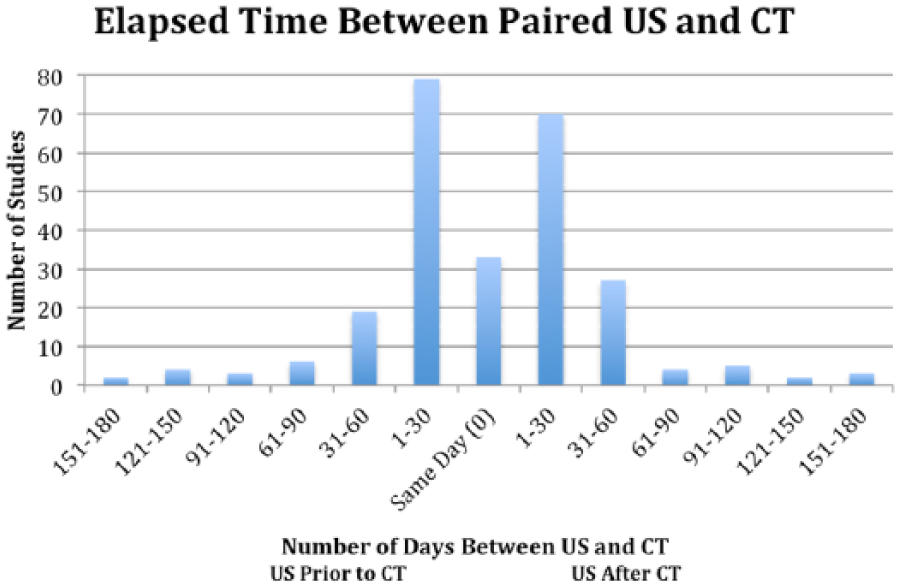
The elapsed time in days between the 257 paired ultrasonographic examinations and computed tomographic scans analyzed in this study. Seventy-one percent of the paired studies were performed within 30 days of each other, 89% were performed within 60 days of each other, and 93% were performed within 90 days of each other. The remaining 7% were performed between 91 and 180 days of each other. Of the 71% paired studies that were performed within the same month, 31% of these were performed within the same week, and 13% were performed the same day.
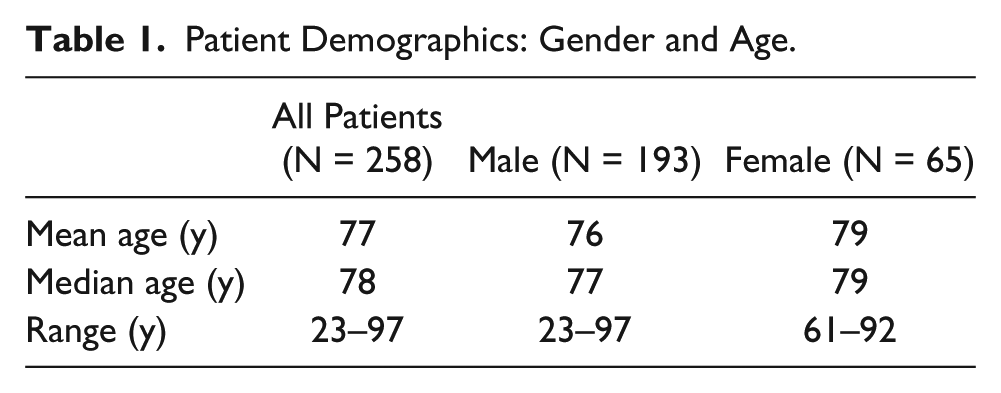
Of the studies analyzed, 75% were on males and 25% were on females (Table 1). The average age of the patients at the time of the US was 77 years with a range of 23 to 97 years and a median of 78 years. Among the females included in this study, the average age of the patients at the time of the US was 79 years with a range of 61 to 92 years and a median of 79 years. Among the males included in this study, the average age of the patients at the time of the US was 76 years with a range of 23 to 97 years and a median of 77 years. Eleven different RVTs performed the US studies that were included in this review. Five RVTs performed 82% of the US studies reviewed while the six additional RVTs each performed a very small percentage of the remainder of the US studies. The vast majority of the US studies (87%) were performed while the vascular laboratory was accredited in visceral vascular testing by the Intersocietal Accreditation Commission (IAC)–Vascular Testing (formerly known as the Intersocietal Commission for the Accreditation of Vascular Laboratories [ICAVL]). Because of a reorganization of the medical practice during the data acquisition period, the IAC accreditation was lapsed for approximately eight months from the end of 2012 into the first half of 2013, though all technologists remained registered and the examination protocols did not change.
Patient Demographics: Gender and Age.
Patency Analysis
The 244 studies analyzed and compared for patency all matched and were true negatives (100%). There were no US or CT cases in which the aortic SG was thrombosed (not patent); therefore, there were no true positives, false positives, or false negatives. The specificity and the negative predictive value (NPV) for the patency analysis are both 100%. The prevalence of SG thrombosis in this study was 0%. The sensitivity and positive predictive value (PPV) could not be calculated as there were no true positive cases.
Endoleak Analysis
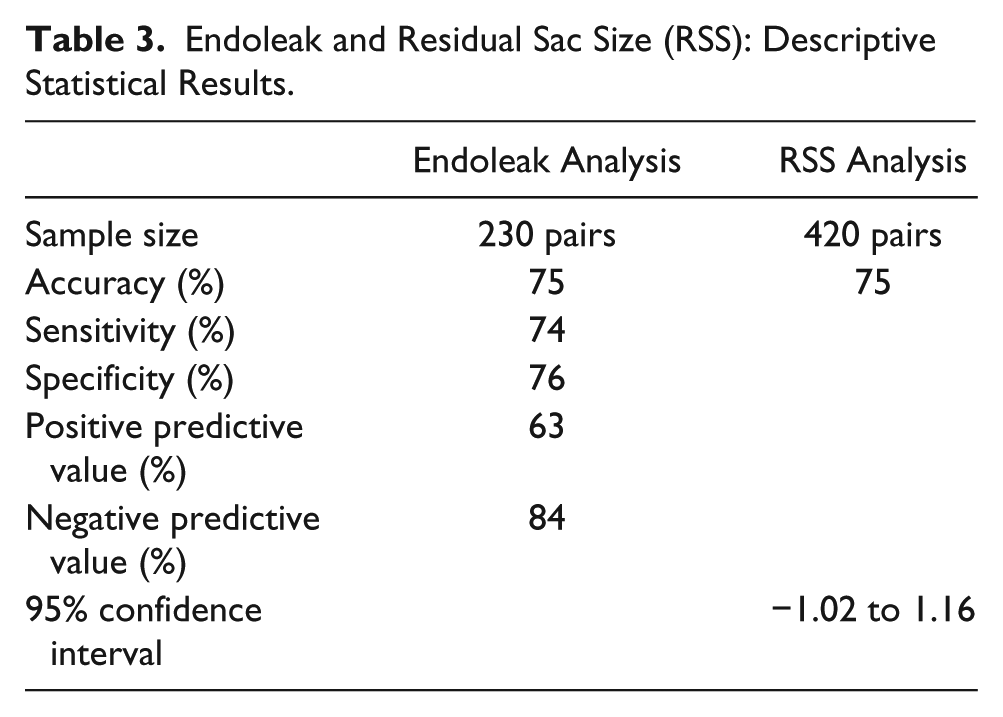
Of the 230 studies analyzed and compared for endoleak, 173 studies matched and 57 studies did not match. There were 61 true positives (26%), 112 true negatives (49%), 36 false positives (16%), and 21 false negatives (9%) (Figure 8 and Table 2). The prevalence of endoleak in this study was 36%. The sensitivity, specificity, PPV, and NPV for the endoleak analysis were 74%, 76%, 63%, and 84%, respectively (Table 3).
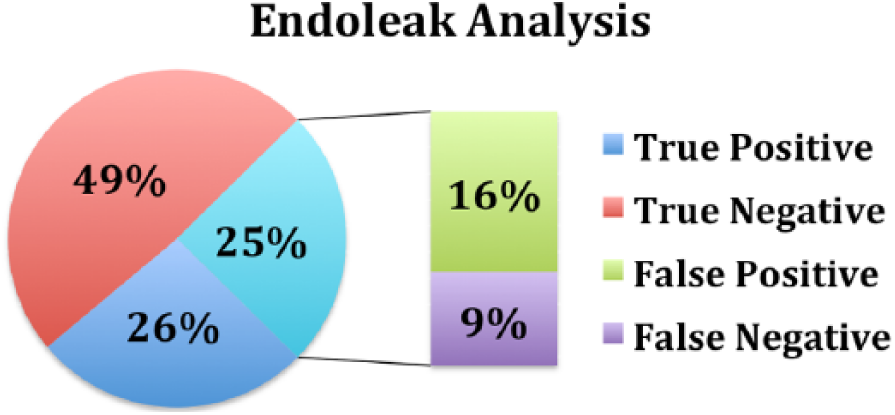
Percentage of the 230 paired studies that were endoleak true positives, true negatives, false positives, and false negatives when comparing ultrasonography with computed tomography. There were 61 true positives (26%), 112 true negatives (49%), 36 false positives (16%), and 21 false negatives (9%).
Endoleak Analysis (230 studies).
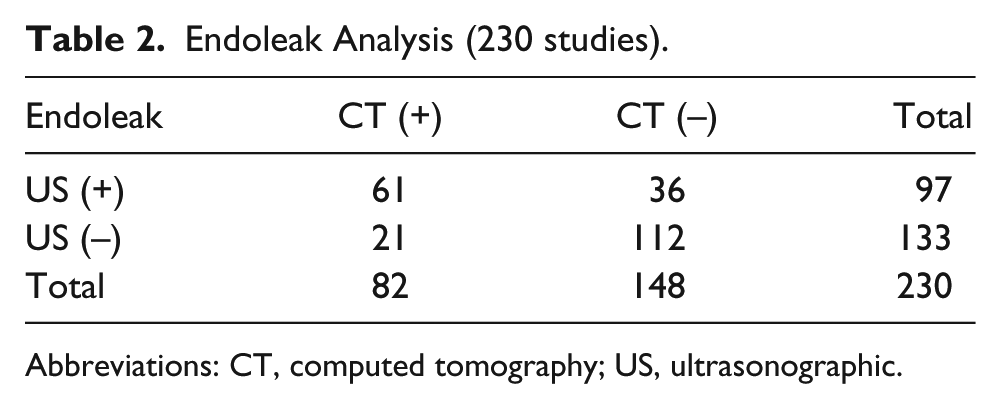
Abbreviations: CT, computed tomography; US, ultrasonographic.
Endoleak and Residual Sac Size (RSS): Descriptive Statistical Results.
Endoleak Type Analysis
Of the 28 true positive cases included in the endoleak type analysis, 26 (93%) matched and 2 (7%) did not match. The number of matches by endoleak type were as follows: type I, 2; type II, 20; type I and II, 1; type III, 1; type IV/V, 1; and aortocaval fistula/endoleak, 1. In 1 case the US reported both a type I and II endoleak while the CT reported a type II endoleak. This was still considered a match as both the US and CT reported a type II endoleak. The 2 discordant cases were as follows: (1) US reported a type II endoleak while CT reported a type I endoleak and (2) US reported a type III endoleak while CT reported a type II endoleak. For the 22 false positive cases that were included in the endoleak type analysis, US reported 19 type II endoleaks and 3 type I endoleaks. For the 16 false negative cases that were included in the endoleak type analysis, CT reported 2 type I endoleaks, 13 type II endoleaks, and 1 type III endoleak.
Residual Sac Size Analysis
Of the 420 measurements analyzed and compared, 314 measurements matched (47 as an exact match) and 106 measurements did not match (Figure 9 and Table 3). The average difference of all the US measurements combined was 0.07 cm (less than 1 mm) from the CT measurement with an accuracy of 75% (95% CI, −1.02 to 1.16). Of the measurements that were discordant, 41 US measurements were too small (39%) and 65 US measurements were too large (61%). The majority of these discordant measurements, however, were within 1 cm of the CT measurement (77%), with a median of 0.8 cm and mode of 0.6 cm.
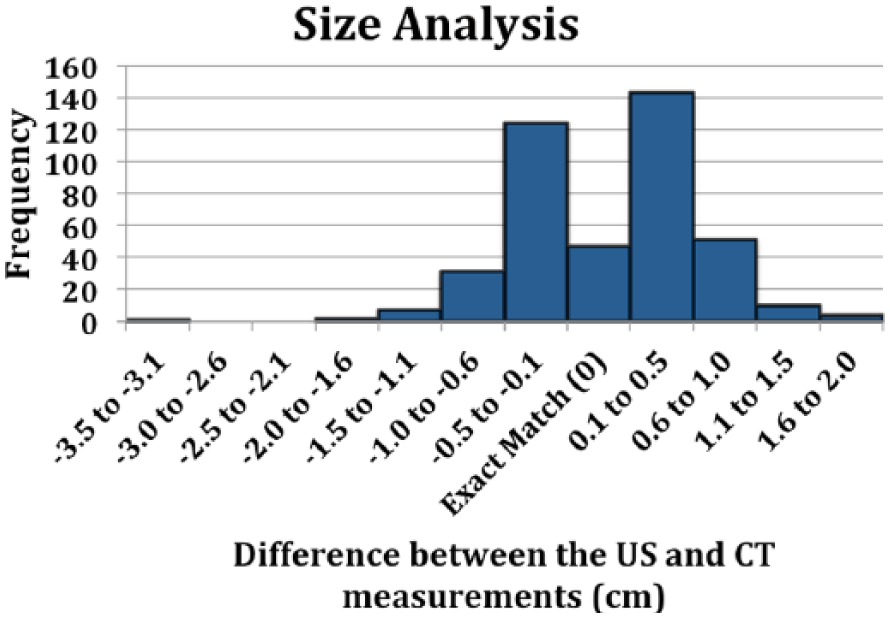
Difference in cm between the ultrasonographic (US) and computed tomographic (CT) residual sac size measurements. The CT measurements were considered the standard. US measurements within 0.5 cm when compared to the CT measurements were considered equivalent. A total of 420 measurement pairs were analyzed and compared. The number of measurements that matched was 314; 47 were an exact match. The number of measurements that did not match was 106. Accuracy was 75% (95% CI, −1.02 to 1.16).
Discussion
A 2012 study by Gray et al. 7 and a 2013 study by Patel el al. 15 have both stated that EVAR surveillance is still preferably performed by CT and any deviation from this practice will require careful analysis and ongoing correlation. If US is to be used as a first-line surveillance modality, it must be able to accurately detect SG patency and clinically significant endoleaks, and it should precisely measure the RSS. It is imperative to detect any clinically significant complications early so that potential risks can be mitigated with prompt treatment. This study evaluated current outcomes of US surveillance after EVAR in a dedicated vascular laboratory with multiple RVTs to further assess if US can be reliably used as a first-line surveillance modality.
Eleven different experienced RVTs performed the US studies included in this review. This is unique as the majority of other studies have included results of studies performed by only one, or at best a very few, operators.1,7,9,11,16 Only four published articles were found that analyzed US studies performed by multiple operators.3,8,20,21 It is widely accepted in the literature that US is particularly dependent on the operator.1,7,9,11,12 The US studies included in this review were performed by credentialed sonographers who had extensive knowledge and experience in US surveillance after EVAR. Although a greater amount of variability was potentially introduced by including studies performed by multiple RVTs, our results are comparable to those in the current literature. Furthermore, the research is widely applicable to the majority of vascular laboratories that employ multiple experienced RVTs.
Prevalence of US Surveillance
For the patient population that was reviewed in this study, abdominal US was ordered and performed much more frequently than abdominal CT with a ratio of 4:1. By far, the limiting factor in the patency, endoleak, and RSS analyses in this study was the number of abdominal CT scans ordered within six months of an US.
Patency Analysis
The 244 studies analyzed and compared for patency all matched and were true negatives. The specificity and NPV for the patency analysis are both 100%; however, the NPV should be interpreted with caution as the prevalence of aortic SG thrombosis in this study was 0%, and this may not accurately reflect the actual prevalence of aortic SG thrombosis.
Endoleak Analysis
In the endoleak analysis, seven of the false negative cases were noted to have a decrease in RSS on US and/or CT when compared to adjacent studies with an average decrease of 1.0 cm (range, 0.2–2.6 cm). Five of these seven were noted to have a decrease in RSS of at least 0.5 cm on an adjacent US and/or CT. The implications of a decreasing RSS were pointed out in a 2013 study by Nyheim et al., 1 who noted that this is a primary measure for favorable treatment and denotes a decreased risk of postsurgical rupture. Therefore, in at least five of these seven cases in which the RSS decreased at least 0.5 cm when compared to an adjacent study, the endoleaks could be considered clinically insignificant. Another false negative case underwent peer review three days later by both a radiologist and a vascular surgeon, and it was determined that there was no endoleak on the CT. There was no revision to the initial CT report, however, so this was included in our data as a false negative, though in reality it more likely represents a true negative. In only three false negative cases was an increase in size noted on the adjacent US and/or CT. For these three cases, the RSS increased by an average of 0.4 cm (range, 0.1–1.2 cm).
A second important finding for US was that five false positive cases were noted to have an endoleak on subsequent CT scans. For these five cases, the CT demonstrating the endoleak was performed, on average, nine months after the US that demonstrated the endoleak, with a range of 2 months to 19 months and a median of 6 months. If these five cases are included as true positives rather than false positives in the endoleak analysis, the sensitivity, specificity, PPV, and NPV become 80%, 76%, 65%, and 88%, respectively. There is an increase in the sensitivity, PPV, and NPV with no change in the specificity. Interestingly, in two of these false positive cases for which an endoleak was later demonstrated on CT, the RSS was noted to have decreased. Seven additional false positive cases were noted to have decreased in RSS on an adjacent US and/or CT without a subsequent demonstration of endoleak on CT. Stable and/or decreasing RSS, even in the presence of an endoleak, has been well documented in the literature. Nagayama et al. 17 and Nelms et al. 12 have both noted that small or minimal endoleaks may not require any subsequent repairs and that many aneurysms even with a small endoleak present will continue to decrease in size after EVAR.
An additional eight false positive cases demonstrated an increase in RSS on an adjacent US and/or CT. Such an increase in size certainly implies flow into the residual sac and a possibility of rupture. 22 For these eight cases, the RSS increased by an average of 0.8 cm (range, 0.1–1.9 cm). Six of these eight cases were noted to have an increase of at least 0.5 cm on an adjacent US and/or CT. When an increase of size of at least 0.5 cm is noted when compared to an adjacent US and/or CT, the issue is raised as to whether the increase is due to an endoleak that is not being detected by the CT or due to endotension. Endotension has been defined in the literature as an expansion of the aneurysm sac without an identifiable endoleak. 12 Recent studies propose that endotension may simply represent an overlooked endoleak. 12 In fact, endotension is now classified as a type V endoleak by many surgeons, physicians, and authors.6,13,18 If the six cases in which the residual sac increased by at least 0.5 cm on an adjacent test are included as true positives rather than false negatives (in addition to the five cases that were subsequently diagnosed with an endoleak), the sensitivity, specificity, PPV, and NPV become 88%, 76%, 67%, and 92%, respectively. There is an increase in the sensitivity, PPV, and NPV with no change in the specificity.
A 2010 study by Bakken et al. 10 noted that color duplex ultrasonography detects a substantial amount of endoleaks, however its accuracy is probably understated when it is compared to CT as the standard. A similar study done in 2005 by Nelms et al. 12 showed that CT and/or angiography did not find endoleak in 1/2 of the patients positive by color duplex ultrasonography for endoleak with concomitant RSS increase. Likewise, a 2009 study by Manning et al. 19 reported eight possible false negative results from CTA. Furthermore, it has been noted in the literature that magnetic resonance angiography has a much higher sensitivity than CT in the detection of endoleaks. 19 Yet the majority of studies evaluating postaortic SG repair analyses are still using CT as the gold standard to which to compare the US results.1,3,7–9,11,16–21,23 This practice is supported by studies such as those by Patel et al. 15 and Tsolaki et al. 16 that stated that CT remains the standard for endoleak detection and that the value of US in endoleak detection is disputable. In the study reported here, five cases positive for endoleak by US were subsequently noted to have an endoleak, and an additional six cases positive for endoleak by US were noted to have an increase in RSS of at least 0.5 cm. This raises the question of whether the CT scans in these cases are false negatives, and it prompts further discussion of whether US in the hands of a skilled and credentialed sonographer is actually more sensitive at detecting endoleaks than CT. This is supported by a 2000 study by Carter et al. 24 that noted that particularly if the endoleak is a type II, conventional timing for CT or angiographic studies would not display the contrast leaking into the AAA sac during image capture. Two similar reports in 2009, one by Beemer et al. 21 and another by Schmieder et al., 3 found that US was as good as, if not better, at detecting endoleak than CT and that US was the test of choice to determine when an endoleak repair was needed. The question remains whether CT results constitute a suitable gold standard for the detection of endoleaks.
A review of the current literature shows a mix of findings. Nyheim et al. 1 prospectively reviewed 56 patients and noted 85% sensitivity and 91% specificity with an endoleak prevalence of 24%. Nerlekar et al. 9 prospectively reviewed 121 patients and noted 93% sensitivity, 99% specificity, 91% PPV, and 99% NPV with an endoleak prevalence of 12%. Gray et al. 7 prospectively reviewed 145 patients and noted 100% sensitivity, 85% specificity, 28% PPV, and 100% NPV with an endoleak prevalence of 10%. Oikonomou et al. 8 prospectively reviewed 90 patients and demonstrated 75% sensitivity, 95% specificity, 86 PPV%, and 92 NPV% with an endoleak prevalence of 27%. Gurtler et al. 11 retrospectively analyzed 132 patients and noted 97% sensitivity and 93% specificity with an endoleak prevalence of 56%. A recent meta-analysis, however, demonstrated an aggregate sensitivity of only 77%. 15 A second meta-analysis reported a sensitivity of 91% and a specificity of 69%. 1 The majority of the aforementioned studies are prospective studies, while our study is retrospective. Furthermore, the number of patients and paired scans in our study varies from those noted previously (156 patients with 230 paired scans were included in our study).
The prevalence of endoleak in our study was 36%, and the sensitivity, specificity, PPV, and NPV for the endoleak analysis were 74%, 76%, 63%, and 84%, respectively. Our prevalence of endoleak of 36% is within the range of what is noted in the current literature (average, 26%; range 10%–56%). Our sensitivity of 74% is just below the range of the individual studies noted previously (range, 75%–100%); however, it is well within the range of the results of the meta-analyses (average, 78%; range, 66%–91%).1,8,15 Our PPV of 63% is within the range of 28% to 91% noted in the current literature. PPV will typically increase with an increase in disease prevalence. Our disease prevalence of 36% is quite a bit higher than those quoted in the literature previously that provided PPVs (average, 16%; range, 10%–27%). Our specificity of 76% is within the range of 69% to 99% noted in the current literature. Our NPV of 84% is slightly lower than the range of 90% to 100% noted in the current literature. The NPV will typically decrease with an increase in disease prevalence. When compared to the average prevalence of 16% (range, 10%–27%) provided in the literature that calculated NPVs, our disease prevalence of 36% is quite a bit higher. If we include the 11 US studies that were positive for endoleak for which an endoleak was subsequently discovered and/or there was an RSS increase of at least 0.5 cm as true positives rather than false negatives, our sensitivity, specificity, PPV, and NPV become 88%, 76%, 67%, and 92%, respectively, and these are all well within the ranges quoted in the current literature.
Endoleak Type Analysis
For the true positives included in this analysis, there was a 93% agreement for the endoleak type between the US and CT. Type II endoleaks were the most common match by far (77%); however, there were matches for types I, III, and IV/V endoleaks. Furthermore, there was a match for both a type I and type II endoleak in the same patient and for an aortocaval fistula/endoleak in another patient. For the 22 false positive cases that were included in the endoleak type analysis, US reported 19 type II endoleaks (86%) and 3 type I endoleaks (14%). In one false positive case, US reported a type I endoleak that was not reported on the paired CT but was subsequently reported on a CT six months later. Therefore, it truly seems that the US was more sensitive and timely at detecting this type I endoleak than the CT. Two additional false positive cases that US reported as type II endoleaks were noted to have endoleaks on subsequent CT scans. Three other false positive cases that US reported as type II endoleaks were noted to have an RSS increase of at least 0.5 cm when compared to an adjacent study. As noted in the aforementioned endoleak analysis, these instances raise the question of whether the CT scans in these cases are false negatives, and it prompts further discussion of whether US in the hands of a skilled and credentialed sonographer is actually more sensitive at detecting endoleaks than CT. For the 16 false negative cases that were included in the endoleak type analysis, CT reported two type I endoleaks (13%), 13 type II endoleaks (81%), and one type III endoleak (6%). In one false negative case, the CT that reported a type I endoleak was performed five months after the US that reported no endoleak and there is a high likelihood that the type I endoleak may have developed during this time period. Five false negative cases that CT reported as type II endoleaks were noted to have a decrease in RSS when compared to adjacent studies, three of these were noted to have a decrease of at least 0.5 cm, and there may have been false positive CT scans in this group. A type III endoleak was reported by CT in another false negative case; however, this underwent peer review three days later by both a radiologist and vascular surgeon, and it was determined that there was no endoleak on the CT. Since there was no revision to the initial CT report, this was included in our data as a false negative though it more likely is a true negative.
Residual Sac Size Analysis
For the RSS analysis, AP and TRV measurements, although performed at the same time on the same patient, are two distinct measurements, and for that reason, they were independently analyzed. The average difference of all the US measurements combined is 0.07 cm (less than 1 mm) from the CT measurement with an accuracy of 75% (95% CI, −1.02 to 1.16). Therefore, it can be predicted with 95% confidence that the US measurements will be within −1.0 cm to 1.2 cm of the CT measurements. Of the measurements that were discordant, 41 US measurements were too small (39%) and 65 were too large (61%). The majority of these discordant measurements, however, were within 1 cm of the CT measurement (77%), with a median of 0.8 cm and mode of 0.6 cm.
Gray et al. 7 prospectively reviewed 142 US and CT pairs for RSS and noted a 95% CI of −0.87 to 0.75. Nyheim et al. 1 prospectively reviewed 56 patients for RSS and demonstrated a 95% CI of −0.3 to 0.7; however, with US they noticed a consistent 1 mm over-estimation of the RSS size. Conversely, Nerlekar et al. 9 noted that US measurements were consistently less than CT for both AP and transverse measurements. The aforementioned studies are prospective studies with the US testing in each study performed by only one operator. By contrast, our study is retrospective with the US testing performed by multiple operators. Furthermore, the number of patients and paired measurements in our study was larger than those noted previously (156 patients, 255 paired studies, and 420 paired measurements were included in our study). Our 95% CI (−1.02 to 1.16) is slightly larger than those noted previously as well; however, our sample consists of more paired measurements and includes US studies performed by 11 different RVTs. Compared to the literature noted previously, the US measurements in our study demonstrate a more even distribution around the CT measurements as 39% were smaller and 61% were larger.
Assumptions
For the data analysis in this study, it was assumed that the CT results were the gold standard and the surrogate for truth, as is consistent with the current literature.1,3,7–9,11,16–21,23 Our results along with others in the literature, however, cast some doubt on whether this is an appropriate assumption. Each US/CT pair in this study was analyzed independently, although in some cases multiple pairs came from the same patient. We considered each encounter separately, as endoleaks have been known to spontaneously appear and disappear and the RSS is known to vary over time.13,15,24 AP and TRV measurements, although performed at the same time on the same patient, are two distinct measurements, and for that reason they were independently analyzed. The reporting structure for both CT and US varied among the different readers. For the patency analysis, it was assumed that CT reports that commented on the successful exclusion of aneurysm or graft without complications indicated a patent SG. Furthermore, CT reports that described various degrees of narrowing without full thrombosis were considered patent. For the endoleak analysis, it was assumed that US or CT reports that commented suggestive of endoleak or suspicious for endoleak were positive for endoleak. The assumption in the RSS analysis was that when dimensions were not provided on the CT the maximum CT/US measurements were compared and the minimum CT/US measurements were compared. As this was a retrospective study and the wording of each US and CT report differs slightly, we felt that these assumptions were appropriate. We recommend standardizing reporting templates for both CT and US for improved consistency and clarity.
Limitations
One of the limitations of this study is that a retrospective review of reports was performed. The actual US and CT images were not reviewed to determine consistency with the written report. Furthermore, US and CT scans that were performed within six months of each other were included in this study. Of the paired studies that were not performed the same day, the average elapsed time between the US and CT was less than one month (0.9 month). Nonetheless, small endoleaks have been known to spontaneously appear and disappear, and this may have occurred during the time difference between the two studies.13,15,24 This study included a variety of different abdominal aortic EVAR devices, though the data regarding the number and frequency of specific EVAR devices was not analyzed. For the prevalence analysis, the limitation was that the database was searched only for abdominal CT scans that had been done within six months of an US. The data reviewed for this study spans from July 2006 to December 2013, and the vascular laboratory was accredited by ICAVL/IAC for the majority of this time; however, the IAC accreditation had lapsed for approximately eight months during this period due to company reorganization.
This study did not employ the use of contrast-enhanced duplex US (CEUS). CEUS has been a more recent addition to surveillance regimens after endovascular repair that has shown high sensitivity and specificity in the detection of endoleaks.11,13,15,16,18 However, a 2012 study by Nagayama et al. 17 commented that a cautious approach to the use of CEUS should be taken because of variability in the findings in the literature.
Conclusion
If ultrasound is to be used as a first-line surveillance modality, it should accurately detect SG patency and clinically significant endoleaks and precisely measure the RSS. This is imperative so that complications can be detected early and potential risks can be mitigated with prompt treatment. A greater amount of variability in the present study was potentially introduced by including studies performed by multiple RVTs; however, our endoleak and RSS results are comparable to those noted in the current literature. More important, our endoleak analysis revealed 11 CT scans that were likely false negatives and at least 1 CT scan that was a false positive. It has been proposed in recent literature that first-line EVAR surveillance be performed with the concurrent use of clinical symptoms and US.10,30 Current literature supports the use of CT in patients for whom the US is limited by body habitus and/or excessive bowel gas and in patients who have specific US findings such as increased RSS and/or endoleak.1,7,9,11,16
Eleven different experienced RVTs performed the US studies included in this review. This is unique as the majority of other studies have included results of studies performed by only one operator and it is widely accepted in the literature that US is particularly dependent on the operator.1,7,9,11,12,16 The US studies included in this review were performed by credentialed sonographers who had extensive knowledge and experience in US surveillance after EVAR. Our results demonstrated a 93% agreement for the endoleak type between the US and CT for the true positives included in the analysis, and the average difference of all the US measurements combined was less than 1 mm from the CT measurement.
The data from our patency, endoleak, and RSS analyses support the use of US along with clinical symptoms as a reasonable first-line surveillance program after EVAR, and the research is widely applicable to the majority of vascular labs that employ multiple experienced RVTs. Additionally, these data along with others in the literature cast doubt on whether the CT results remain a suitable gold standard for the detection of endoleaks. We agree with the current literature that CT be used to evaluate patients for whom the US is limited by body habitus and/or excessive bowel gas and for patients who have specific US findings such as increased RSS and/or endoleak. We recommend standardizing reporting templates for both CT and US for improved consistency and clarity. The adaptation of increased US surveillance would decrease the number of CT scans, thereby reducing cost and radiation/contrast exposure for patients.
Footnotes
Acknowledgements
The authors wish to thank Ilene Staff, PhD, Senior Scientist in Research Administration at Hartford Hospital, for her assistance in planning the statistical design of this study.
Declaration of Conflicting Interests
The authors declared no potential conflicts of interest with respect to the research, authorship, and/or publication of this article.
Funding
This research was supported in part by a grant from the Sonography Research Institute of the Society of Diagnostic Medical Sonography Foundation.