
Abstract
Conventional multi-material multi-layer flexible packaging offers excellent properties. However, it has recycling challenges, necessitating a shift to mono-material multi-layer flexible packaging for example all-polyethylene (PE) packaging which can be tailored through various synthesis and processing methods for different layers. In this work, we study how the key molecular properties (number-average molecular weight (Mn), weight-average molecular weight (M w ), molecular weight distribution (MWD), comonomer content (short chain branching)) and machine direction orientation (MDO) process draw ratio (MDX) influence the final morphology and mechanical properties of MDO-PE films which are intended as the outer layer of mono-material all-polyethylene multi-layer flexible packaging. Five PE grades and various blends were extruded and blown into films. Selected blown films were machine direction oriented to obtain the final MDO-PE films. Furthermore, one selected PE blown film was processed at different MDO process draw ratios while keeping other process parameters constant. From the molecular properties point of view, the higher molecular weight fractions provide a higher possibility for uniform stretching whereas lower molecular weight fractions provide a higher natural draw ratio and therefore higher modulus and stiffness enhancement. Further, the results show that increasing MDO process draw ratio leads to more fibrillation and increased crystallinity. Consequently, the tensile modulus and stiffness at the higher draw ratios increase as well and are comparable to conventionally used polymers in outer layers of multilayer flexible packaging. Thus, this work demonstrates that MDO-PE films with enhanced modulus can provide sufficient stiffness for the design of outer layer of mono-material multi-layer all-PE packaging which presents higher potential for mechanical recyclability.
Keywords
Introduction
Multi-material multi-layer flexible packaging materials find many applications in food and pharmaceutical industries due to their exceptional tensile and barrier properties along with better user convenience because they are light weight and portable. However, it is challenging to recycle multi-material multi-layer packaging after its use, as the packages contain multiple materials, which need to be separated before mechanical recycling.1–4 Thus, from the sustainability point of view, there is a shift to mono-material multi-layer flexible packaging as it has the potential to combine functionality with efficient mechanical recycling. Polyethylene (PE) can be a material of choice for this application as its material properties can vary depending on the synthesis (low-density polyethylene (LDPE), linear low-density polyethylene (LLDPE), and high-density polyethylene (HDPE)), processing, and post-processing conditions, with the potential to satisfy combined application requirements. The PE recycling stream can utilize the store drop-off collection systems that were initially established for grocery shopping bags. 5
Polymers such as polyethylene, polypropylene (PP), polyethylene terephthalate (PET) and polystyrene (PS) are used to produce flexible packaging films.
6
Conventionally, the outer layer of multi-material multi-layer flexible packaging is made from non-PE materials such as PET and polyamide (PA) which provides adequate stiffness and barrier properties to the overall package. Orienting polymer films in the semi-solid state using processes like tenter frame, double bubble, and machine direction orientation enhances both barrier and mechanical properties, providing a pathway for developing lightweight packaging structures
7
and moving away from multi-material multilayer flexible packaging. The PE film stiffness can be enhanced significantly by the machine direction orientation (MDO) process (Figure 1). MDO process.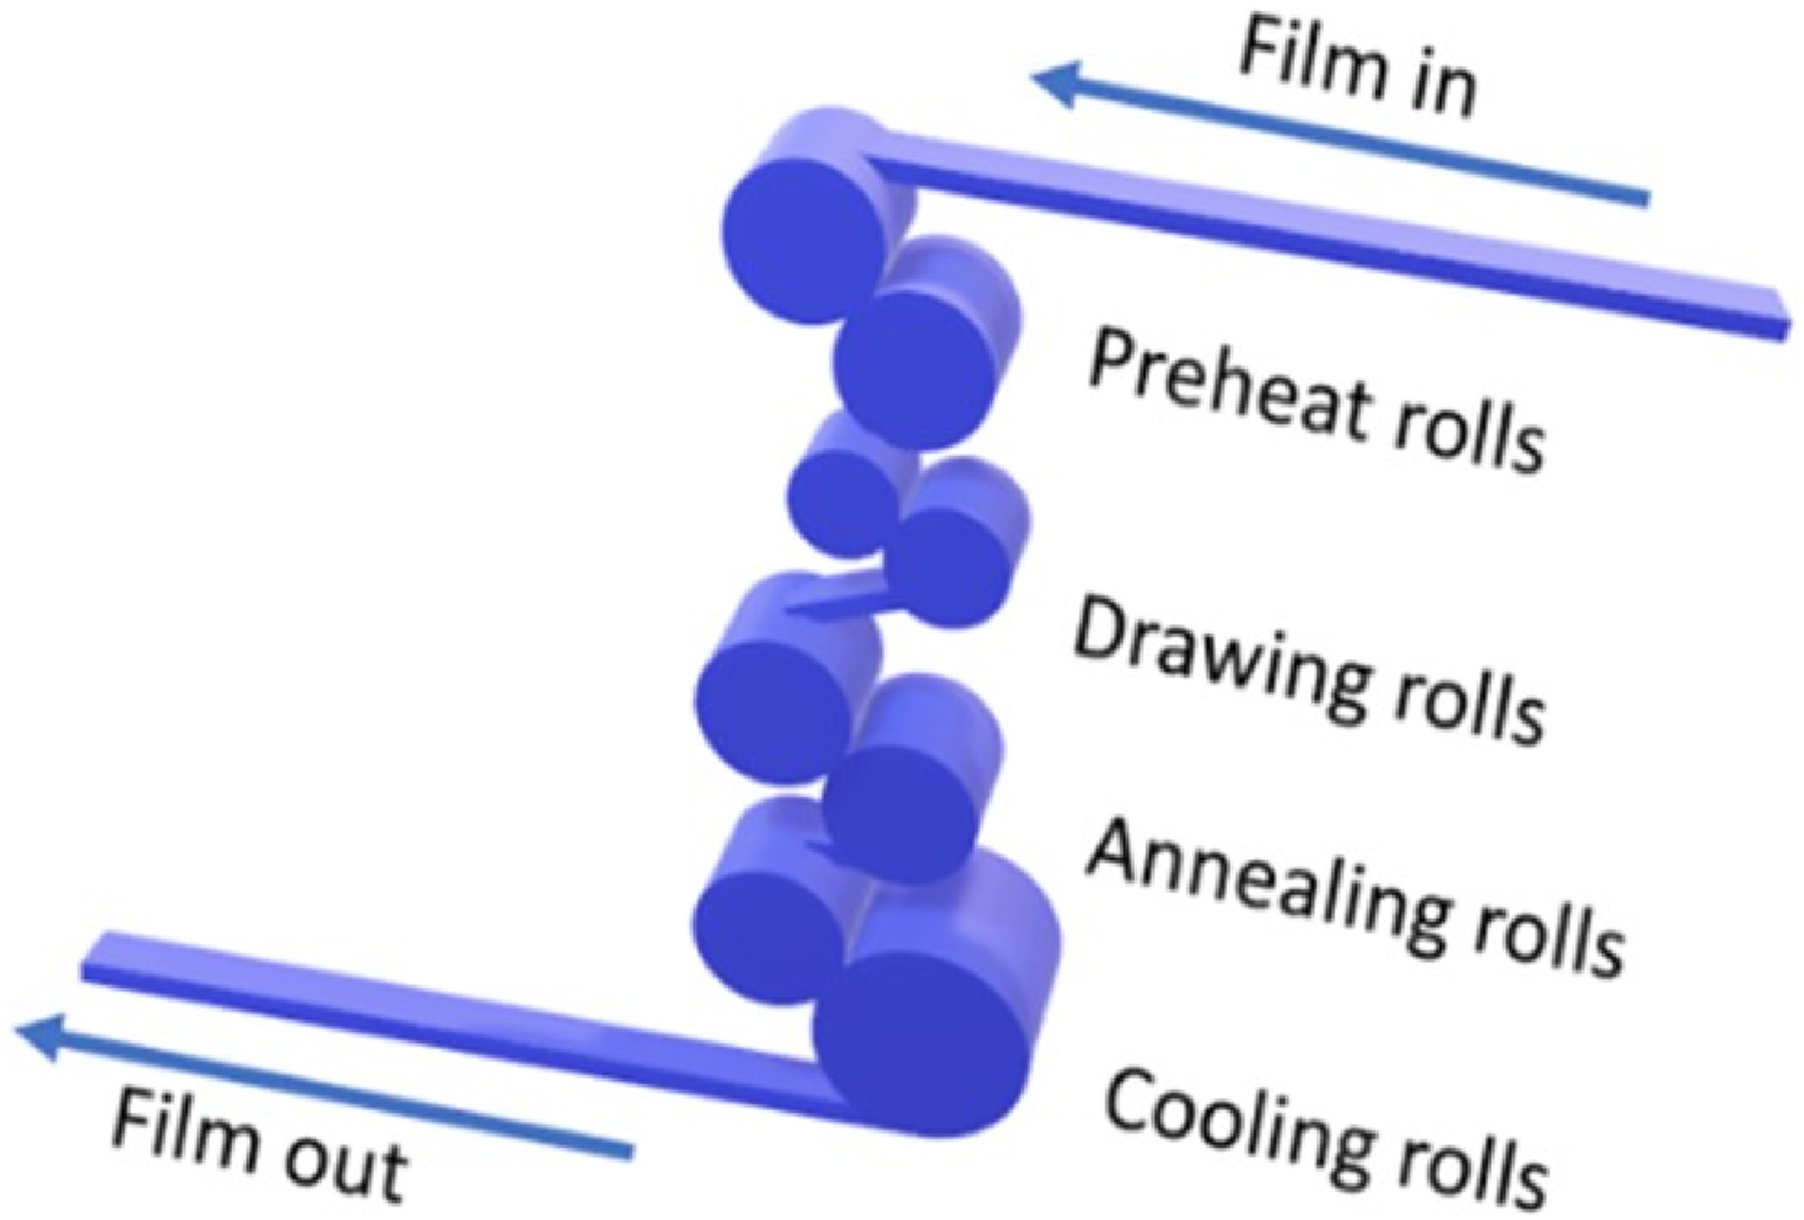
During the MDO process, the polymer film is stretched in the machine direction at a certain temperature which depends on the polymer’s chemical nature. Consequently, numerous enhancements are observed in the film physical and barrier properties for food packaging applications, including stiffness, tensile strength, gloss, oxygen barrier and moisture barrier.8–10 Although MDO technology has existed since the 1950s, its commercialization was delayed for many years due to process subtleties that were not immediately understood. 11 At present, large-scale oriented plastic film production is commonplace in the industry.
MD orientation can increase PE film Young’s modulus increasing its stiffness which is an important property for printing, lamination and ability to run efficiently on packaging machine lines. Low-stiffness films might sag while running on packaging lines, compromising the packaging process. The appropriate multilayer packaging structure overall stiffness is also required for special consumer-appealing package designs such as a stand-up pouch. 12 Thus, the MDO process provides an opportunity to incorporate MDO-PE film as an outer layer when designing mono-material multi-layer all-polyethylene flexible packaging.
Factors governing the ultimate modulus improvement during MDO operation include the PE molecular properties like molecular weight, molecular weight distribution, short-chain branching (SCB) and its distribution.
Many previous researchers have highlighted how comonomer content and SCB distribution influence the crystal morphology and further macro-physical properties of polyolefins. Krishnaswamy et al. 13 explored how SCB distribution influences HDPE crystal morphology and mechanical properties. They found that blends containing SCB primarily on the high-molecular-weight segments have better ultimate mechanical properties such as stress at break and therefore higher resistance against slow crack growth. This improved mechanical performance is linked to an increased tie chains resulting from the longer chains with SCB. Fall et al. 14 investigated the role of SCB in crystalline model PE’s and reported that the crystalline morphology depends strongly on how many branches are on the linear backbone. In particular, the lamella thickness decreases with increasing SCB content.
Li et al. 15 investigated how comonomer content affects the propylene-1-octene copolymer structure-property relationship during uniaxial stretching at 60°C. They reported that PP-Octene copolymers with lower octene content presented higher crystallinity and larger crystal sizes, which undergo lamellar fragmentation during stretching. Initially, this decreased crystallinity, but at high strains, the crystallinity increased due to strain-induced crystallization, resulting in higher lamellar orientation. Conversely, high octene copolymers demonstrated smaller initial crystal sizes and elastomeric behaviour.
Previous studies have demonstrated that for semi-crystalline polymers, comonomer content and SCB distribution significantly influence initial crystalline morphology before uniaxial stretching which further impacts the lamellar fragmentation process during uniaxial stretching, thereby playing a pivotal role in designing the resin architecture to attain specific modulus and stiffness characteristics.
Melt-processed ultra-high molecular weight polyethylene and polyethylene waxes (with molecular weight below 1 kg/mol) blends have been extruded and drawn in the solid-state, representing an application of the bimodal molecular weight distribution strategy to achieve the necessary melt viscosity for high-molecular-weight resins.16,17 A PE with broad molecular weight distribution to target processability and strength properties can be accomplished using cascaded reactor systems, mixed catalyst systems and melt blending.18–20
A polymer’s molecular properties play a significant role in the MDO process and mostly determine the improved tensile properties after drawing. A few studies have discussed how the molecular weight and process draw ratio affects the oriented PE drawing behaviour and tensile properties. Jarecki et al. studied ultra-high modulus polyethylene and found that the high-molecular-weight fraction in ultra-high modulus polyethylene imparts the high modulus, while the low-molecular-weight fraction facilitates chain alignment and suppresses internal voiding during drawing at elevated temperatures.21,22
Most semi-crystalline polymer solids typically exhibit shear-yielding behaviour upon tensile load application implying that the specimen will neck after yield point. On micro-scale level it is accompanied by a significant change in the semi-crystalline structure from spherulitic to fibrillar. 23 Numerous prior investigators23–28 have examined semi-crystalline polymer necking behaviour during uniaxial tensile deformation, a phenomenon initially denoted as “cold drawing” by Carothers and Hill in 1932. Capaccio and Ward 29 studied how ultra-high modulus linear PE molecular weight characteristics influence cold drawing behaviour. They observed that a significant improvement in cold draw ratio can be achieved at a specific number-average molecular weight (Mn) by reducing the molecular weight distribution that is, by decreasing weight-average molecular weight (M w ). They also stated that for low-molecular-weight polyethylene (PE) the crystallization rate is significantly faster, leading to higher crystallinity. Conversely, high-molecular-weight PE possesses longer chains that spread across more lamellae, resulting in increased tie-chain concentration. Andrews and Ward 30 studied cold drawing HDPE and reported the natural draw ratio increased as molecular weight decreased. They defined natural draw ratio as the ratio of the cross-sectional areas before and after drawing. Séguéla 31 in his review also mentioned the draw ratio in the stable neck region of semi-crystalline polymers as natural draw ratio. High natural draw ratios result in higher microstructure fibrillation resulting in higher overall crystallinity and highly oriented microstructure towards the stretch direction which further increases the tensile modulus. Furthermore, Young’s modulus increased monotonically with increasing natural draw ratio.
Capaccio et al. 29 and Andrews et al. 30 findings are in agreement with Plemmons’ 32 review where he discussed oriented PE. He stated that for solid-state orientation of high-molecular-weight high-density polyethylene, the entanglement concentration rises to a level that hinders solid-state orientation due to the significant stress accumulation. On the other hand, low-molecular-weight PE lacks efficient stress transmission capability, making it unstable when subjected to drawing processes. This unstable drawing results in localized or non-uniform stretching across the specimen under load, inducing higher natural draw ratio. Hatfield et al. 9 also reported that medium molecular weight HDPE blown films with no long chain branching was not stretchable in the MDO process because of “stretch resonance” which is defined as non-uniform or uneven stretching.
Sherman et al. 33 studied the microstructure of high modulus solid state extruded polyethylene and reported that axial tensile modulus increased almost linearly with an increase in draw ratio. Smith et al. 34 studied the tensile properties of highly oriented PE and inferred that at elevated temperatures and extended loading durations, the tensile properties are anticipated to be more influenced by the remaining trapped entanglements in the oriented polymeric solid, making M w a more dominant factor than M n . Cappacio et al.35,36 studied the drawing behaviour of linear PE and reported that deformation showed significant localization for low M w , resulting in a central draw ratio much larger than the overall strain imposed on the sample. In contrast, high M w PE exhibited homogeneous drawing behaviour. They also suggested that the rate of local deformation in the neck was influenced by the initial crystallization conditions. Consequently, samples drawn from slow-cooled sheets might exhibit a higher draw ratio compared to those prepared by rapid quenching, for the same draw time.
The literature overview presented here well-describes how molecular weight averages and polydispersity (Đ) influence PE drawing, orientation and mechanical properties. However, in most studies, PE with isotropic structure before drawing in the form of compression molded sheets are used as the starting material, which is not always relevant for packaging materials. The recent MDO PE film substitution as an outer layer in mono-material PE multilayer flexible packaging has renewed interest in this field, prompting a desire to better comprehend how resin and process parameters influence achieving desired mechanical properties for flexible packaging applications. Yet, the influence of drawing on the blown film properties with pre-existing biaxial orientation remains unclear.
Blown film extrusion ranks among the foremost polymer processing methodologies, with an annual processing capacity of billions of pounds of polymer, predominantly polyethylene. 37 Hence, integrating the MDO process sequentially with film blowing can enhance the packaging materials characteristics and streamline the shift towards mono-material packaging, thereby positively impacting recyclability and polymer circularity. Consequently, selecting the polyethylene material for the MDO process is crucial.
This study reports on how the molecular properties (average molecular weight, molecular weight distribution (MWD), comonomer content and SCB distribution) and MDO process parameter (stretch draw ratio) influence the final morphology and mechanical properties of MDO-PE films that are intended as the outer layer of multilayer flexible packaging systems. The films were produced via a film-blowing process meaning that a flow-induced orientation already existed in the films prior to drawing. Systematically altering the film molecular properties by blending different PE grades facilitated an examination of how molecular weight impacts the MDO-PE film’s ultimate mechanical properties. It was expected that higher low-molecular-weight proportions in the PE film microstructure would lead to a greater natural draw ratio during stretching and an increased tensile modulus after stretching. Conversely, higher high-molecular-weight proportions were anticipated to promote uniform stretching with less pronounced necking. Additionally, higher process draw ratios were expected to induce more fibrillation and greater microstructure orientation in the machine direction, resulting in an increased natural draw ratio and further enhancing the MDO-PE film tensile modulus.
Materials and methods
The base PE resins used with their melt index (MI) and density.
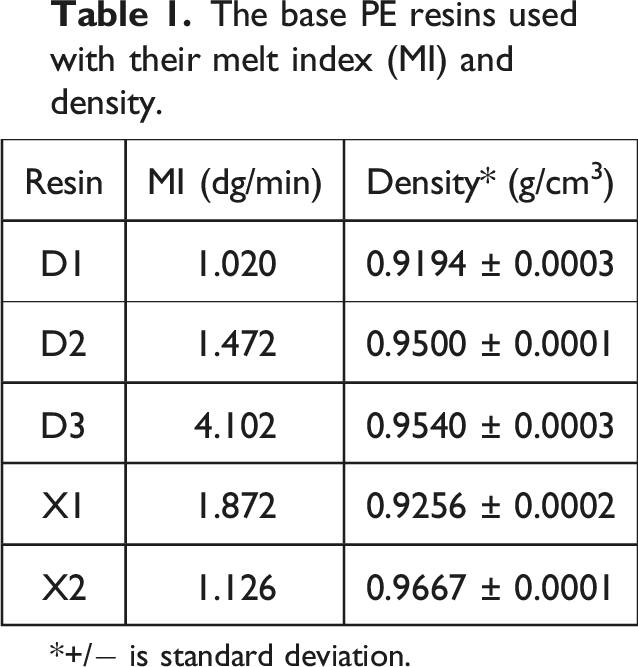
*+/− is standard deviation.
Blown films used with theoretically predicted density for the blends.
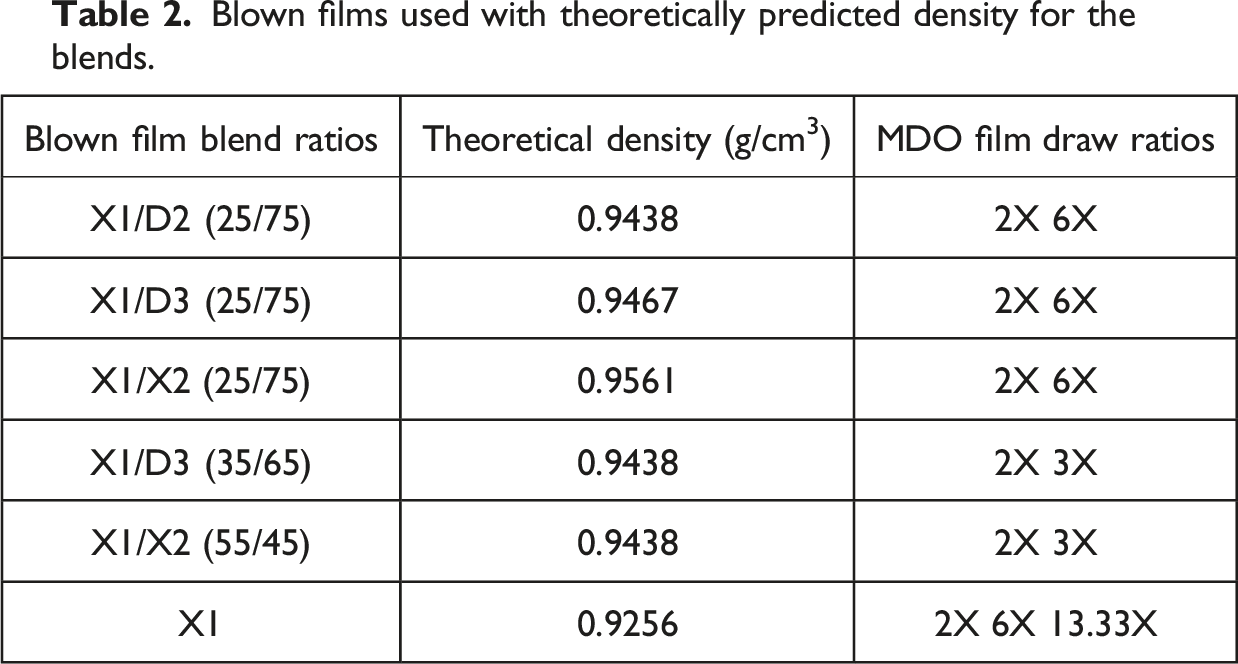
Then the density was kept constant at the X1/D2 (25/75) 0.9438 g/cm3 density. The other blends were X1/D3 (35/65) and X1/X2 55/45), determined by inverse-additive mixing rule. This was done to make blown film blends with similar densities in order to compare mechanical properties before and after the MDO process.
To study how the process draw ratio (MDX) affects tensile modulus, we chose blown film made from base resin X1 as it has a lower density which presents relatively higher possibility of stretching at higher process draw ratios as compared to other higher density resins because it has lower overall crystallinity as learned from the study of Ratta et al. 38 The X1 blown film could be stretched up to 13.33X, the highest process draw ratio studied (Table 2).
Preparation of blown films
The nip roller speed was approximately 3 m/min, and it was adjusted to get the required BUR and DDR in each extrusion.
Preparation of MDO films
The heating chamber (oven) and rollers from a Konark extrusion line provided the required stretching temperature for the pilot-scale MDO setup to process lab-scale blown films (pictorial representation in supplemental information). The heating chamber circulated the inside air to maintain a constant temperature during stretching. The MDO orientation temperature for each blown film was 15°C below the peak melting temperature. The annealing step freezes the orientation established during the stretching process, thereby stabilizing the film and preventing further dimensional changes. The annealing temperature can vary depending on the desired final properties. While few academic and industrial studies explicitly discuss the MDO and biaxial orientation process technologies annealing temperature, it has been generally suggested that the annealing temperature should be either the same as, or slightly higher than, the stretching temperature.9,39–41
The heating chamber used to provide the necessary orientation temperature during the stretching was approximately 2.5 m in length. The extended heating chamber length increased the residence time of the running web, allowing the films to undergo both stretching and annealing simultaneously within the same step. No dimensional changes were observed in the films after stretching. Consequently, the annealing temperature was essentially the same as the film orientation temperature.
It is important to note that the process draw ratio (Equation (1)) differs from the previously mentioned natural draw ratio and is independent of the material properties.
For each experimental set the roller speed before oven was specific to get desired process draw ratios (Table 2). Natural draw ratio was calculated using equation (2).
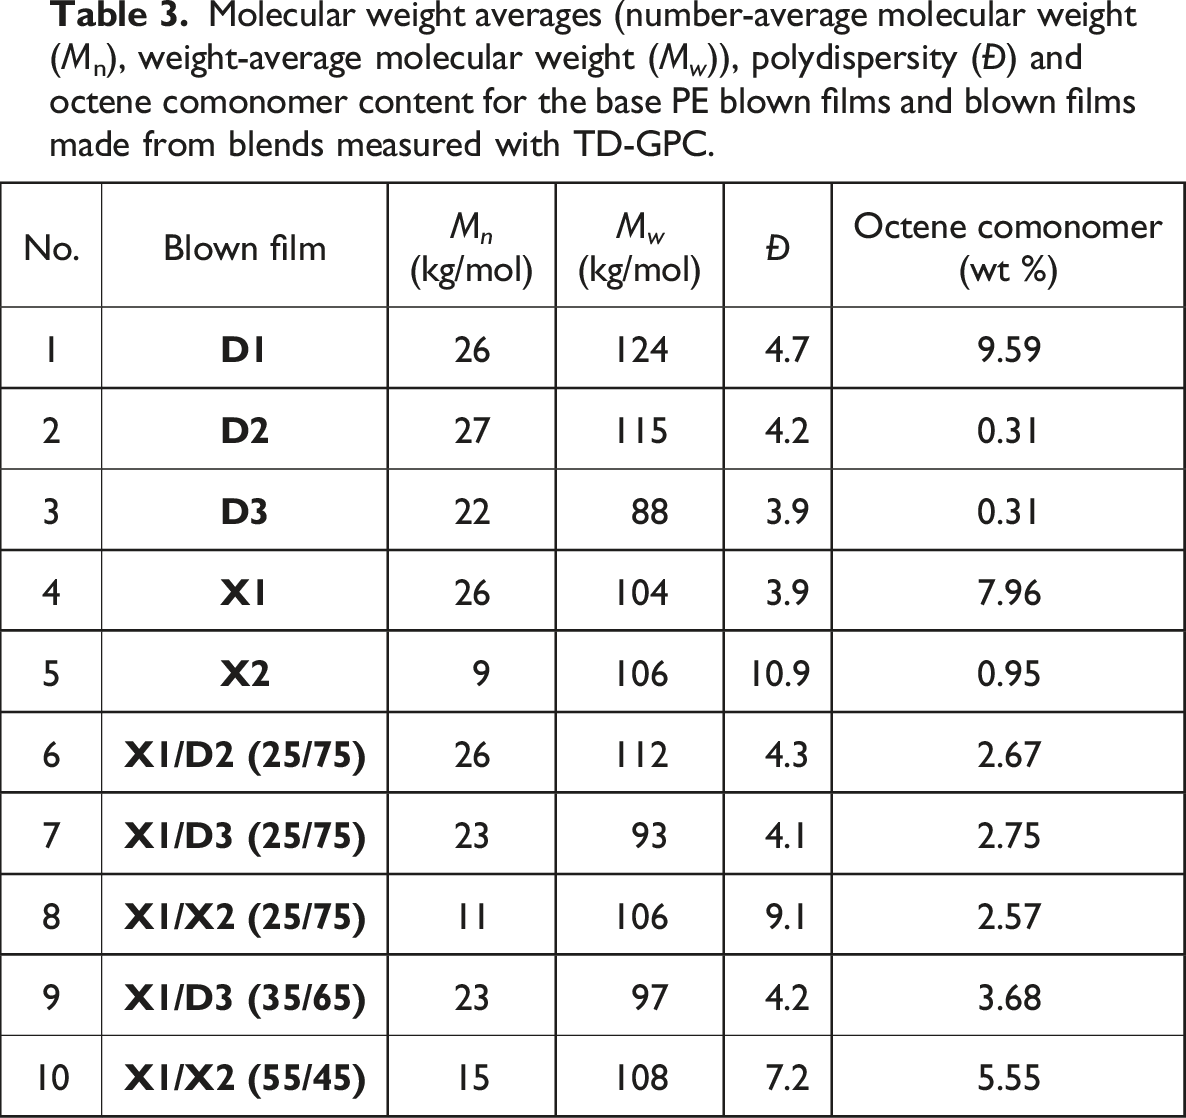
Molecular weight averages (number-average molecular weight (Mn), weight-average molecular weight (M w )), polydispersity (Đ) and octene comonomer content for the base PE blown films and blown films made from blends measured with TD-GPC.
In the third experimental set, the X1 resin blown film was stretched at 2, 6 and 13.33 process draw ratios.
Tensile properties
Blown film and MDO film tensile testing was conducted using an INSTRON 5565 tensile testing machine in accordance with the ASTM D882 method. Samples, 10 mm wide with a gauge length of 50 mm, were mounted on the machine. A constant extension rate of 100 mm/min, corresponding to a nominal strain rate of approximately 0.033 s⁻1, was used for the mechanical performance analysis. The 2% secant modulus, a measure of material stiffness was quantified using integrated Bluehill software, which measured the slope of the line drawn from the origin of the stress-strain curve to the point intersecting the curve at 2% strain. Five replicates were tested in both the machine and transverse directions.
Gel permeation chromatography (GPC)
Molecular weight distribution (MWD) and architecture were measured using triple-detector gel permeation chromatography (TD-GPC) according to the procedure described in Yau et al. (2013) 42 and Pathaweeisariyakul et al. (2015). 43 The triple detector GPC-IR system from Polymer Char used had an Agilent 1260 Infinity isocratic pump, a Polymer Char autosampler, a high-temperature GPC chromatograph equipped with four 20 µm Agilent “Mixed A” GPC columns, an IR5-MCT detector, a four-capillary bridge viscometer from Polymer Char, and a 2-angle light scattering detector from Agilent. The 15° light scattering channel directly measured the absolute molecular weight. The polymer resins were dissolved in 1,2,4-trichlorobenzene (TCB) at 160°C at approximately 1.6 mg/mL and processed through a column packed with gel particles, which separated the molecules by size. A 1 mL/min volumetric flow rate was used. This measurement determined the microstructural resin parameters, including average molecular weight, molecular weight distribution, comonomer distribution, and branching fractions.
Chemical composition distribution (CCD)
The chemical composition distribution (CCD), or the short chain branching distribution (SCBD), was determined using an improved CCD (iCCD) technique with CCD equipment from Polymer Char, featuring columns packed with gold-coated nickel particles. Approximately 32 mg was dissolved in 8 mL 1,2-dichlorobenzene at 150°C, and the solution was gently shaken for about 1 hour in the Polymer Char autosampler. After injection, the sample was allowed to stabilize for 2 minutes before being cooled under quiescent conditions from 105°C to 30°C at −3°C/min, during the crystallization step. Upon reaching 30°C, a 0.5 mL/min flow rate was applied, and after 2 minutes, the temperature was increased to 140°C at 3°C/min. During this step, polymer fractions dissolved and eluted at the temperature corresponding to their composition, which was measured using an IR5 detector. Data processing was conducted using Polymer Char’s “GPC One” software with custom-verified processing methods.
Shear rheology
Small amplitude oscillatory shear flow measurements, known as dynamic mechanical spectroscopy (DMS) were performed under a nitrogen atmosphere using an ARES-G2 rotational rheometer from TA Instruments, equipped with a forced convection oven. The setup involved parallel plates with a 25 mm diameter and a 1.8 mm gap. Frequency sweeps were conducted from 0.1 to 100 rad/s, with five logarithmically spaced steps per decade, at a strain within the linear viscoelastic range. Measurements were carried out at: 150°C, 170°C, and 190°C.
Fourier transform infrared spectroscopy (FTIR)
The ATR-FTIR spectra were recorded on a Bruker Tensor 27 device, with OPUS 6.5 software at 4 cm−1 resolution and wave numbers from 4000 to 600 cm−1.
Differential scanning calorimetry (DSC)
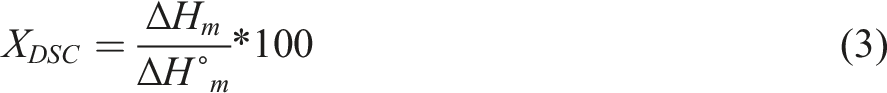
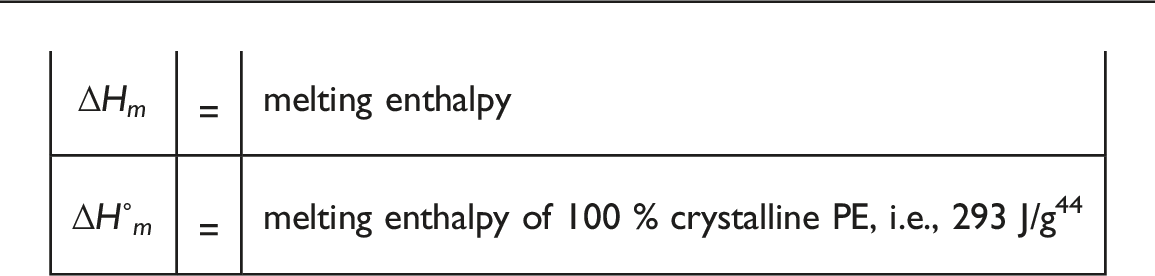
The enthalpy data was from the first melting curve of the heat-cool-heat cycle.
Scanning electron microscopy (SEM)
Imaging was with a scanning electron microscope (SEM) Quanta 3D FEG from Thermo Fisher Scientific. Before imaging, the samples were sputter-coated with gold (Au) using a Quorum Q150 T S for 40s at 40 mA.
Atomic force microscopy (AFM)
The surface morphology was characterized using atomic force microscopy (AFM). Samples were mounted on a stage with double-sided carbon tape and blow-cleaned with a duster before AFM analysis. AFM images were acquired at ambient temperature using a Bruker Icon AFM system with a MikroMasch probe in tapping mode. The probe spring constant was 40 N/m and resonance frequency was around 170 kHz. Imaging was at 0.5-2 Hz with an approximate 0.8 set point ratio.
Results and discussion
Molecular properties
Fourier transform infrared spectroscopy (FTIR)
Figure 2 shows the FTIR blown films spectra from the five base resins indicating PE as the main component.
45
The methyl group (CH3) umbrella mode vibration at 1377 cm−1 absence (Figure 2(b)) signifies no long-chain branching. The clear crystalline splitting at 1472/1462 and 729/720 cm−1 indicates a crystalline phase (Figures 2(b) and (c)). It is known that the polymer can degrade by unwanted chemical process like oxidation during processing as highlighted by many researchers.46–49 No oxidized groups were found, suggesting that the polymer architecture was not affected during the blown film extrusion step. Base resin infrared spectrum: (a) 4000-600 cm−1 spectral range, (b) 1500-1350 cm−1 region, (c) 750-700 cm−1 region.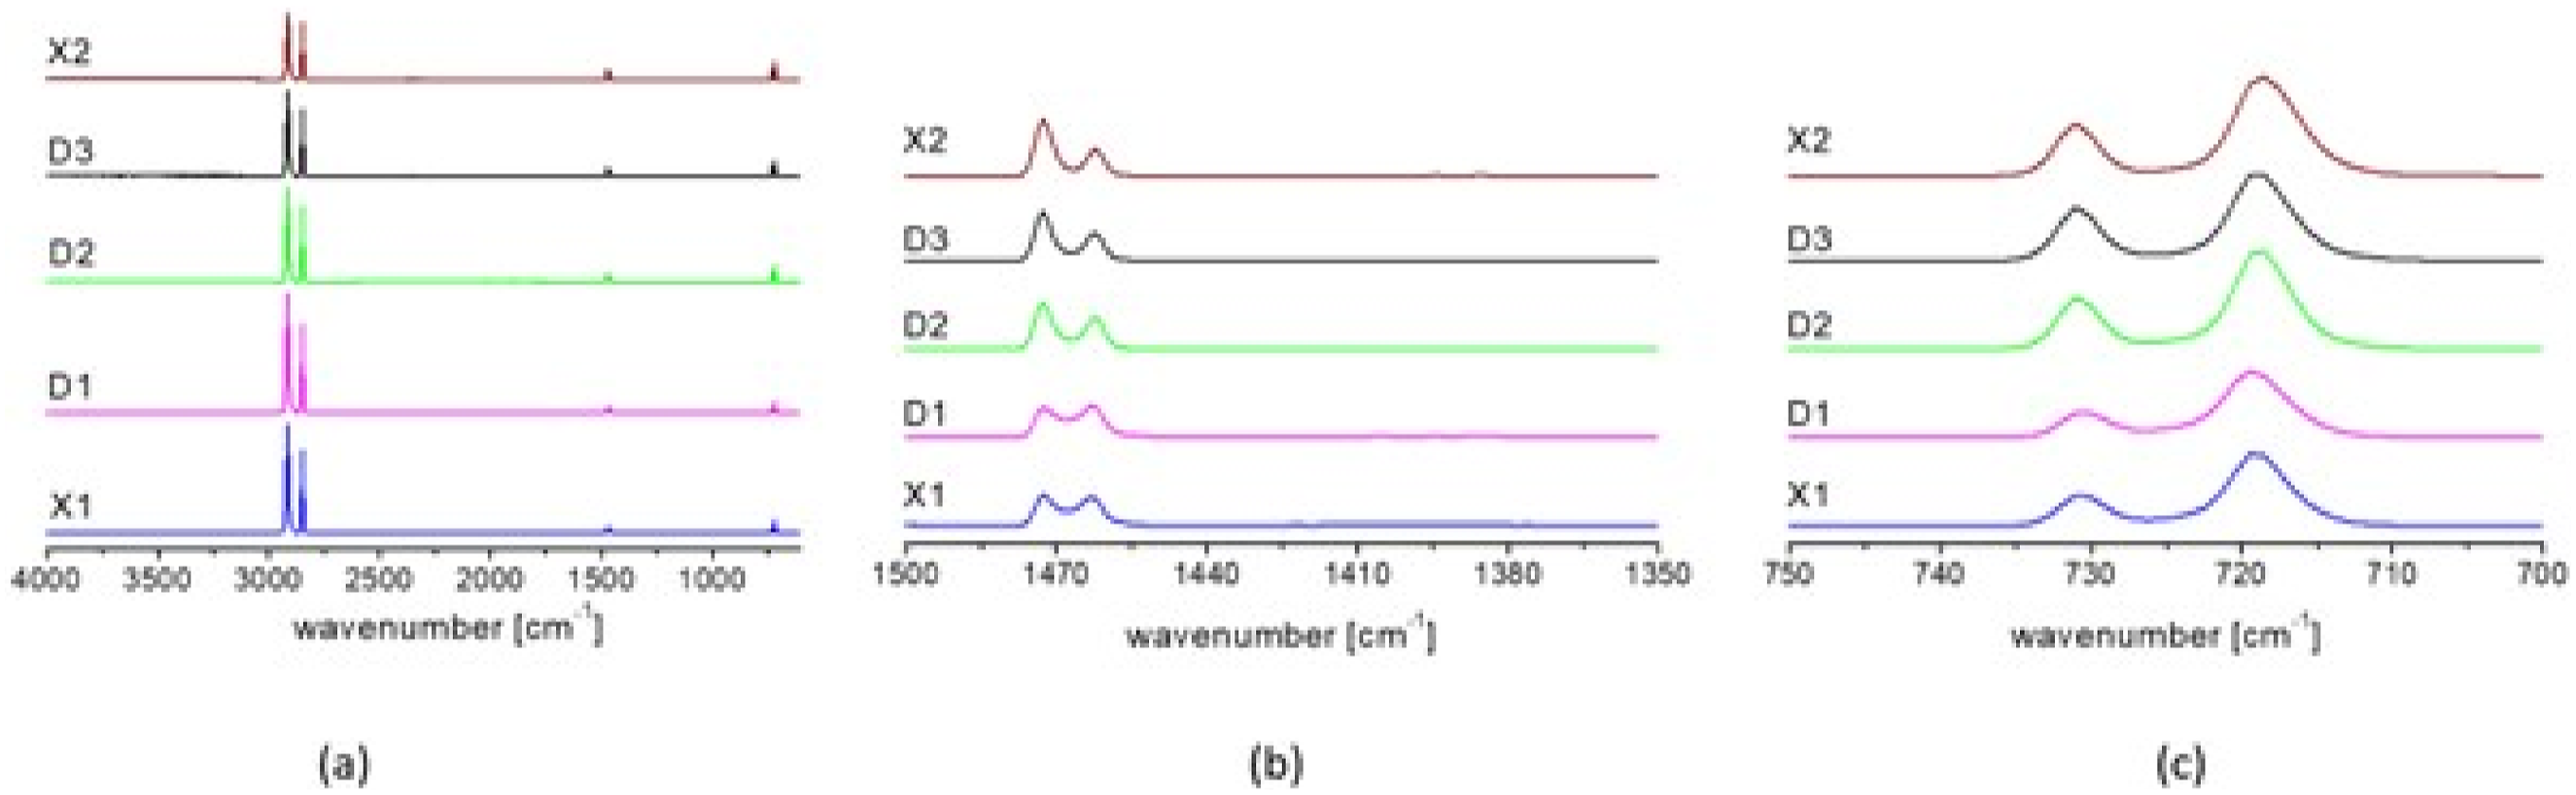
Molecular weight, molecular weight distribution and chemical composition distribution analysis
To obtain the relation between the polymer microstructural properties, that is molecular weight averages and molecular weight distribution (MWD), and the orientation-induced tensile property enhancement, we changed the PE resin composition used for film blowing. Figure 3 presents the molecular weight distributions for the blown films made from the base resins as obtained from TD-GPC. GPC curves for the blown films made from the five base resins. The left vertical axis represents the differential weight fractions (lines), and the right vertical axis represents the average SCB per 1000 C atoms at each molecular weight (open markers).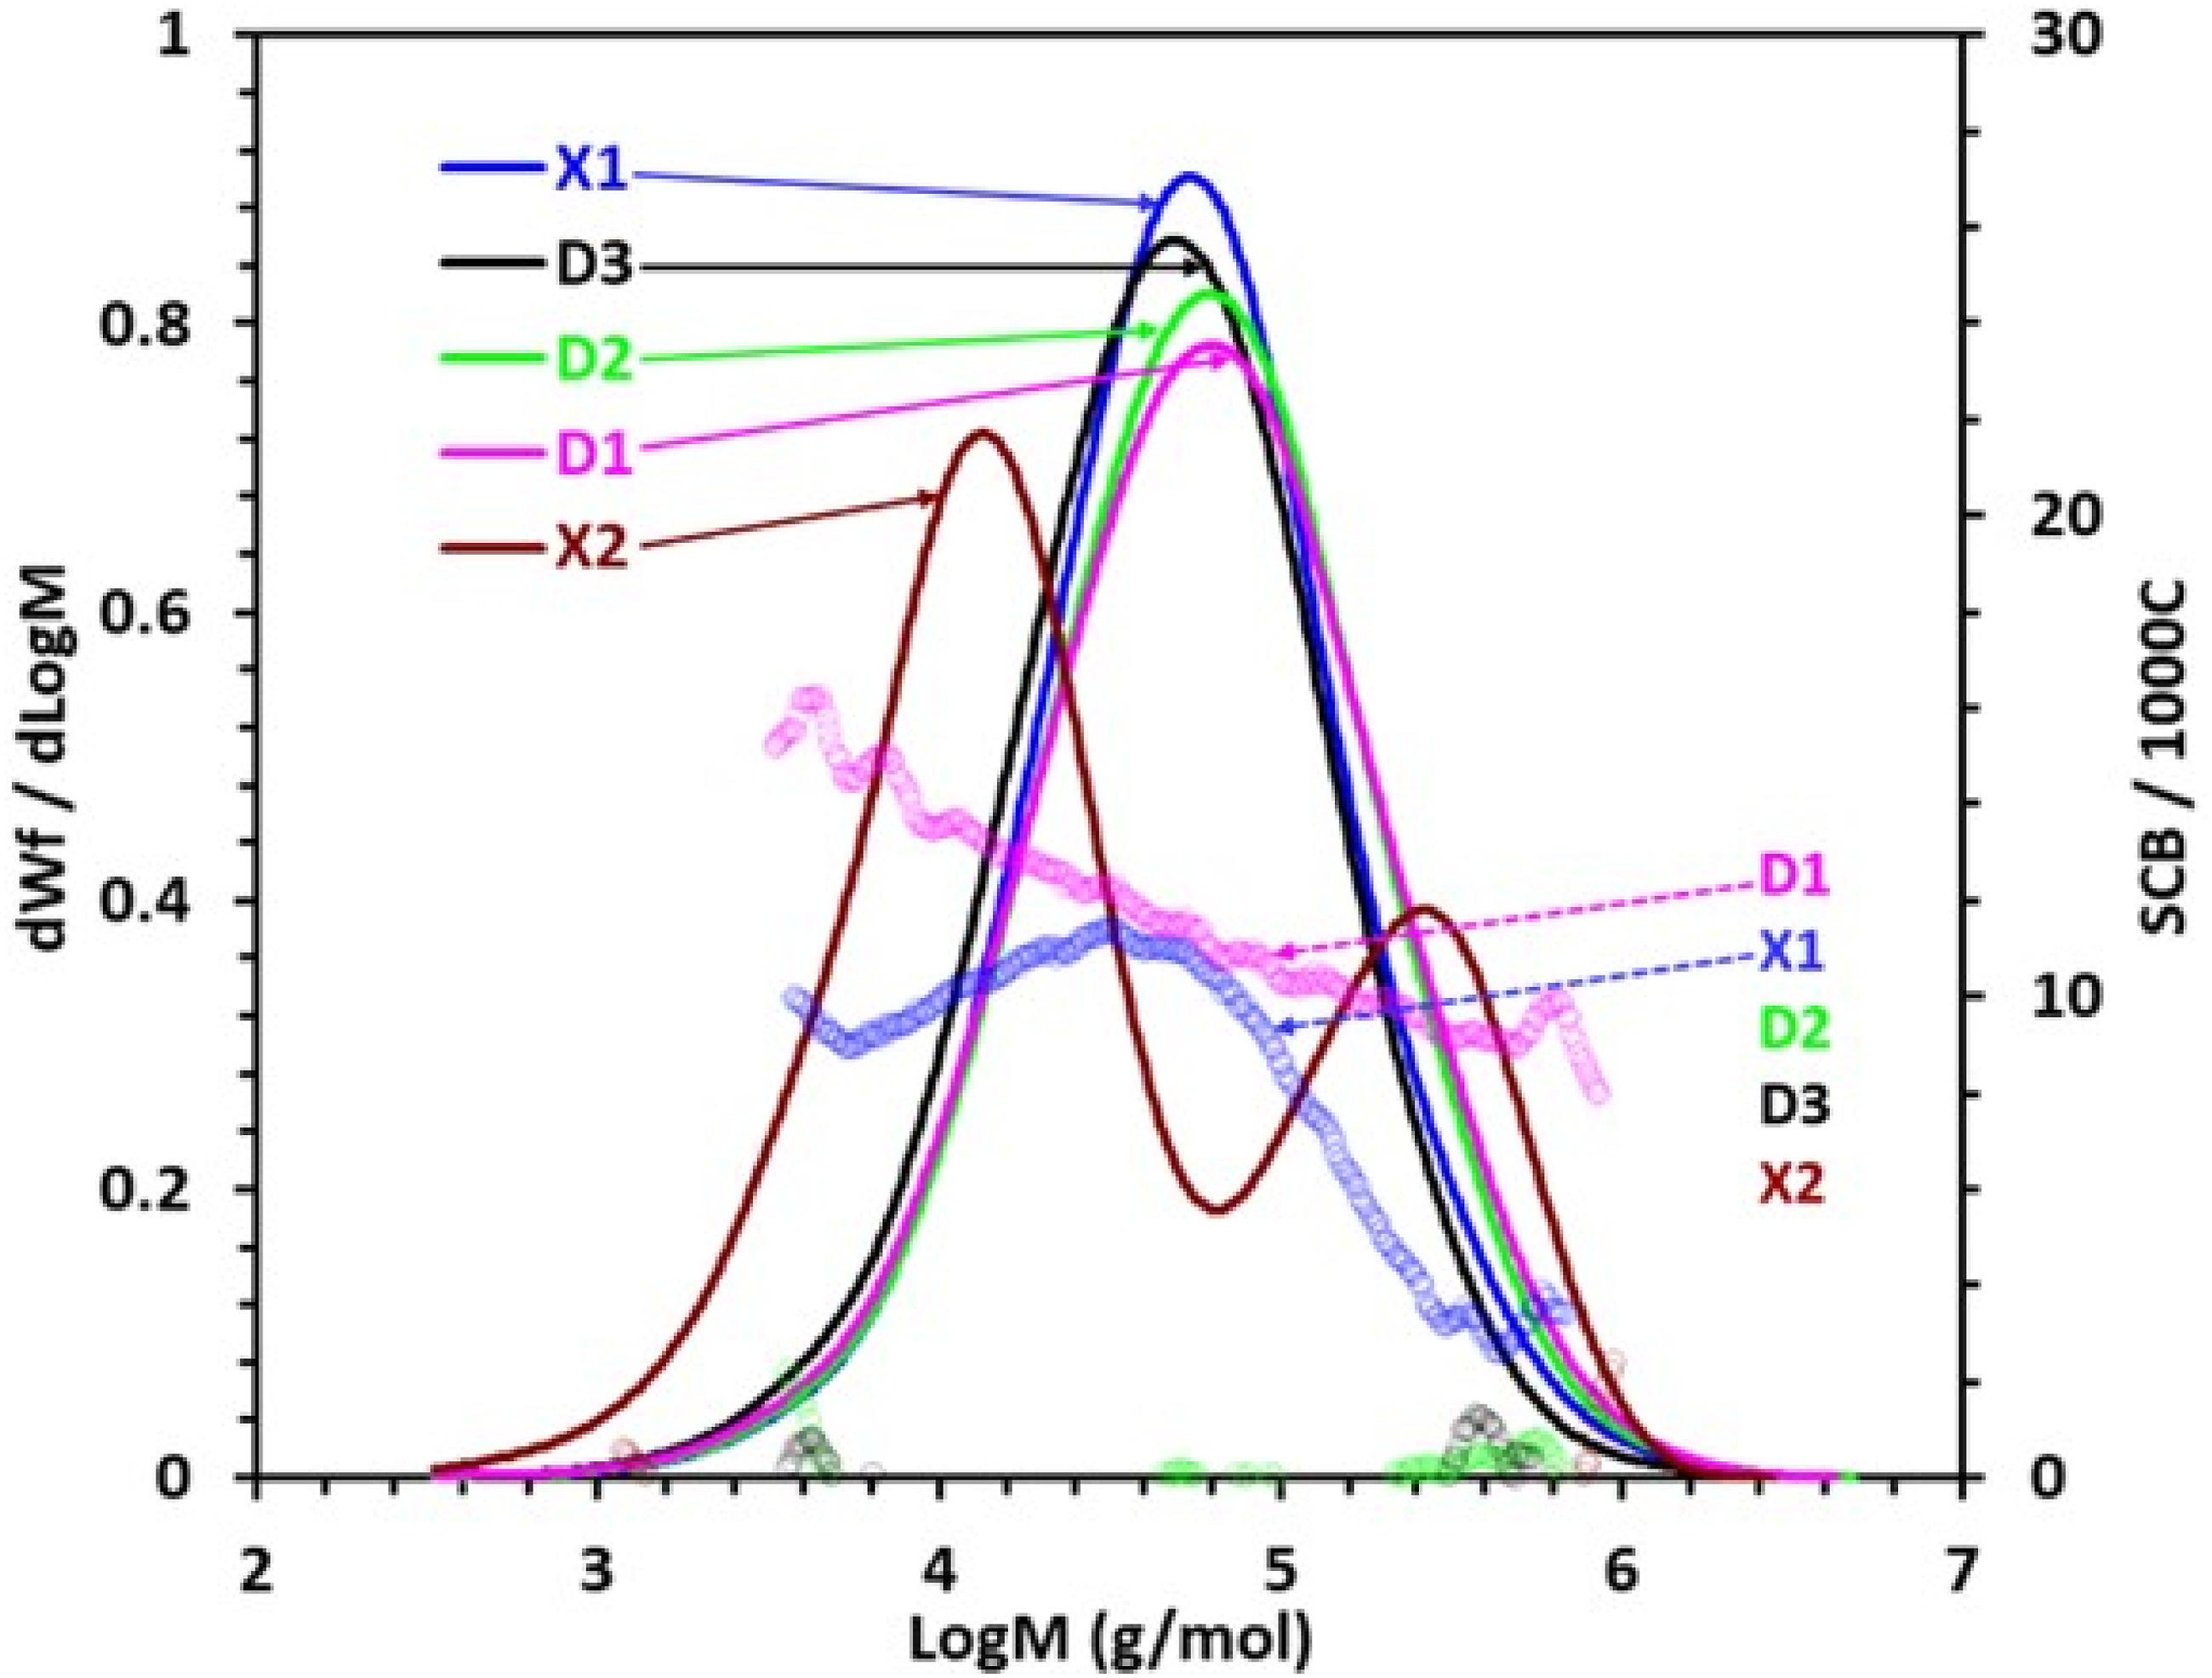
During PE’s thermo-mechanical degradation induced by processing, two chemical processes can occur: chain scission resulting in shorter polymer chains and chain cross-linking resulting in longer polymer chains and increased branching. 50 Table 3 compares the TD-GPC data for the blown films made from the base resins with the TD-GPC data for the base resins prior to blown film extrusion (Table S1 and Figure S2 in the supplemental information) revealed similar values, with no indications of molecular degradation. Figure 3 also presents the SCB distribution for the blown films made from the base resins using the TD-GPC IR detector. Table 3 summarizes the molecular weight averages and octene comonomer content.
The average molecular weight trends with MI (see Table 3 and Table 1). The polydispersity index for most base resin blown films falls between 3.9 and 4.7, with X2 being a notable exception, which exhibits a broader distribution and a bimodal MWD. SCB is nearly absent in the higher-density PE samples D2, D3, and X2. In contrast, lower-density PE’s, D1 and X1, contain significant SCB. The coupling between SCB and MWD differs significantly between these two. D2, D3, and X2 show distinct characteristics, with very low comonomer content, resulting in an almost homopolymer-like structure. This compositional similarity is reflected in their high densities. On the other hand, D1 and X1 clearly has comonomer, consistent with their lower densities. Further differentiation between D1 and X1 is observed, as comonomer is concentrated in lower molecular weight molecules in resin X1, while the highest molecular weight molecules exhibit low comonomer content.
Among the relatively lower density resins, D1 and X1, X1 was selected for blending with the higher density resins D2, D3, and X2 for making blown film of blends. This choice was based on lower comonomer content and its distinct distribution in the molecular architecture of resin X1 which was anticipated to result in relatively larger crystal size in its blown films. The larger crystal size was expected to contribute more effectively to microstructural orientation and modulus enhancement during the MDO process.
Figures 4(a) and (b) presents the MWD for the blown film from the blends and their SCB content. Table 3 summarizes the MWD data. Molecular weight (lines) and SCB distribution (open markers) for the blown films made from 25 wt% X1 with D2, D3 and X2 (a), and with constant density blends (0.9438 g/cm3) (b).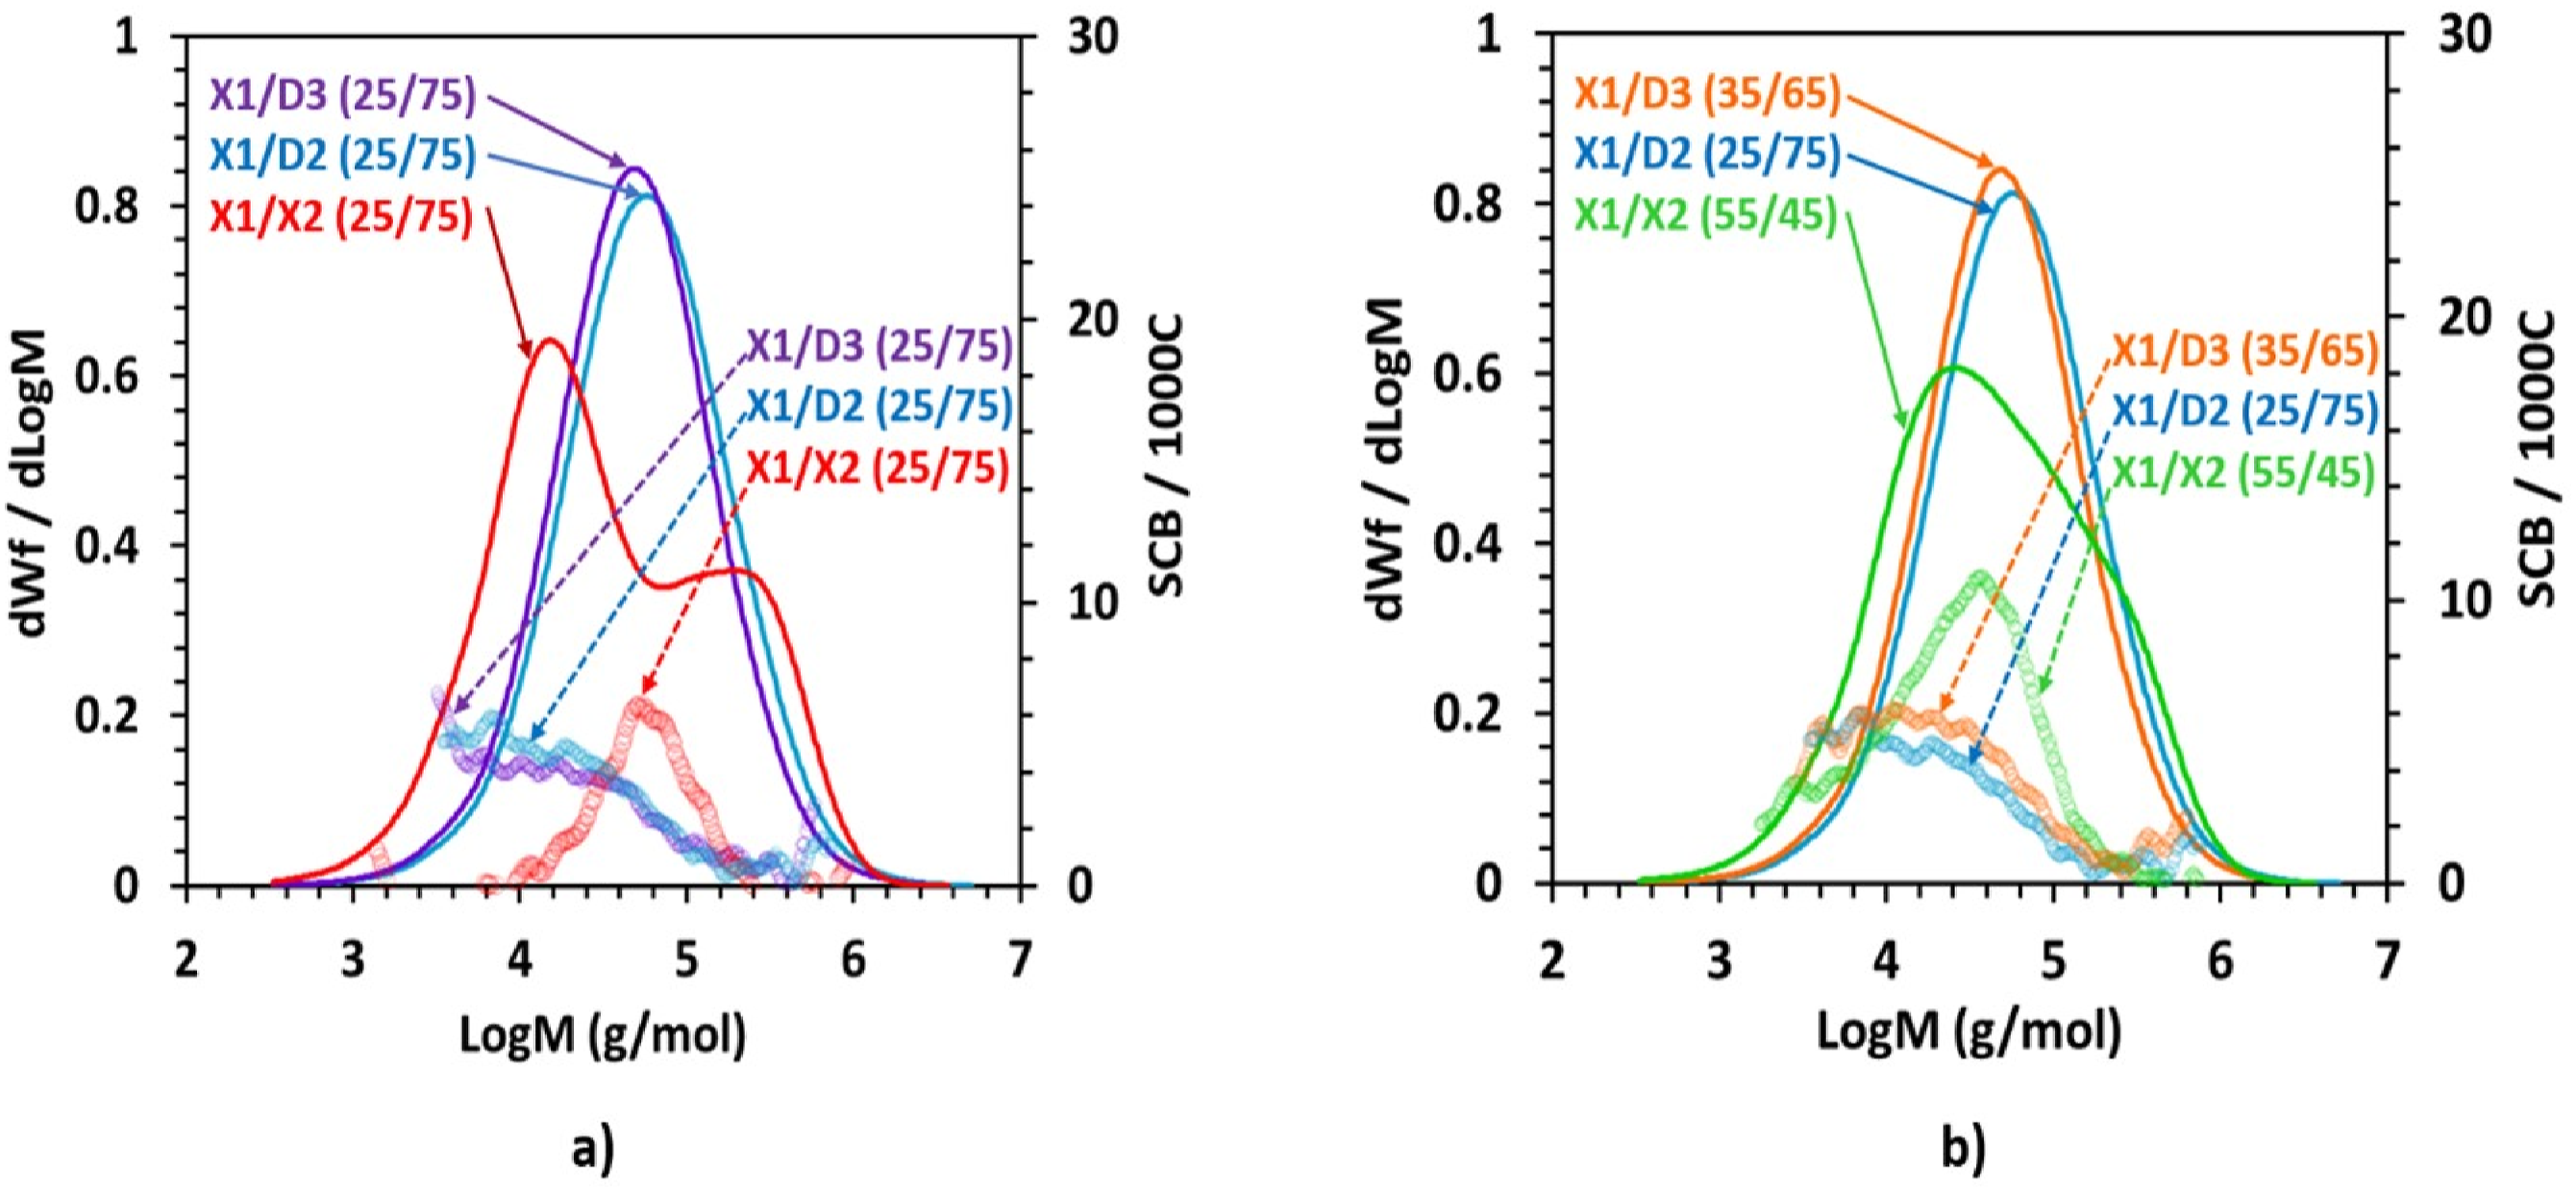
Figure 4(a) and Table 3 highlight notable variations in the weight average molecular weight of blown films obtained from all blends with 25% weight percentage of X1 in the blend.
The X1/D3 (25/75) blend exhibited the lowest, while X1/D2 (25/75) blend showed the highest weight-average molecular weight, consistent with the D3 and D2 molecular weights. Additionally, a slight polydispersity index reduction was observed in the X1/X2 (25/75) blend compared to X2, indicating an influence on molecular weight distribution due to blending with X1. Slight percentages (about 2.5%) of SCB were introduced into the microstructure of all three blown films of blends, in comparison to the blown films composed of base resins D2, D3, and X2, as a result of blending with low-density resin X1.
Theoretically predicted and TD-GPC measured
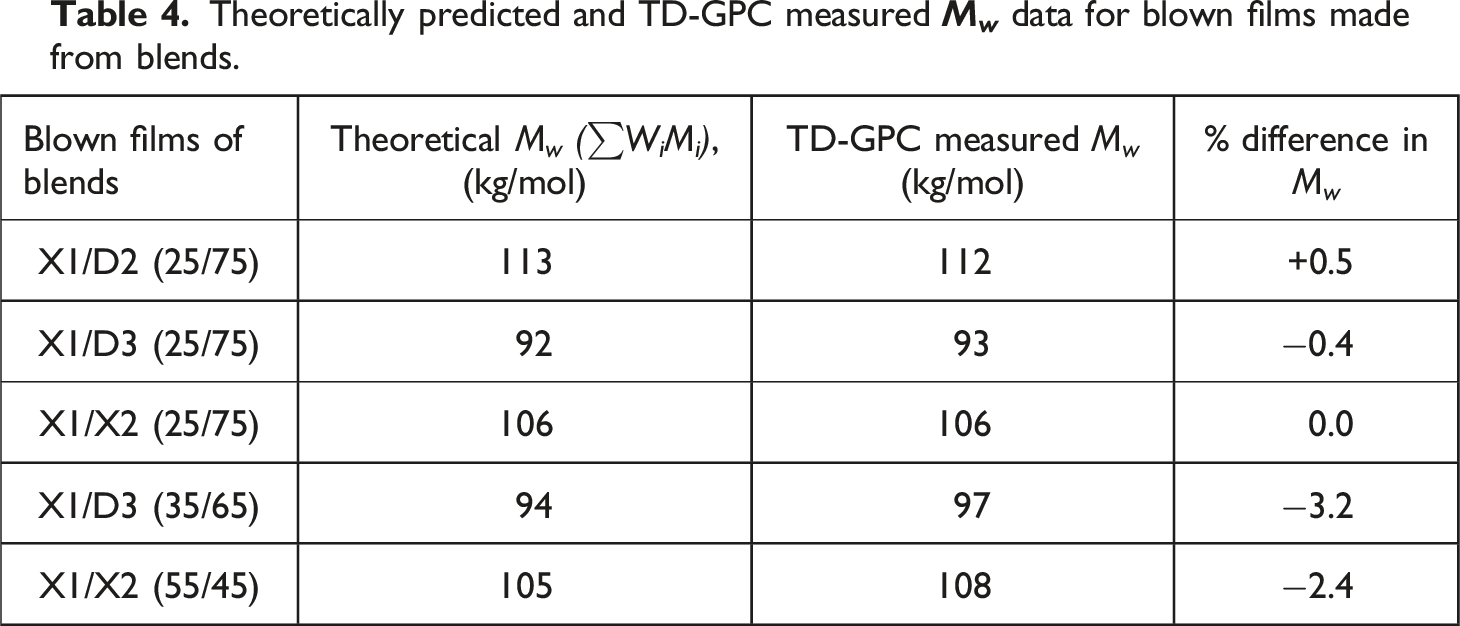
Figure 4(b) shows the molecular variations, including molecular weight and molecular weight distribution, for the blown films that used X1/X2 (25/75), X1/D3 (35/65), and X1/D3 (55/45) blends with similar density.
Figure 4(b) and Table 3 indicate that, at similar density as well, the X1/D3 (35/65) blend has the lowest weight-average molecular weight (M w ), while the X1/D2 (25/75) blend has the highest. Moreover, the increased X1 weight % in the X1/X2 (55/45) blend resulted in a further decrease in the polydispersity index compared to X1/X2 (25/75) blend, along with higher short chain branching in its microstructure.
Additionally, Figure 5 overlays the MWD curves for the blown films of X1, X2, and their blends, demonstrating the expected molecular weight distribution corresponding to the blend ratios. Overlay MWD curves of blown films of X1, X2 and their blends.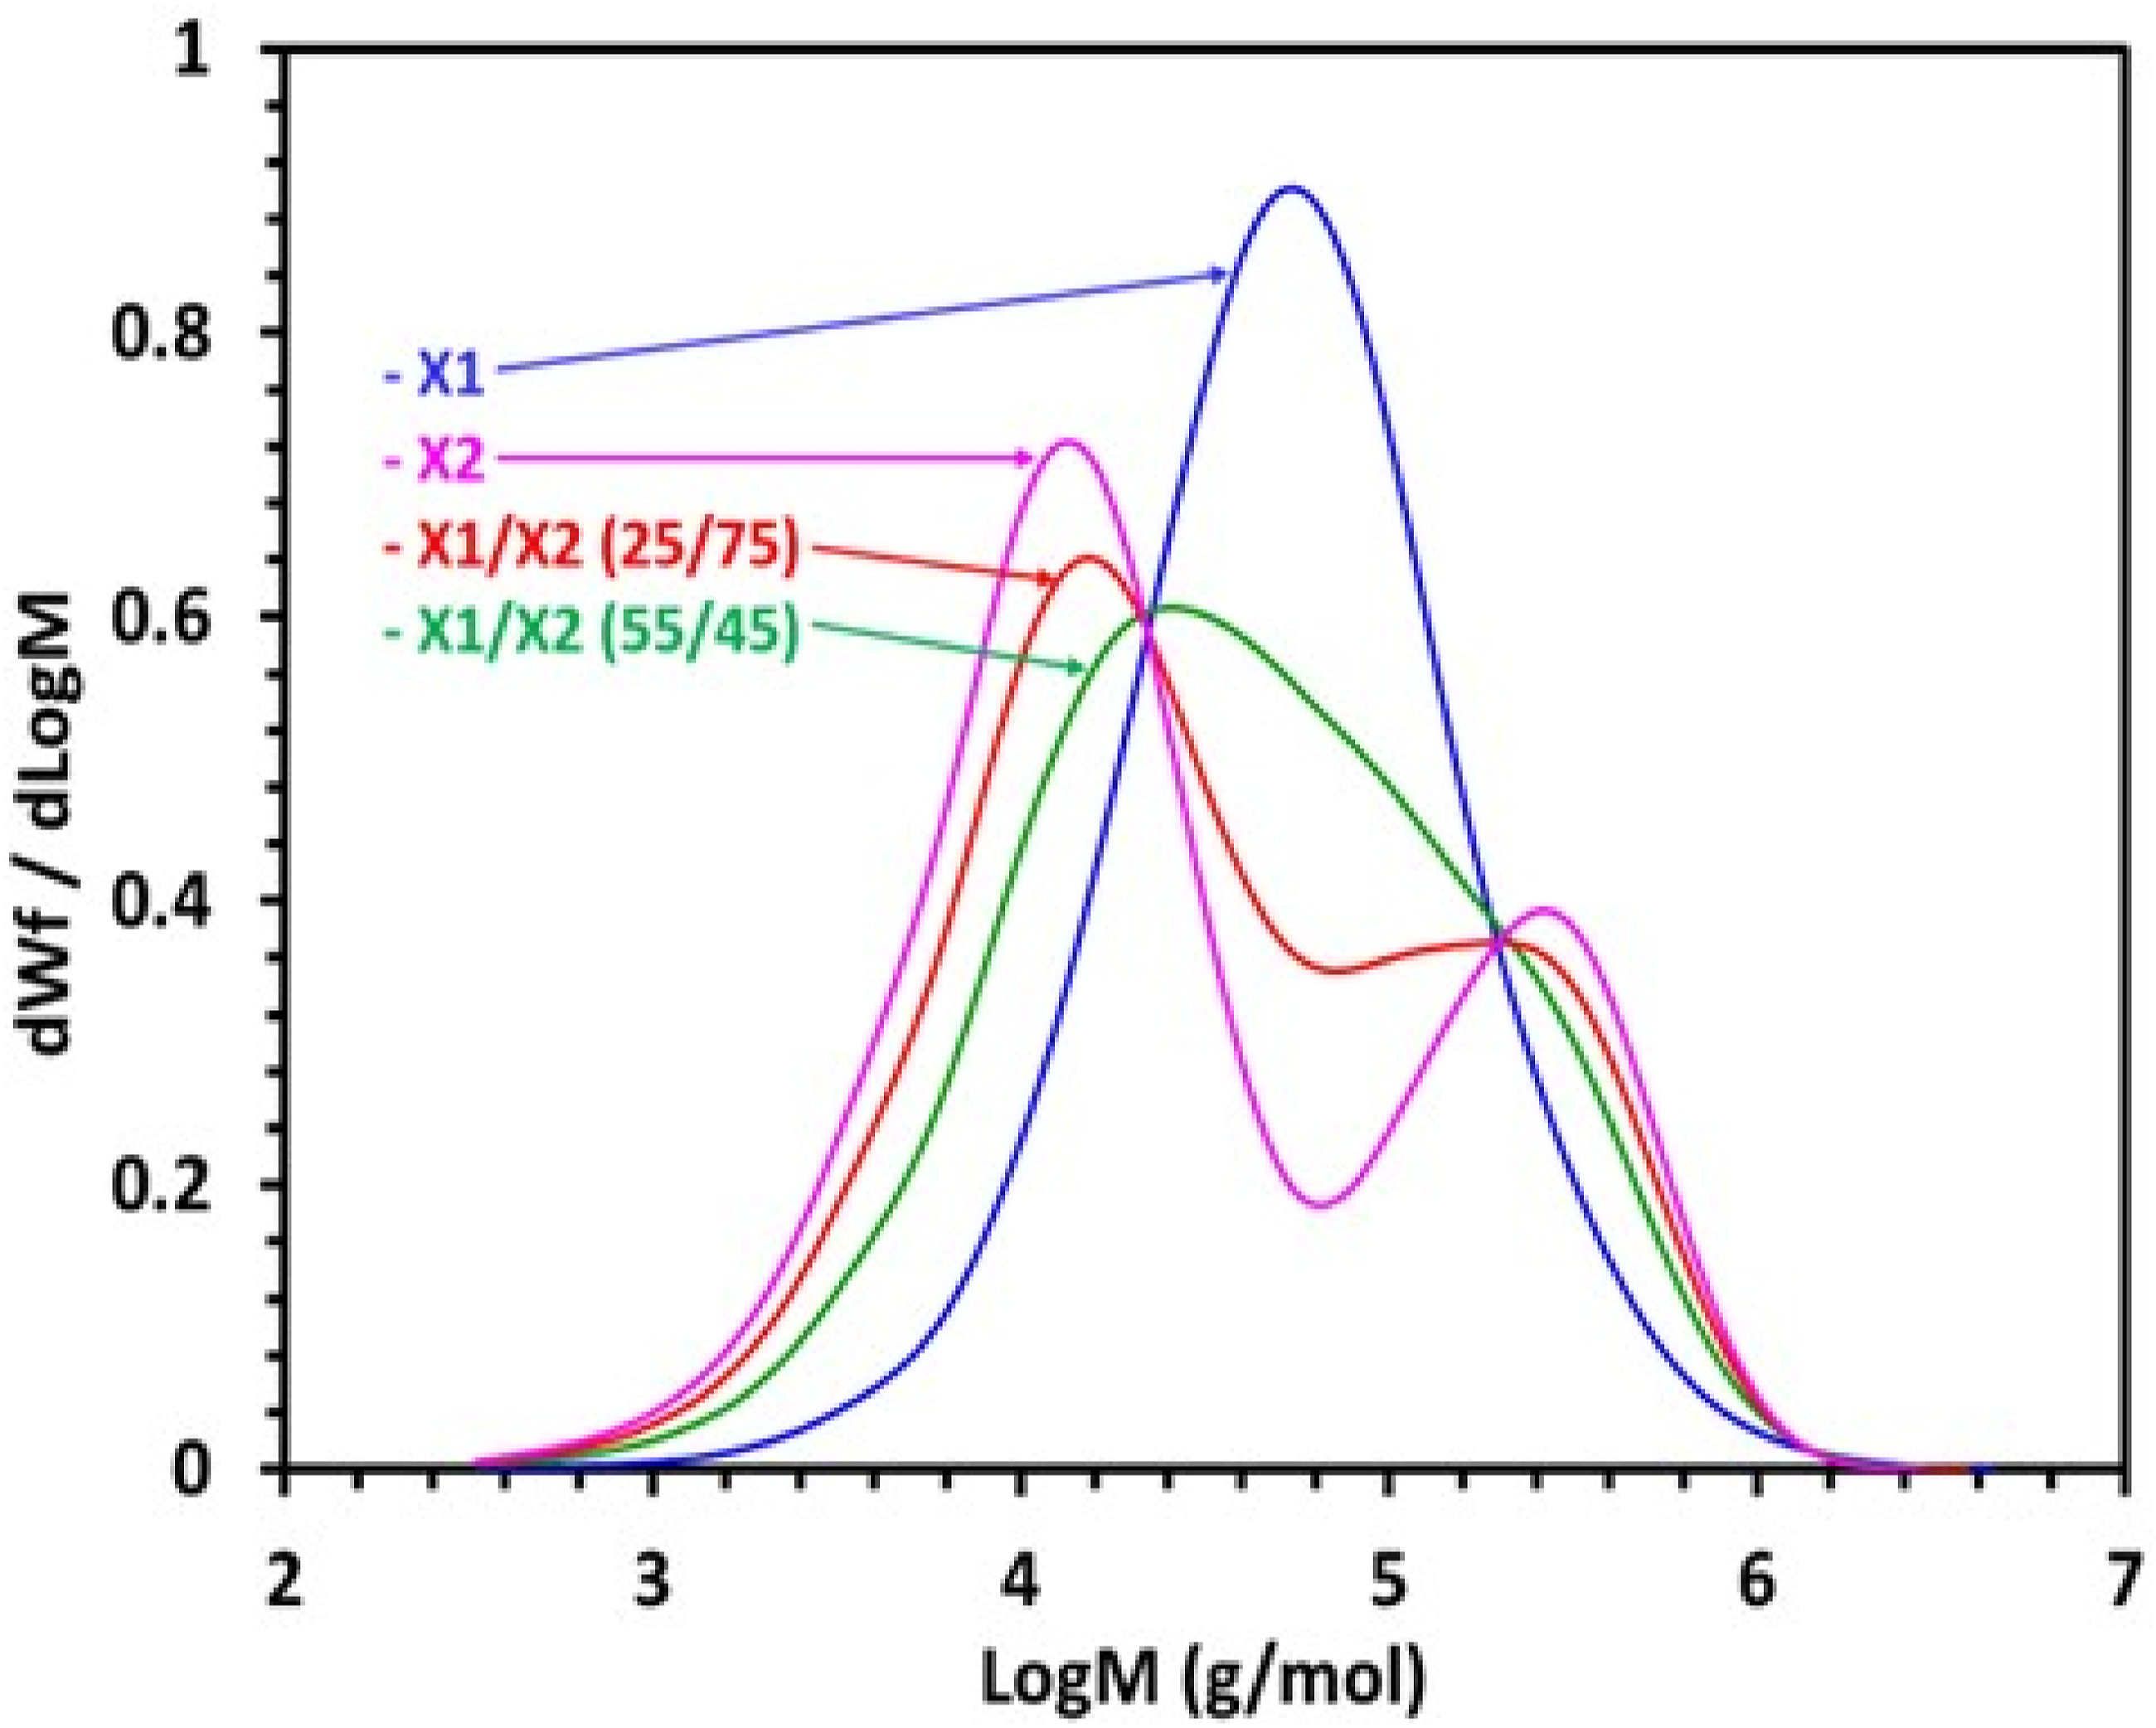
Figure 6 shows the iCCD curves for the blown films of base resins and Figures 7(a) and (b) presents it for blown films with blends with information regarding the crystallizable fractions in their microstructure at each specific temperature. iCCD curves for the blown films from base resins used in the study. iCCD curves for the blown films from 25 wt% X1 blends with D2, D3 and X2 (a), and with constant density (b).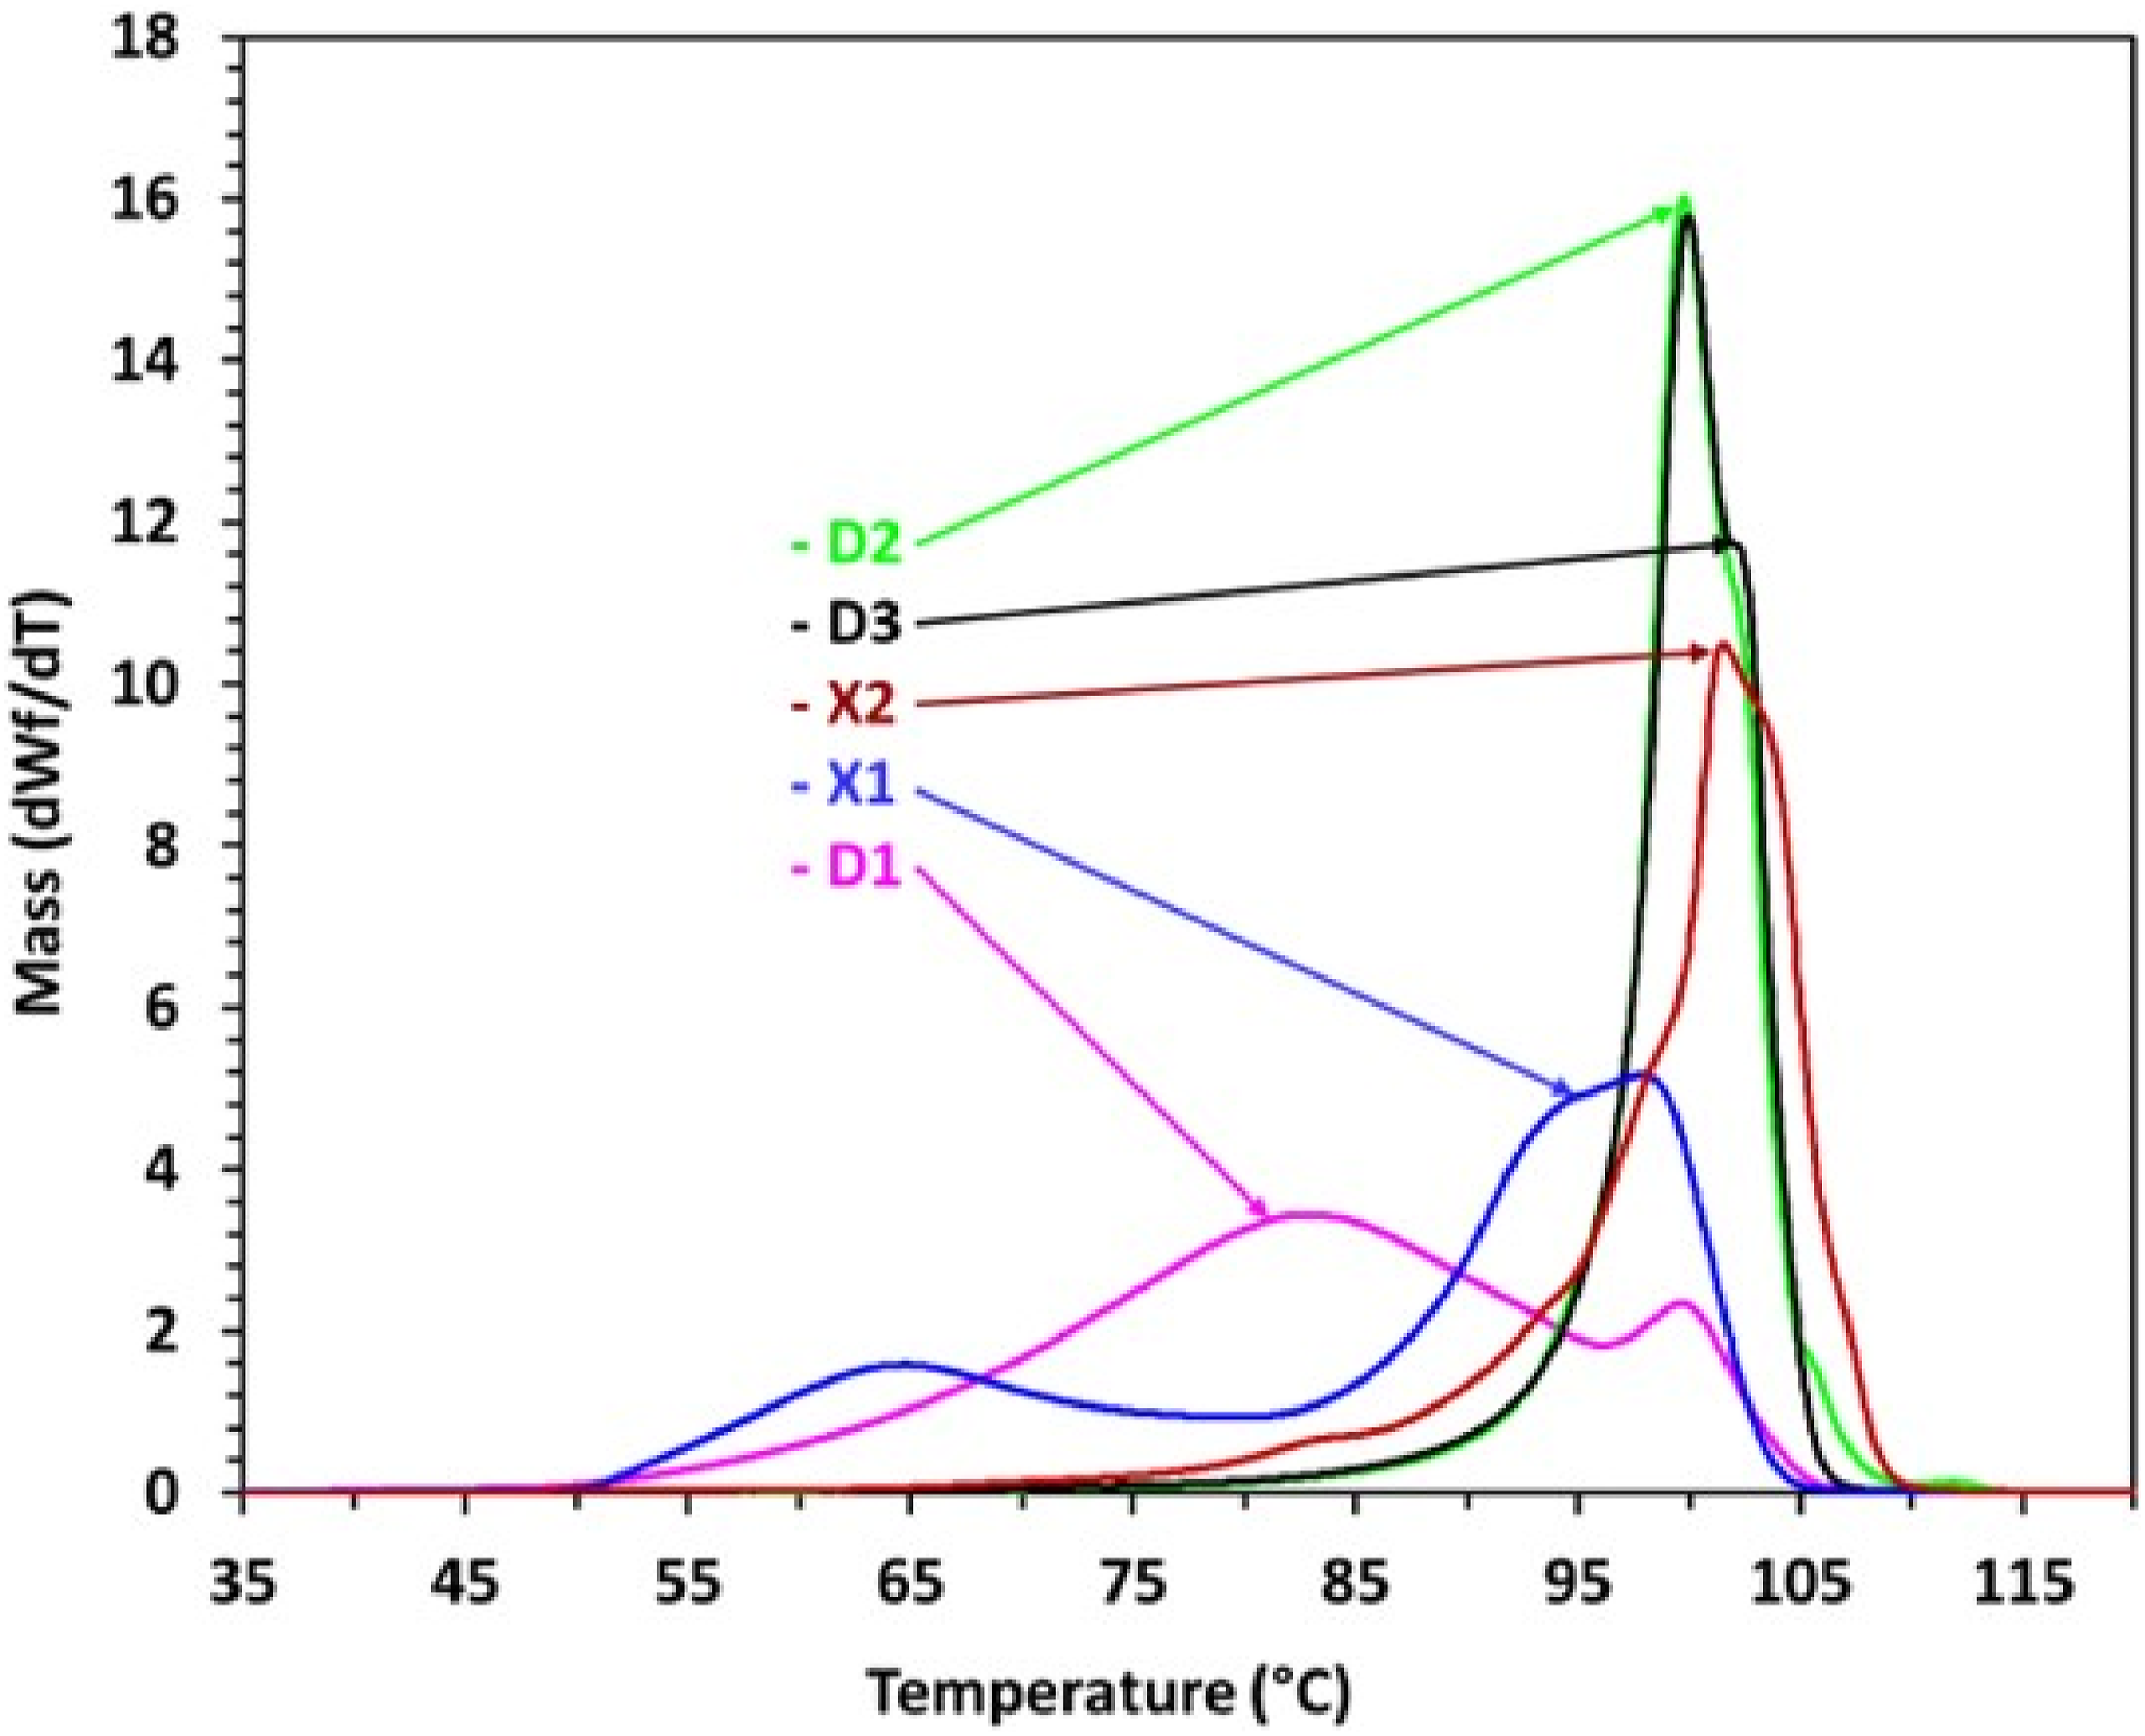
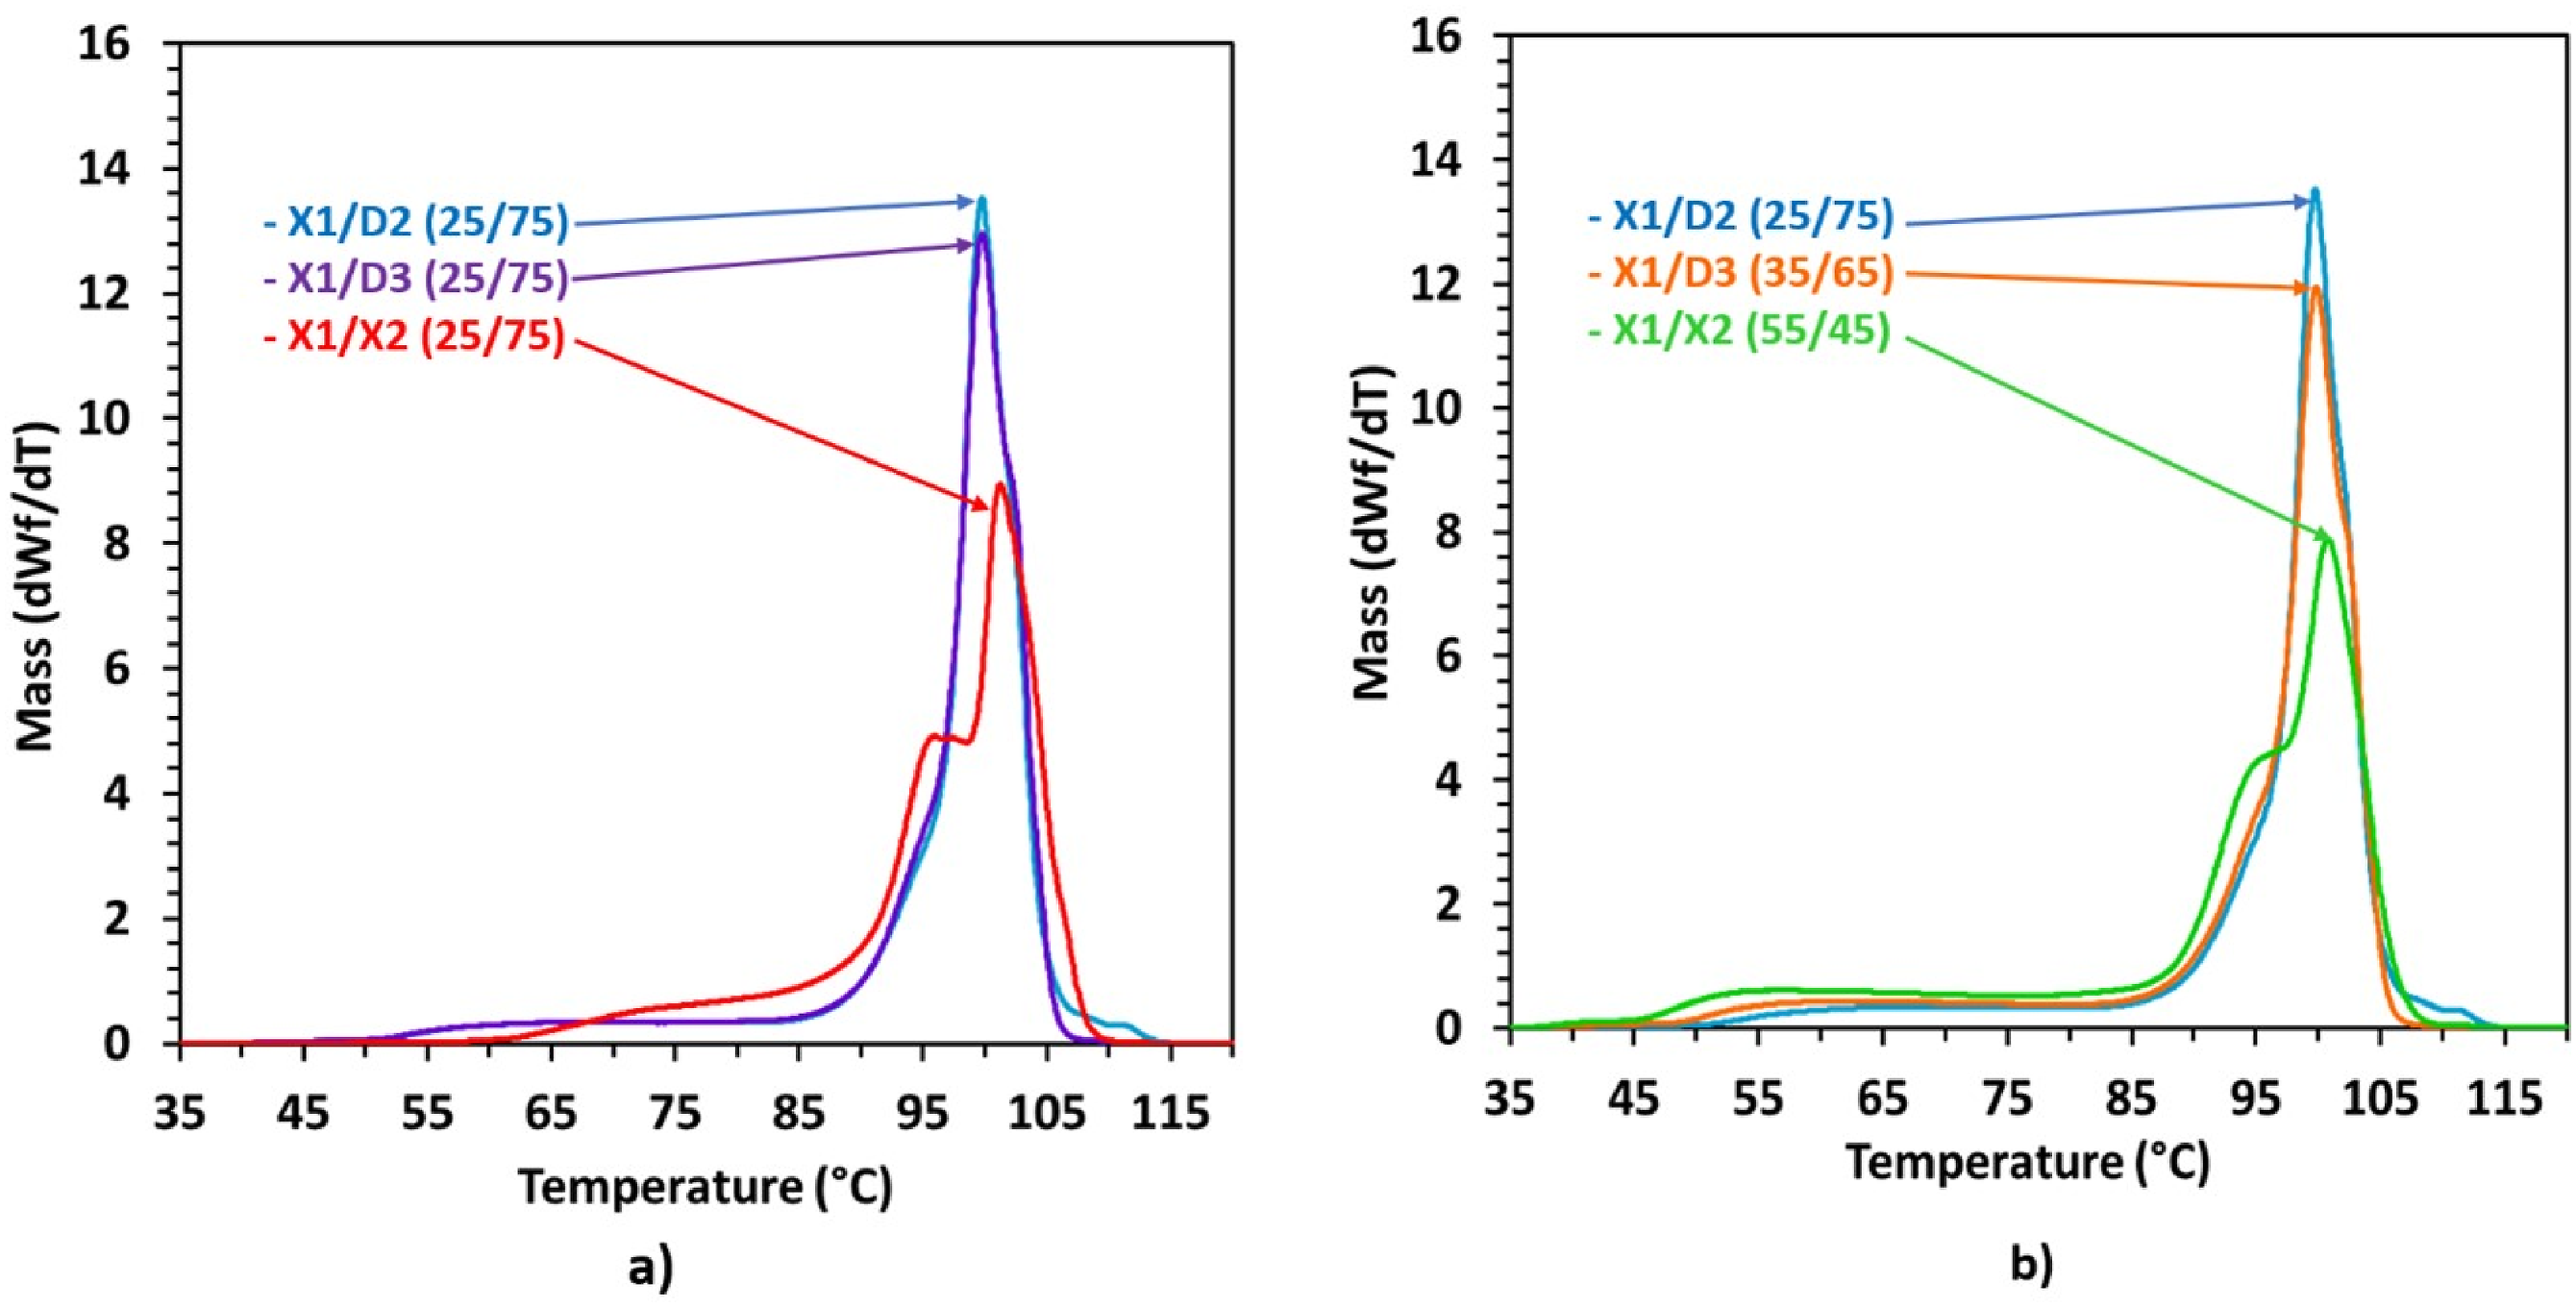
Figure 7(a) illustrates distinct temperature profiles for the peak elution of crystallizable mass fractions among three different blown films from blends with same 25 wt% of X1.
Notably, the X1/X2 (25/75) blended film exhibited the highest peak elution temperature, whereas the curves for the films X1/D2 (25/75) and X1/D3 (25/75) displayed comparable profiles. This observation aligns with expectations, given the higher X2 density, indicating a greater crystallizable fractions in its microstructure.
In contrast, Figure 7(b) shows a decrease in the peak height for the crystallizable mass fractions in the X1/D3 (35/65) and X1/X2 (55/45) blown film in comparison to curves in Figure 7(a). This aligns with the overall density decrease with higher X1 concentration compared to Figure 7(a). The curves are broader with increased X1 weight percentage in blends with D3 and X2, consistent with elevated comonomer content seen in GPC curves and data (Figure 4(b) and Table 3).
Figure 8 shows a similar trend in the iCCD curves for the X1, X2 blown films, and their blends. As the X1 weight percentage in the blends increased, the crystallizable mass fractions peak height and peak elution temperature decrease, along with peak broadening. This is consistent with the increased comonomer content with the increased X1 weight percentage in the X1/X2 blend microstructure. iCCD curves for the X1, X2 blown films and their blends.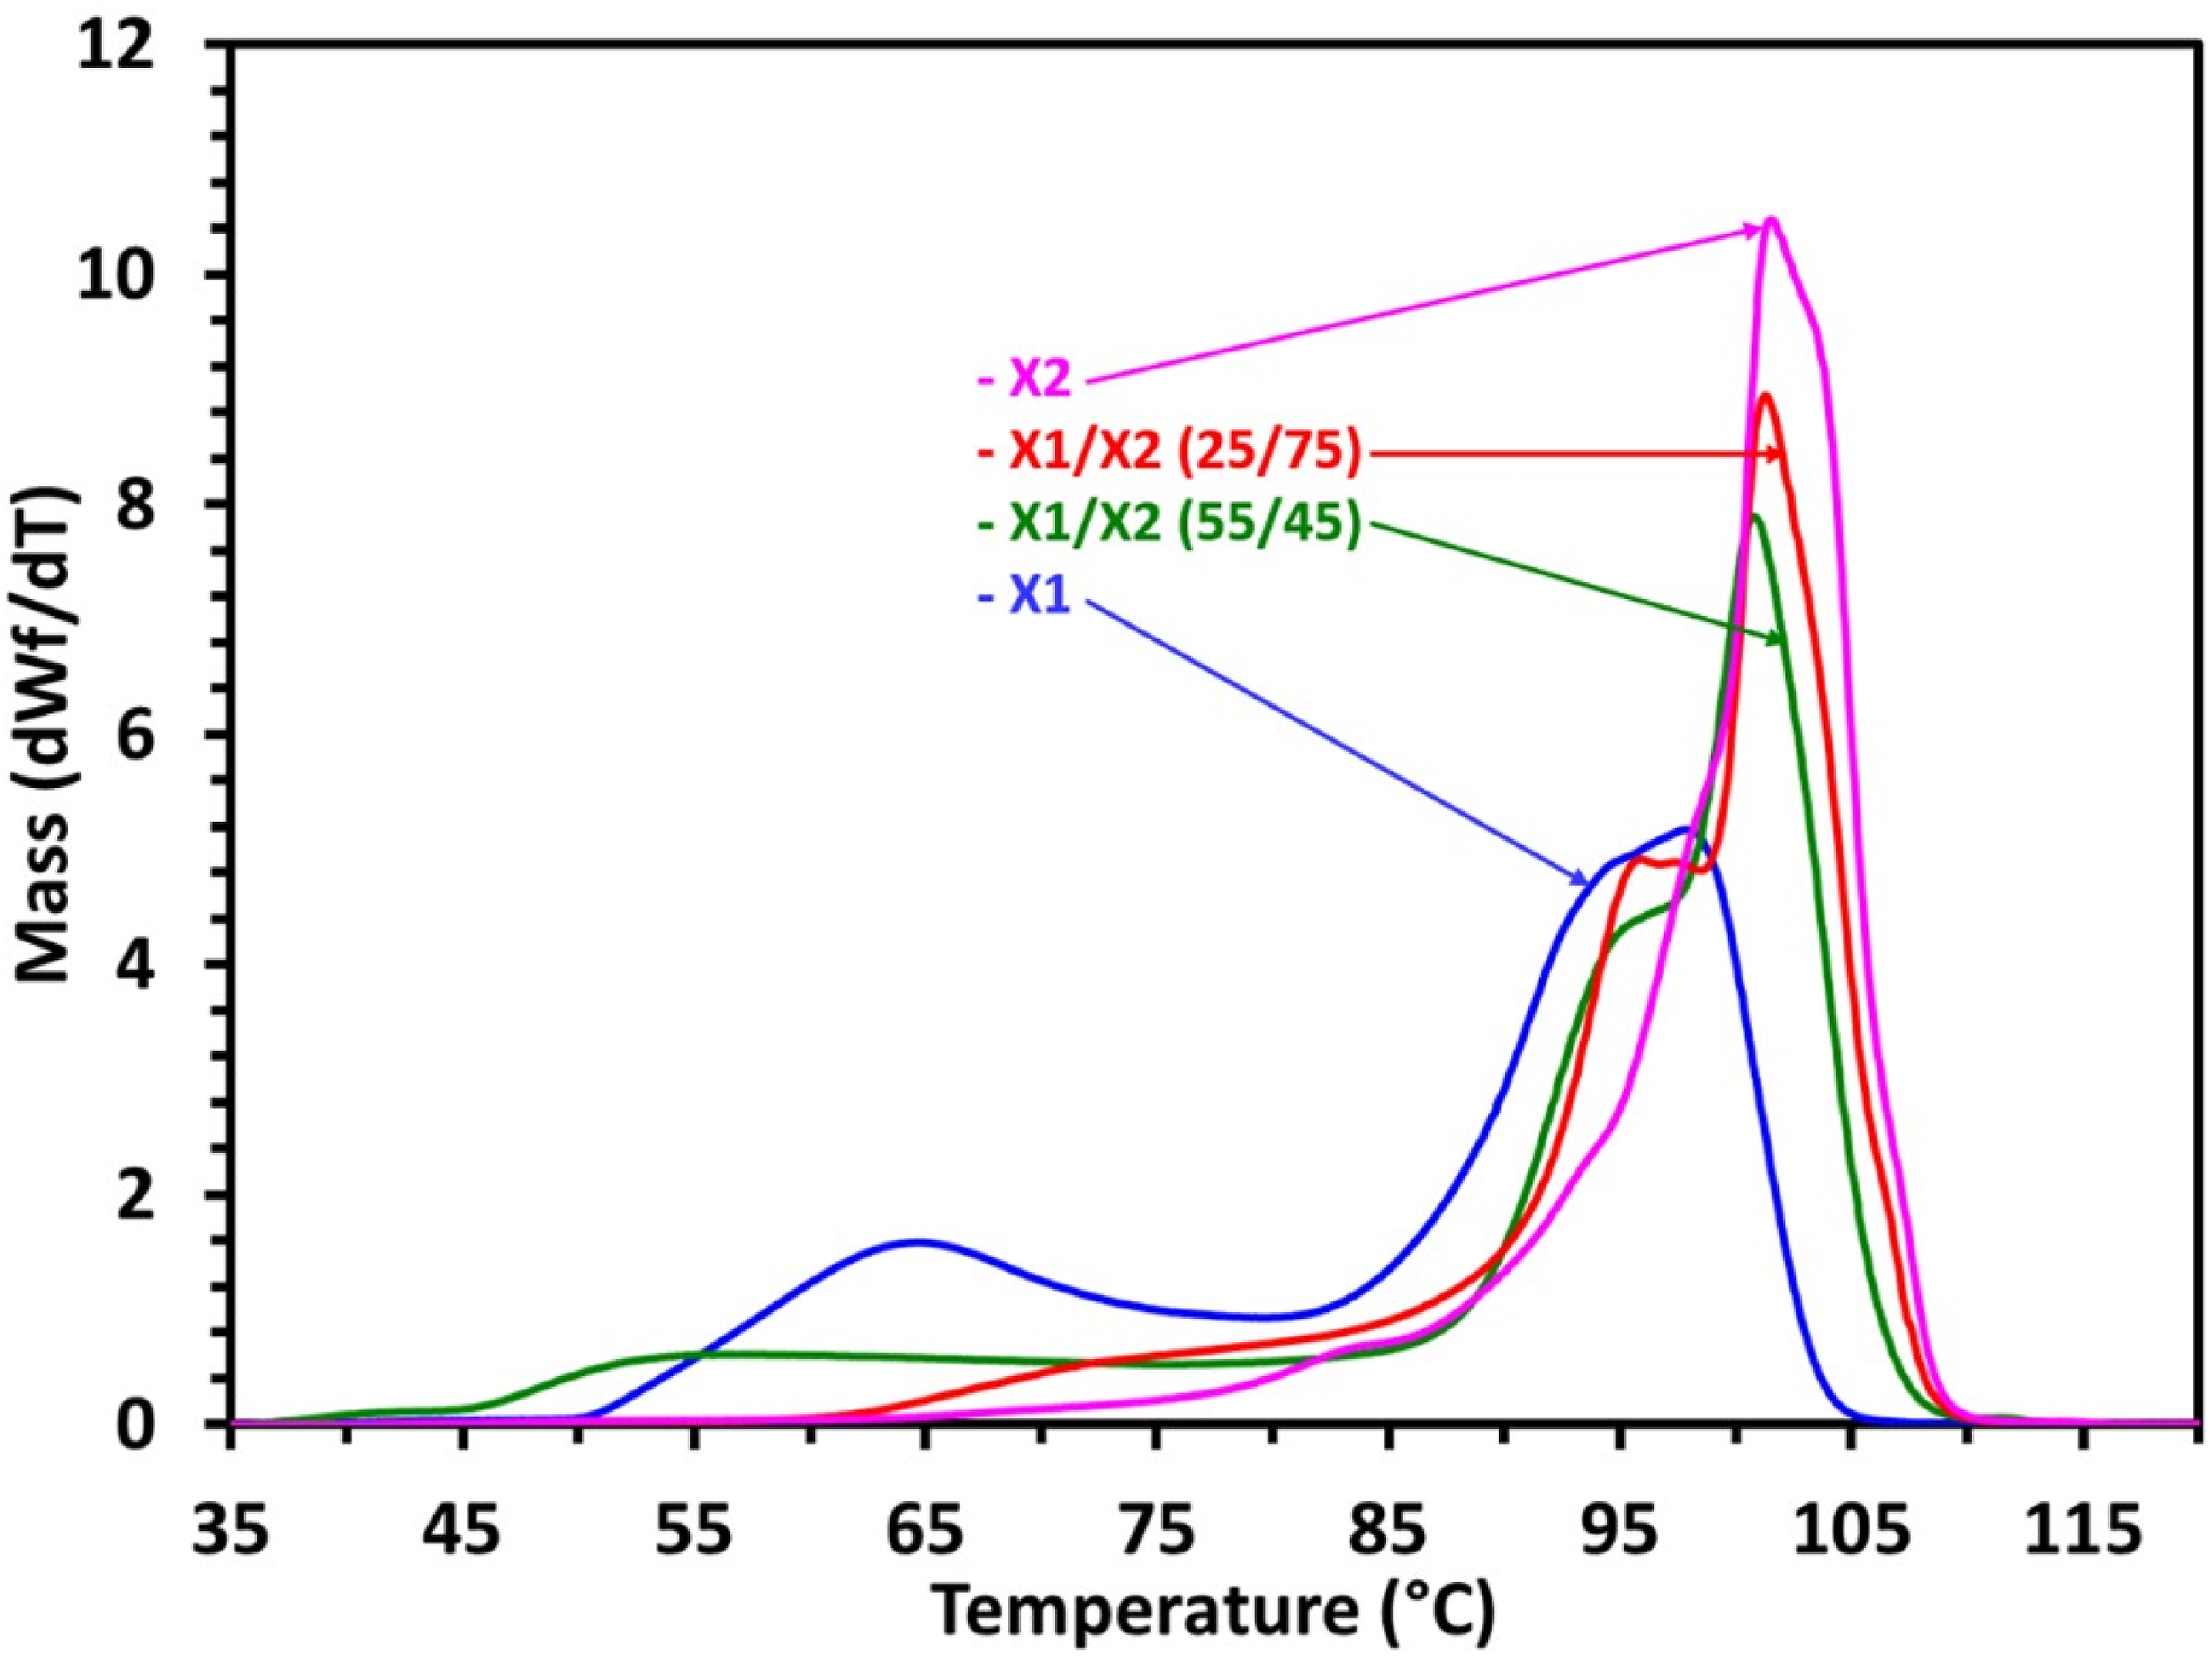
Rheological characterization
The DMS linear viscoelastic property trends were consistent with the resin composition and measured MI. Figure 9 presents the relationship between complex viscosity and frequency at 190°C. At low frequencies, the viscosity curves are inversely related to the MI and follow known power-law scaling behavior with respect to the average molecular weight.51,52 The shear thinning behaviour of the D-series (D1, D2, D3) and X1 is comparable, reflecting their similar polydispersity (between 3.9 and 4.7). In contrast, resin X2, with the highest polydispersity (10.9), exhibits markedly more pronounced shear thinning behaviour, approaching D3, which has the lowest weight-average molecular weight, at higher frequencies. The linear viscoelasticity results can be comprehensively explained by the molecular structure related to the molecular weight distribution. Base resin flow curves at 190°C with their respective indicated MI.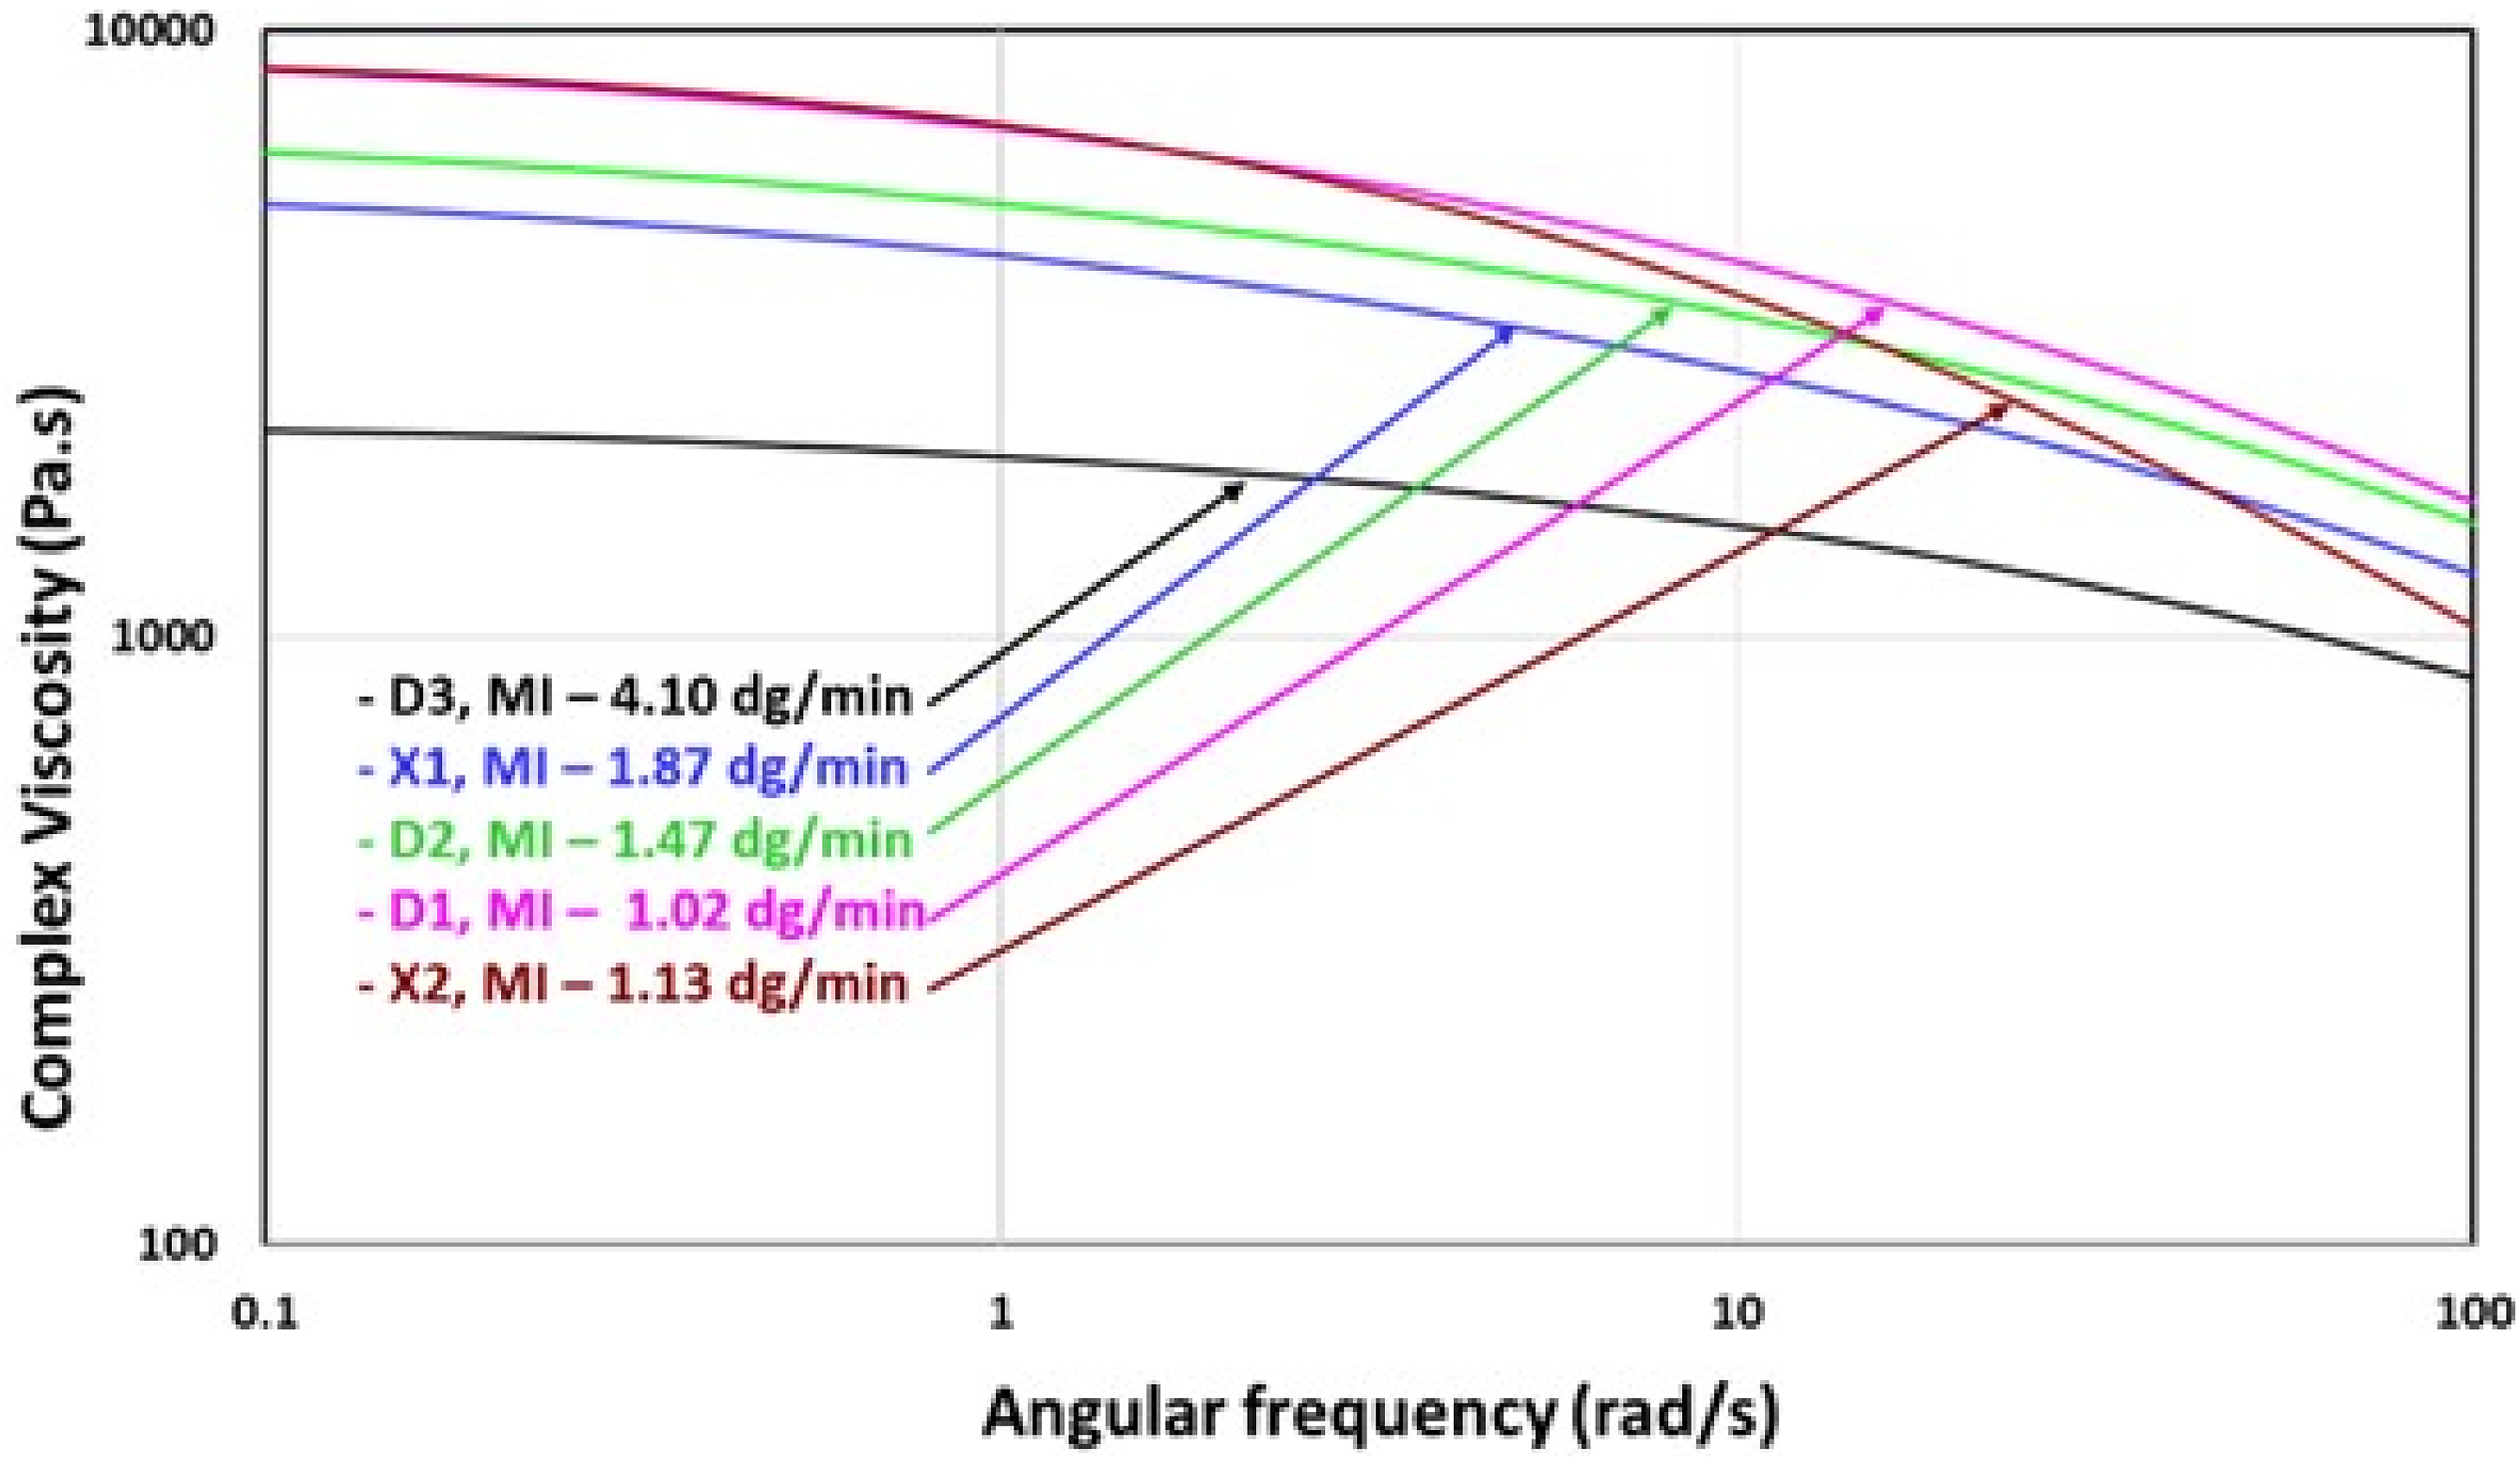
Thermal properties of the blown films from blends
DSC analysis provides additional insights into the blown film crystallinity. Figure S1 in the supplemental information shows the DSC traces for base PE resins X1, X2, D1, D2, D3. Figure 10(a) shows the 1st heat DSC melting curves for the blown films made from 25 wt% X1 in the blends. The melting enthalpy and % crystallinity was highest for the X1/X2 (25/75) blend (211.3 J/g, 72 %), while the X1/D2 (25/75) and X1/D3 (25/75) showed similar values (178.3 J/g, 61 % and 184.9 J/g, 63 %). This aligns with predicted density trends: indeed, both density and melting enthalphy depends on the crystalline fraction. The peak melting temperature followed a similar pattern. DSC melting curves for 1st heating cycle (Endo up) along with their enthalpy of melting and peak melting temperature for the blown films from X1 blends with D2, D3 and X2 (a) at constant 25% weight percentage X1, and (b) at constant density.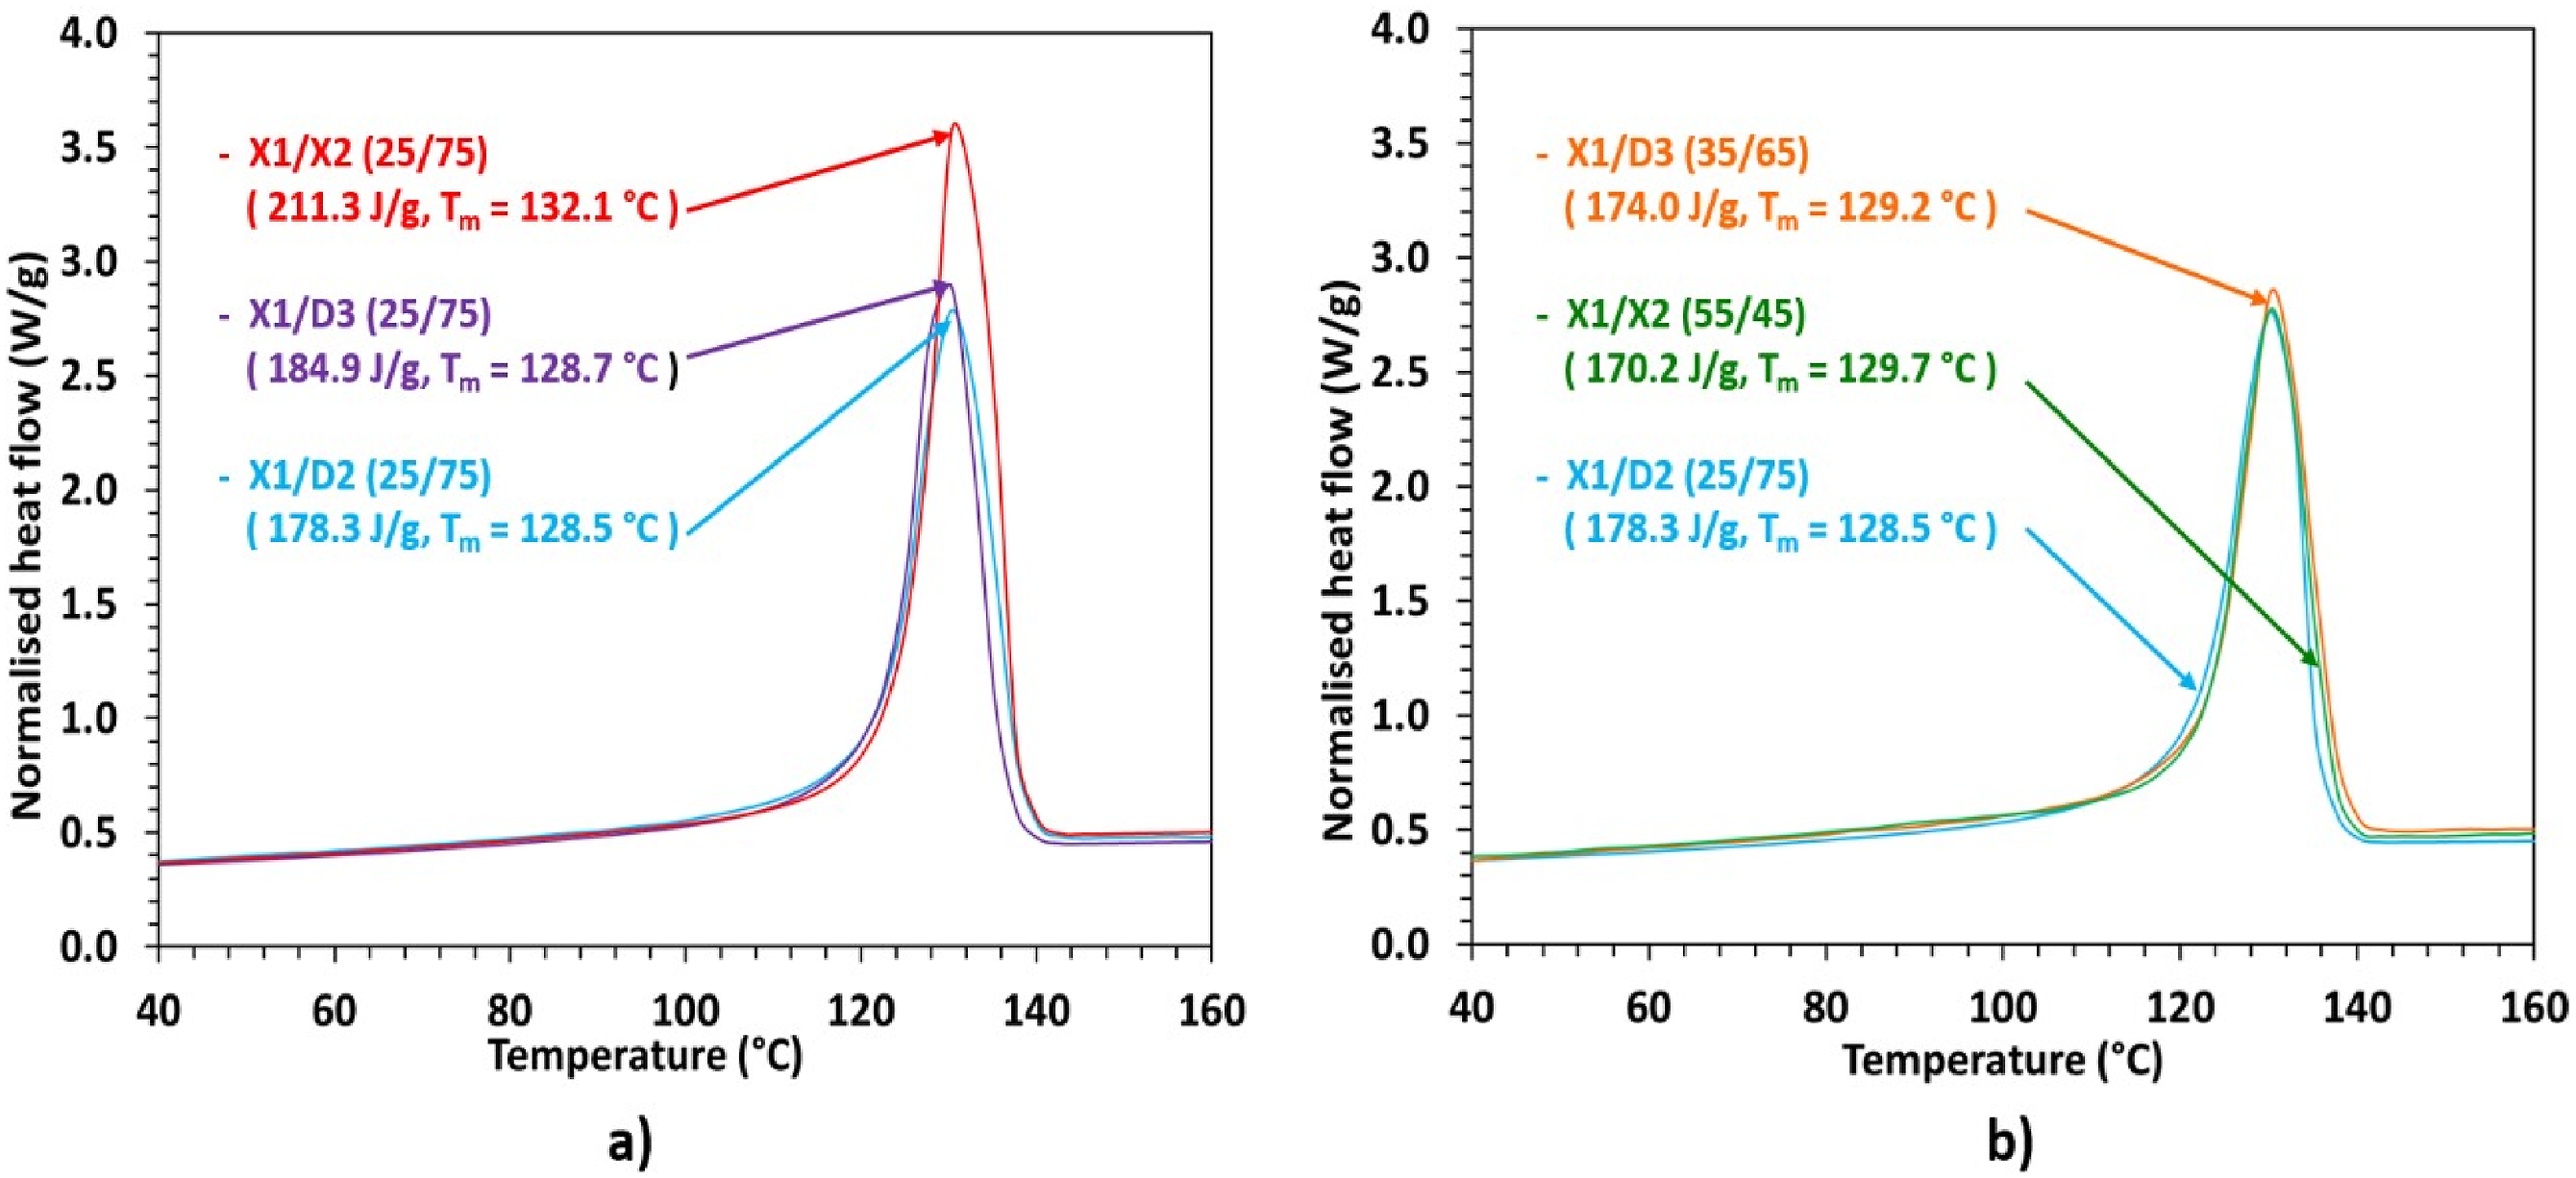
Figure 10 (b) shows that the enthalpy of melting and percent crystallinity are similar for all three blends, in alignment with the constant target density within this series. Only subtle differences were found with the lowest enthalpy and crystallinity observed for X1/X2 (55/45) (170.2 J/g, 58%). This outcome was in line with the higher comonomer content in the X1/X2 (55/45) microstructure compared to X1/D3 (35/65) and X1/D2 (25/75), due to the higher low-density X1 weight percent. The higher comonomer content in the microstructure hinders growing thicker lamella. 14
Material properties
Tensile properties of blown films of all five base resins used in the study
Figures 11 and 12 present the machine direction (MD) and transverse direction (TD) tensile properties for blown films for base resins. MD and TD modulus versus density for blown films from the base resins. Tensile stress and Tensile strain at yield versus density for base resin blown films; (a) stress at yield, (b) strain at yield.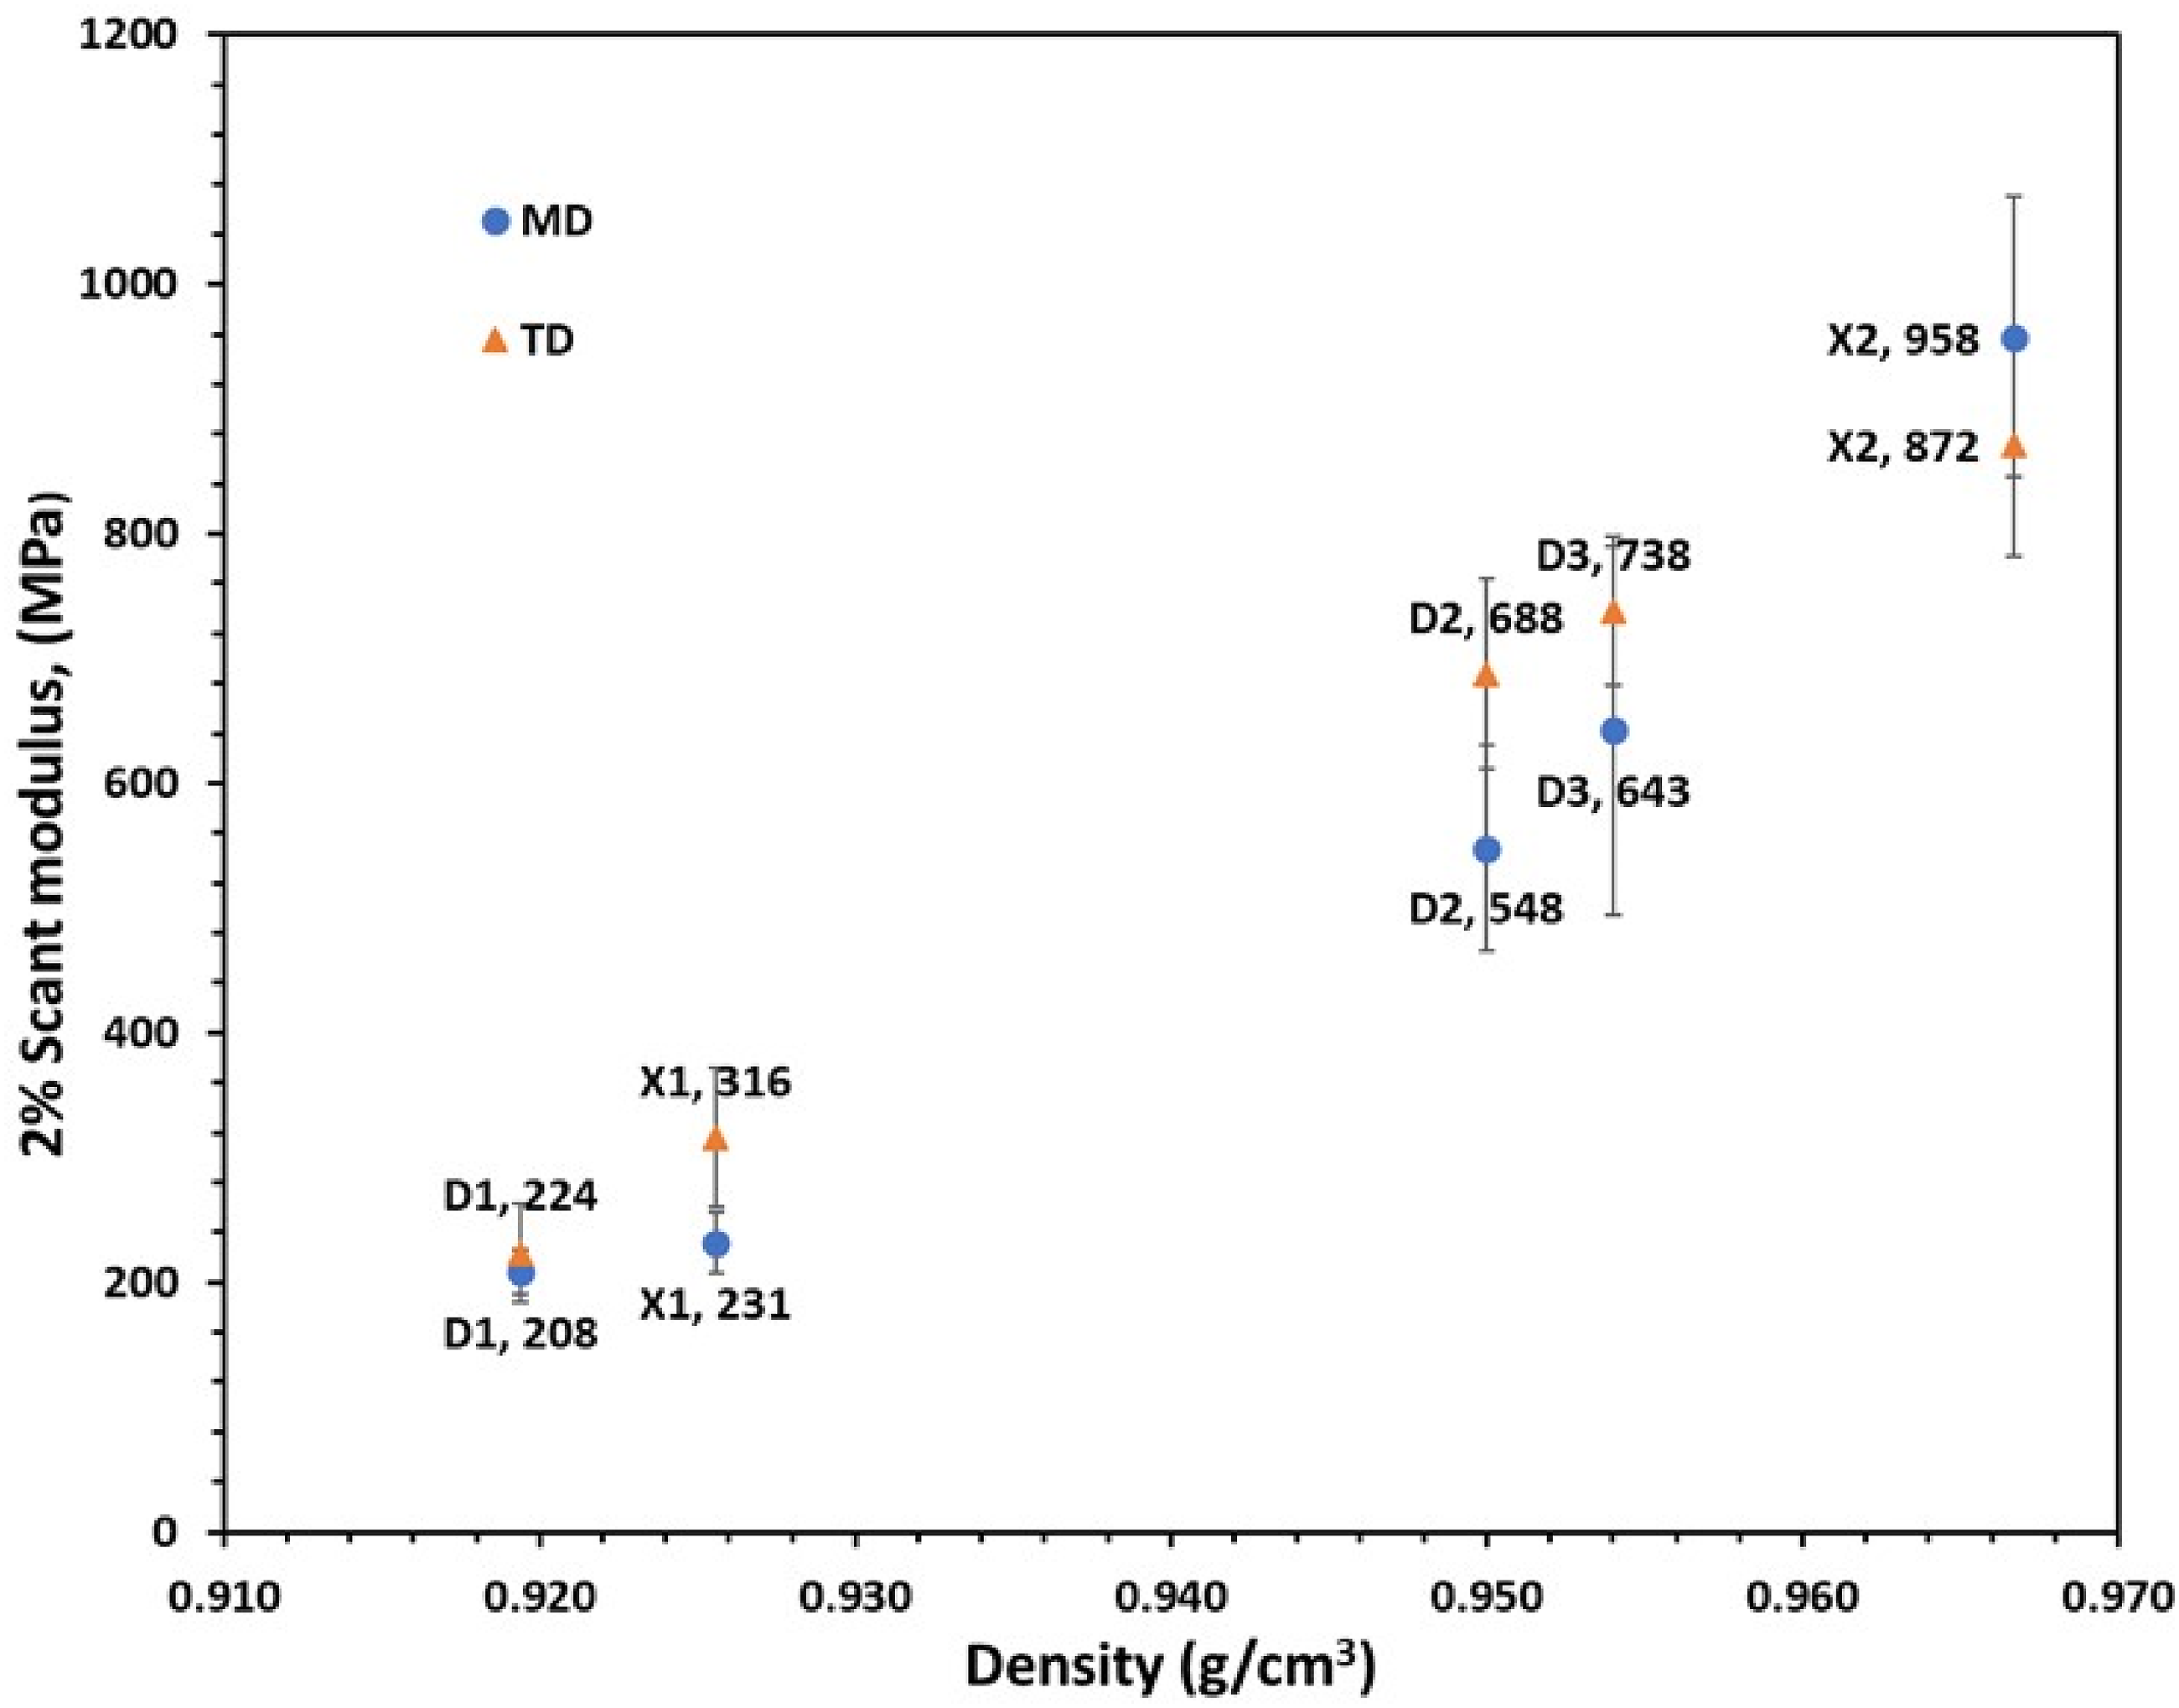
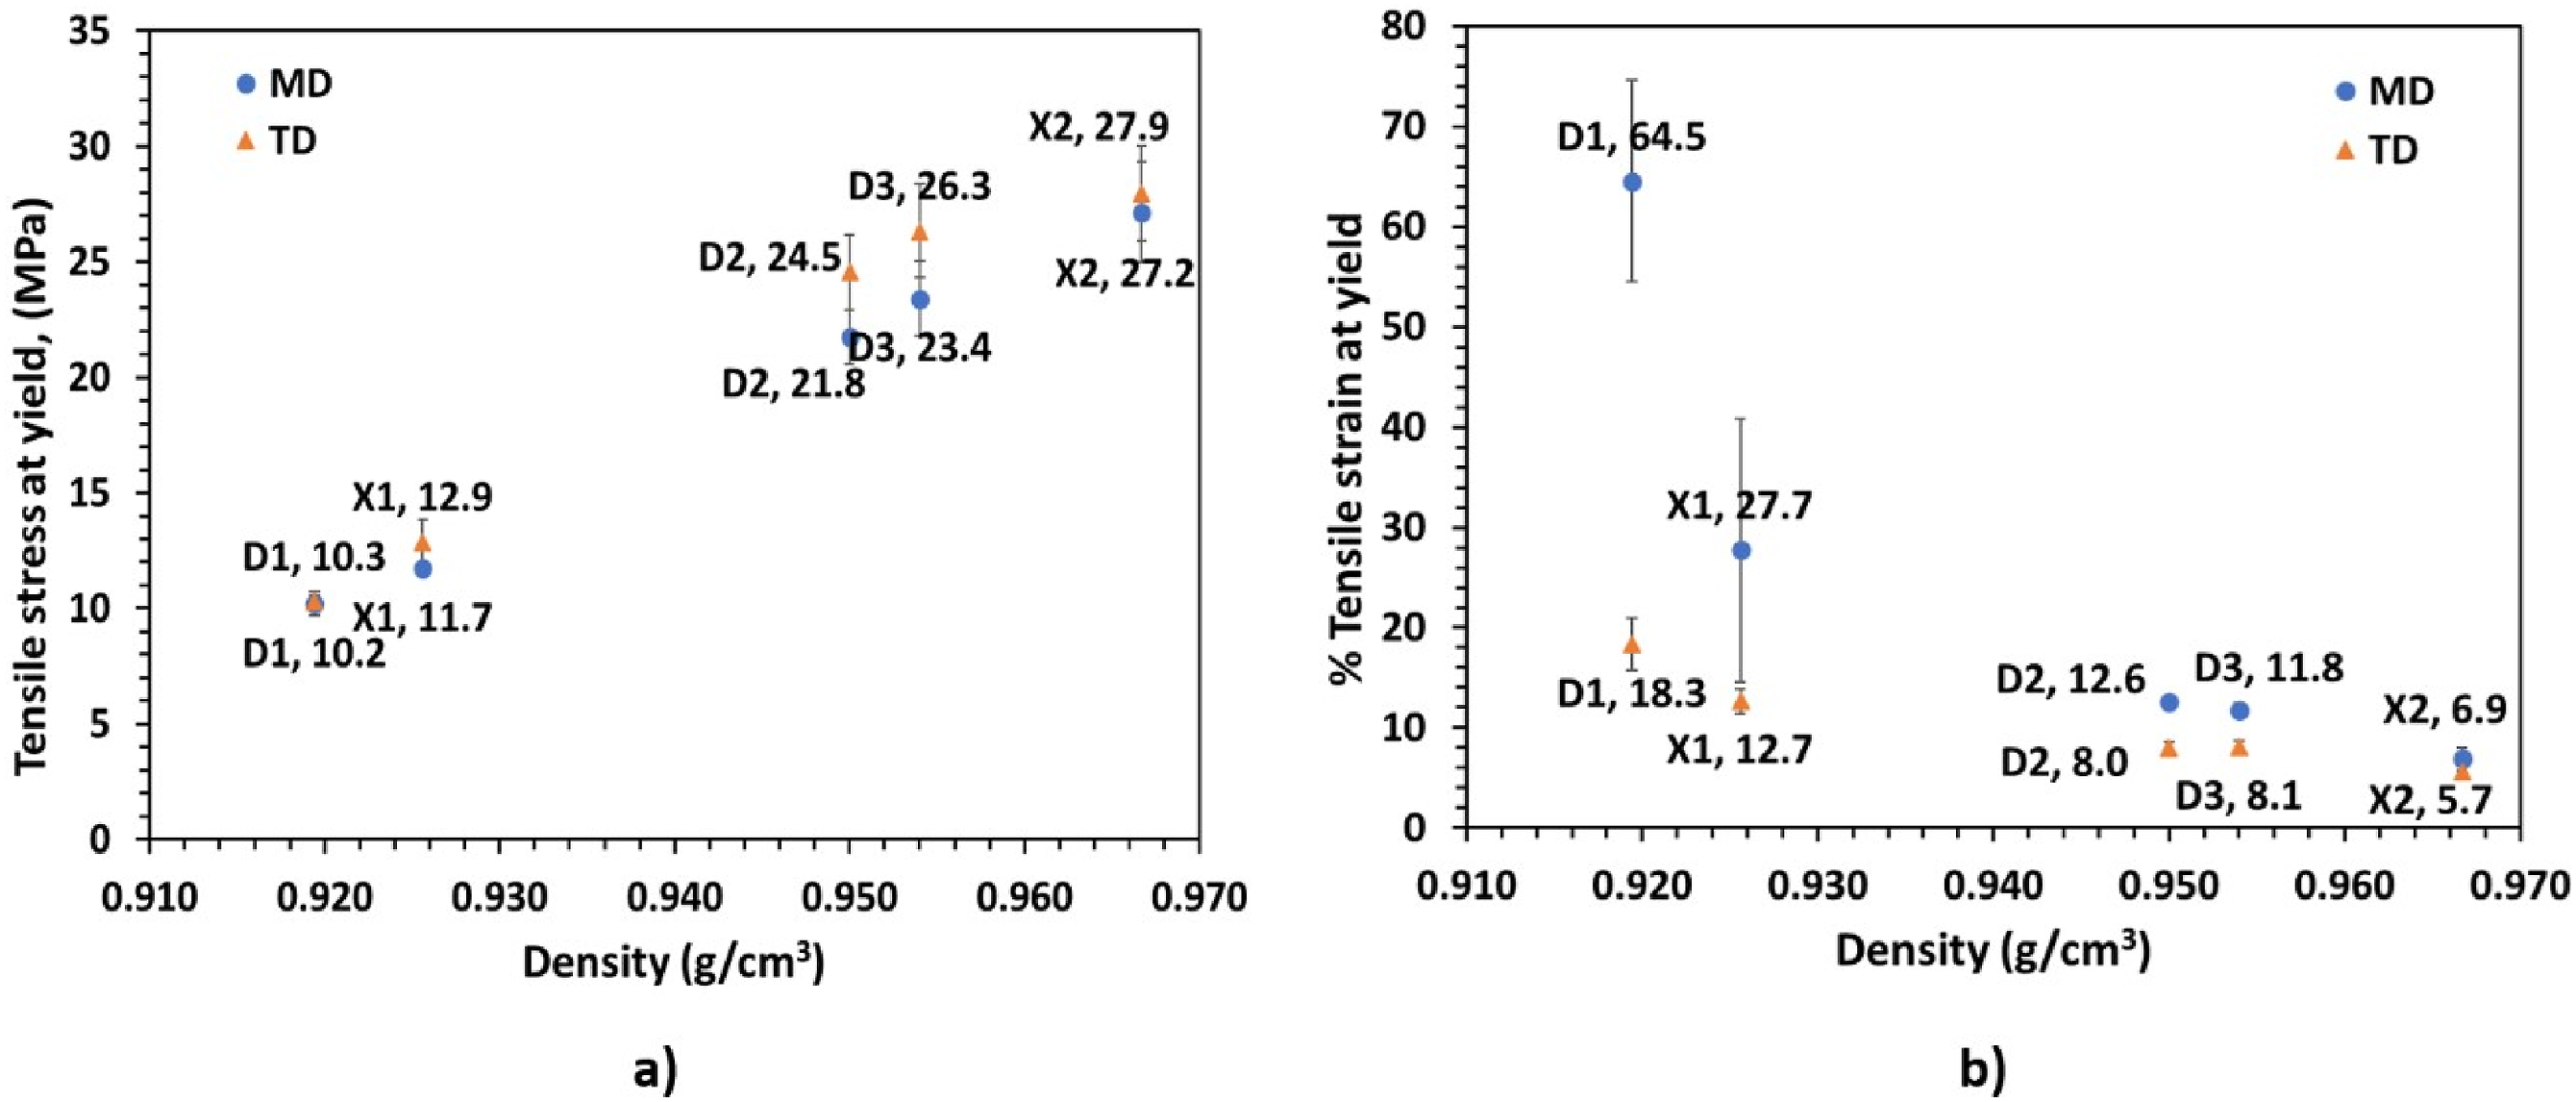
The tensile data shows that higher density blown films exhibited higher modulus and stress at yield in both MD and TD (Figures 11 and 12(a)). This is due to an increased crystallinity with increasing density. Specifically, the highest modulus and yield stress in both MD and TD were for the blown film with the highest density resin, X2 (0.967 g/cm³), while the lowest values were for the blown film with the lowest density resin, D1 (0.919 g/cm³). In contrast, the percent strain at yield (Figure 12(b)) decreased with increase in density in both MD and TD as expected due to decreasing amorphous fractions in the microstructure with increasing density.
Molecular architecture effects on MDO-PE film tensile modulus
Subsequently, the modulus was examined as a function of draw ratio and resin architecture. Particular attention was placed on the effect of molecular weight and results were presented for blown films of blends in which large variations in density were minimized compared to the base resin blown films.
As mentioned earlier, to understand the effect of molecular weight and molecular weight distribution and their interaction with MDO process draw ratio, lower-density PE resin X1 was blended at 25 wt% with three relatively high-density PE resins of different molecular architectures: D2, D3, and X2. The measured octene comonomer content was very similar (2.67, 2.75 and 2.57%) for these three blends. Figure 13 shows that in all three cases, an exponential-like increase in machine direction (MD) modulus was observed with increasing MDO draw ratio. The highest increment at each draw ratio was achieved for the X1/X2 (25/75) blend, with about 4000 MPa at 6 MDX. This high modulus increase can be attributed to two main factors. First, the X1/X2 (25/75) blown film had the highest density (0.9561 g/cm3), leading to improved disintegration and fibrillation of relatively larger crystals with less partial melting at the orientation temperature, facilitating amorphous phase alignment and strain-induced crystallization. Second, the blend contained more low-molecular-weight material shown by its 9.1 polydispersity which was the highest among the blends examined (Table 3 and Figure 4(a)). This resulted in localized deformation, contributing to a higher natural draw ratio, as evidenced by the narrower lay-flat width after stretching shown in Figure 13. 2% Secant Modulus versus Process Draw Ratio (MDX) for 25 wt% X1 blends and MDO film lay flat width (mm) at 6 MDX. (roller speed before MDO oven: 1.6 m/min) Note: Process draw ratio one represents blown film before MDO operation.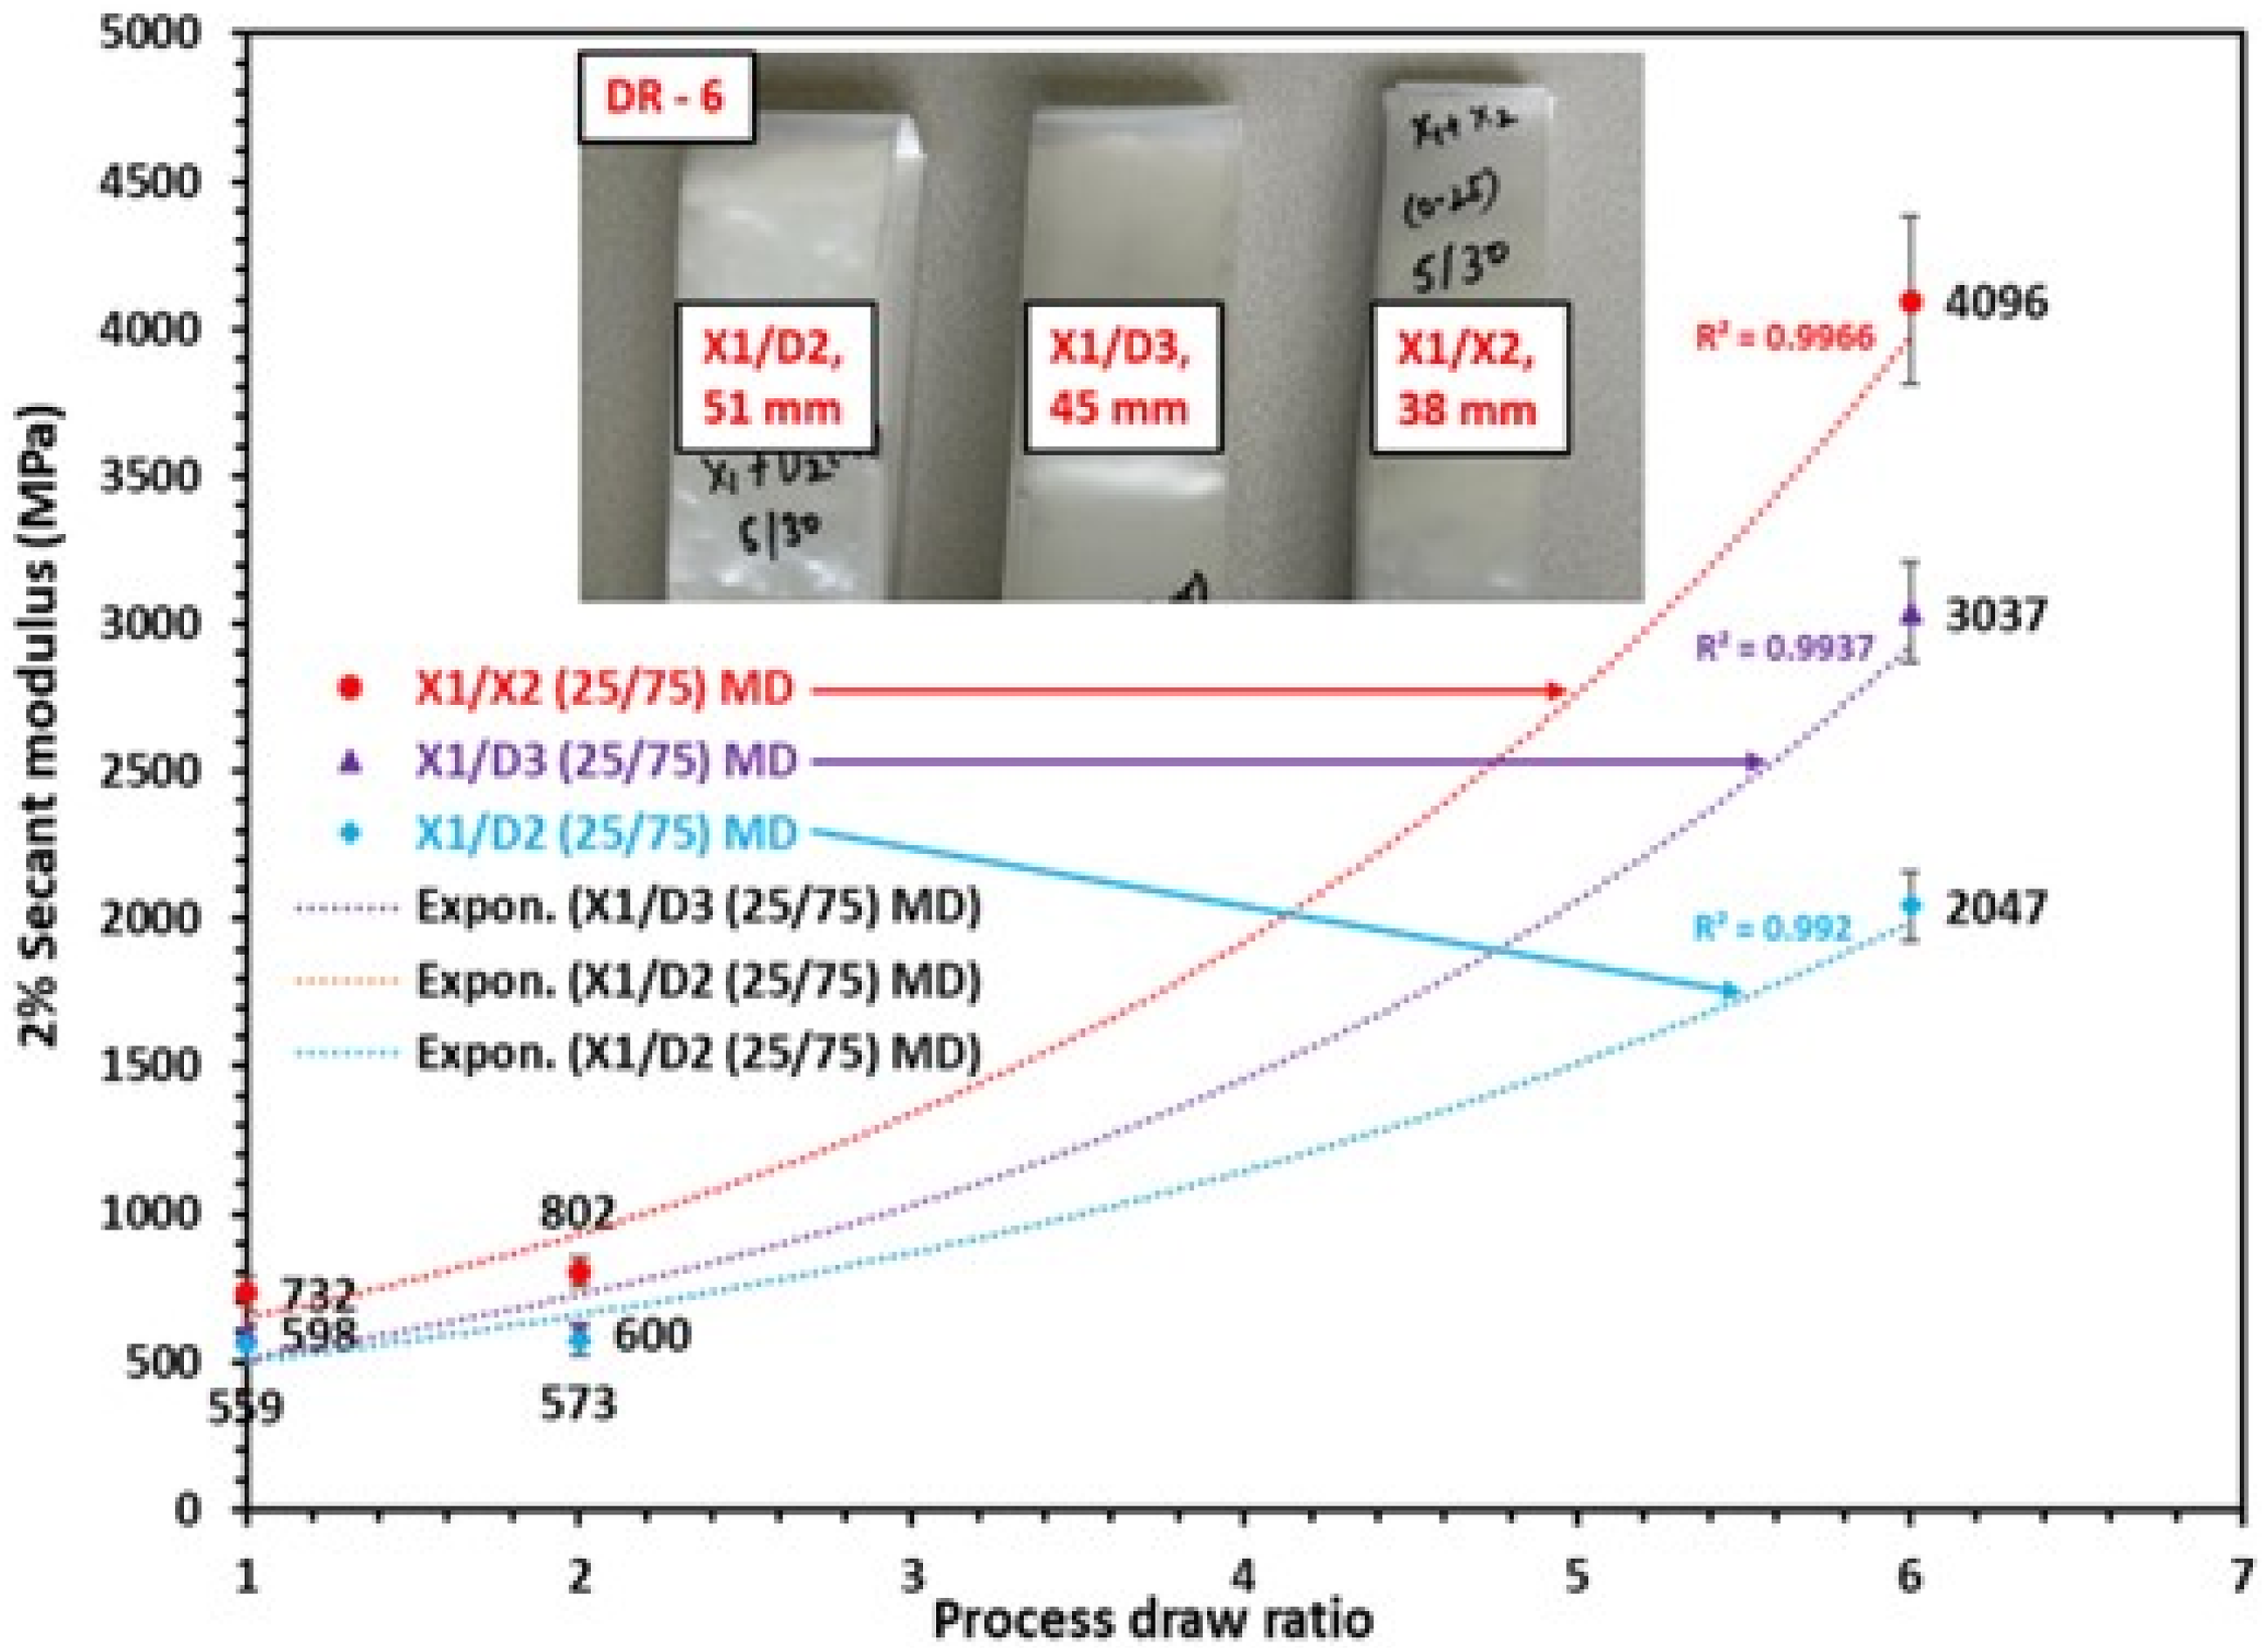
For the almost equal density blends that is, the 0.9438 g/cm3 X1/D2 (25/75) and the 0.9467 g/cm3 X1/D3 (25/75), we observed that the X1/D3 blend modulus was higher at higher process draw ratios, than the X1/D2 blend. A marginally higher X1/D3 (25/75) MDO film modulus at highest process draw ratio of six versus the X1/D2 (25/75) MDO film was anticipated due to its slightly higher density. However, the significantly larger observed difference was unexpected and atypical (Figure 14(b)). A possible explanation is that the X1/D3 (25/75) blown film contained higher low-molecular-weight material (Table 3 and Figure 4(a)) in addition to its slightly higher density, therefore it showed a higher natural draw ratio and comparatively more localized deformation during MDO stretching compared to the X1/D2 (25/75) blown film. This resulted in higher X1/D3 (25/75) film microstructure alignment in the draw direction during MDO, leading to higher MD modulus at higher process draw ratios. Consequently, the X1/D3 (25/75) film exhibited a narrower lay-flat width at the highest process draw ratio (Figure 13), attributed to its higher natural 9.1 draw ratio, compared to 6.6 for the X1/D2 (25/75) blend, (see Table 5). 2% Secant modulus for 25 wt% X1 blends vs (a) weight average molecular weight (M
w
), (b) Density and (c) Polydispersity Calculated natural draw ratio for 25 wt% X1 blown films of blends at 6 MDX.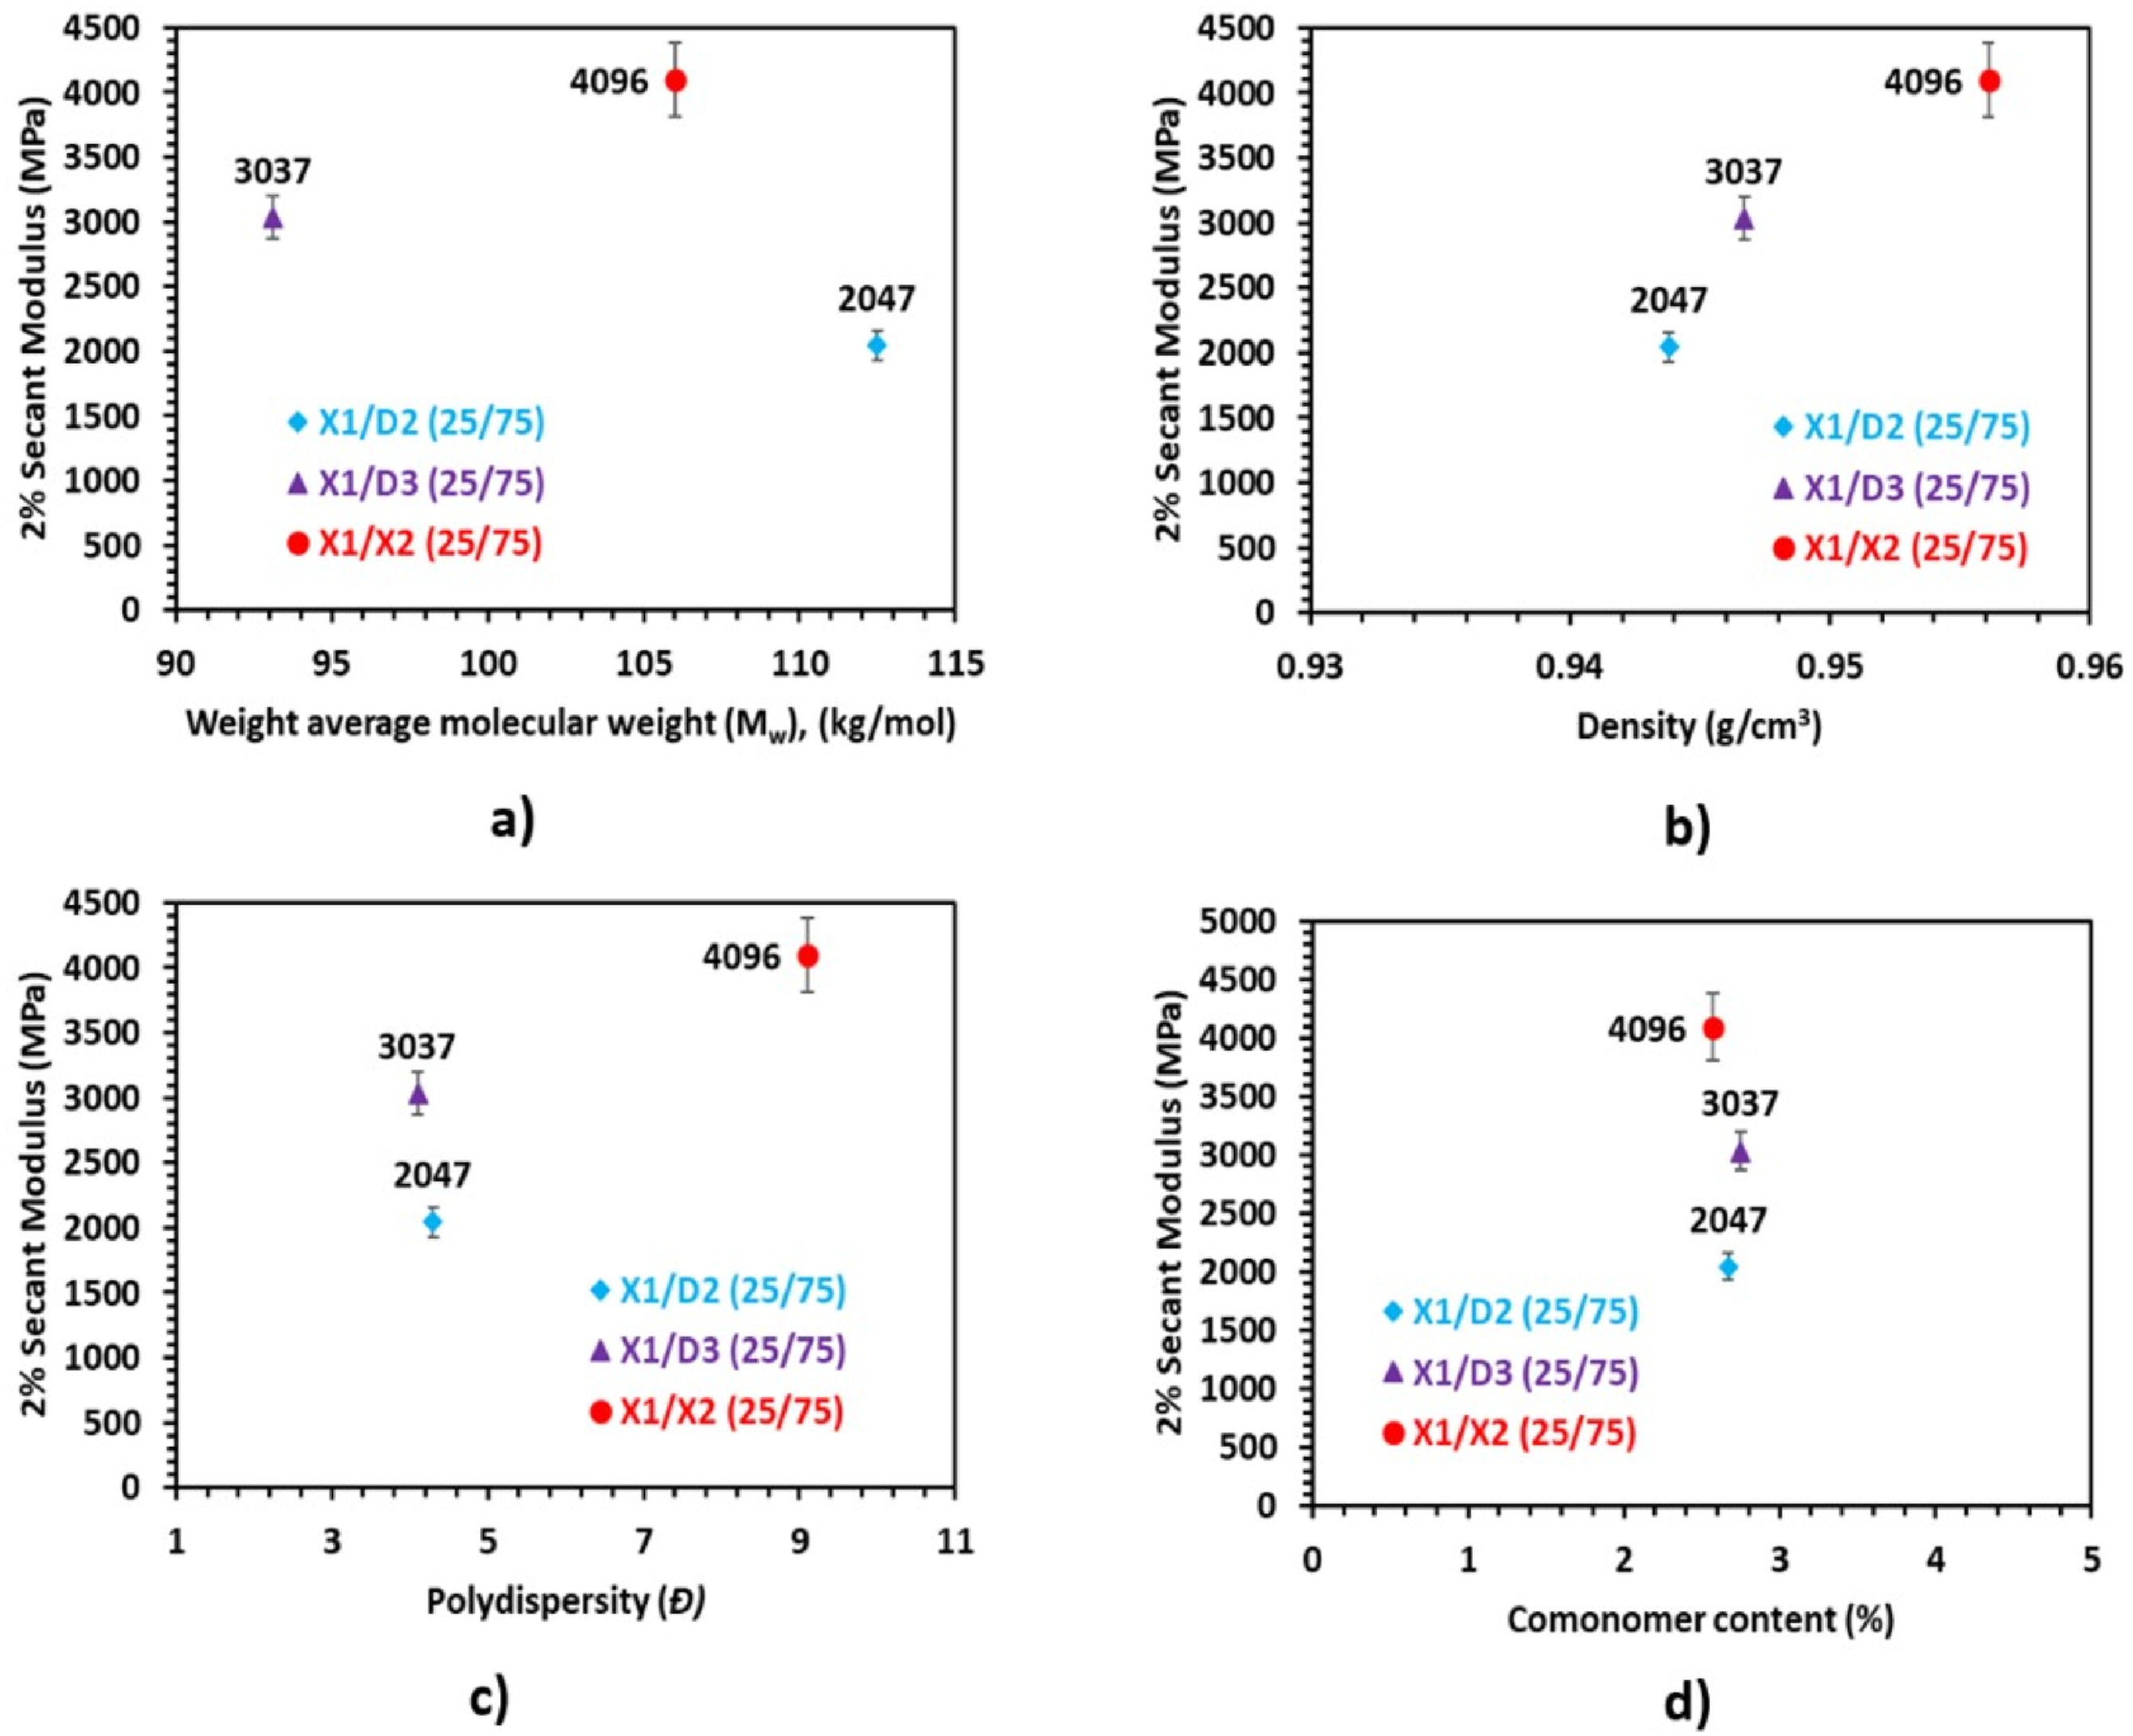
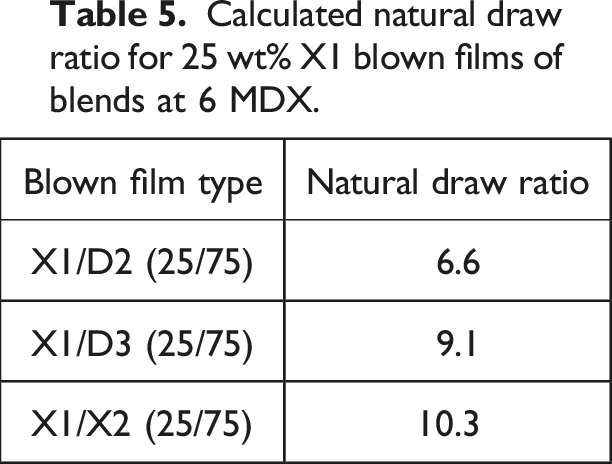
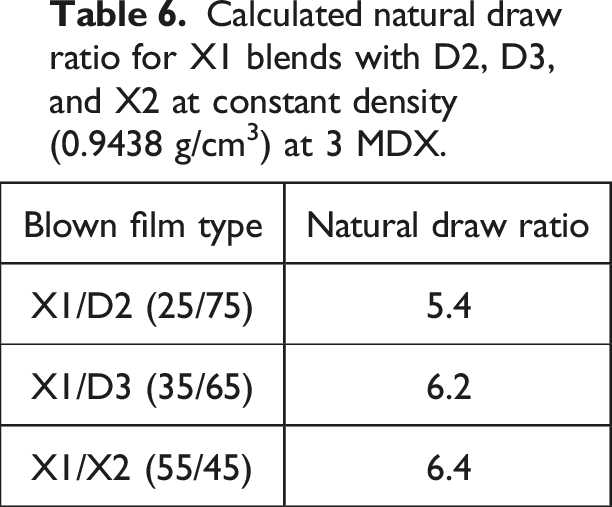
Figure 15 shows 2% Secant Modulus versus Process Draw Ratio (MDX) for the similar density blends, where the X1 weight percentage was altered to 35% and 55% in D3 and X2 blends to match the X1/D2 blend density (0.9438 g/cm3). Notably, the modulus change versus MDX differed from that in Figure 13 with all three blends having closer natural draw ratios (Table 6) at the maximum possible 3X process draw ratio. While the increased modulus is comparable for the X1/D2 (25/75) and X1/D3 (35/65) blown films, the X1/X2 (55/45) blown film shows the least increase at the maximum possible 3X process draw ratio among the three blown films of blends. From the GPC results (see Figure 4(b) and Table 3), we learned that the 5.55% octene comonomer content was highest for the X1/X2 (55/45) blown film, followed by 3.68% for X1/D3 (35/65), and the lowest at 2.67% for X1/D2 (25/75) blend. Li et al.
15
teaches us that copolymers with lower octene content present higher crystallinity and larger crystals, which undergo lamellar fragmentation during stretching. Subsequently, crystallinity increases due to strain-induced crystallization, resulting in overall high lamellar orientation. Numerous previous researchers have also demonstrated that the increased comonomer content reduces the crystallization of the microstructure and its ability to form larger crystals,15,53,54 as also indicated in our study by the DSC curves in Figure 10(b) and iCCD curves in Figure 7(b), which further leads to a decrease in strain induced crystallization during stretching and overall orientation of the microstructure. Therefore, an explanation for the contrasting results presented in Figure 15 is that the larger crystal sizes formed in the blown film prior to stretching because of relatively lower comonomer content facilitates strain-induced crystallization and amorphous region orientation during MDO, leading to higher modulus. 2% Secant Modulus versus Process Draw Ratio for blown films from X1 with D2, D3, and X2 blends at constant density (0.9438 g/cm3). (roller speed before MDO oven: 3.1 m/min) Note: Process draw ratio of one represents blown film before MDO operation. Calculated natural draw ratio for X1 blends with D2, D3, and X2 at constant density (0.9438 g/cm3) at 3 MDX.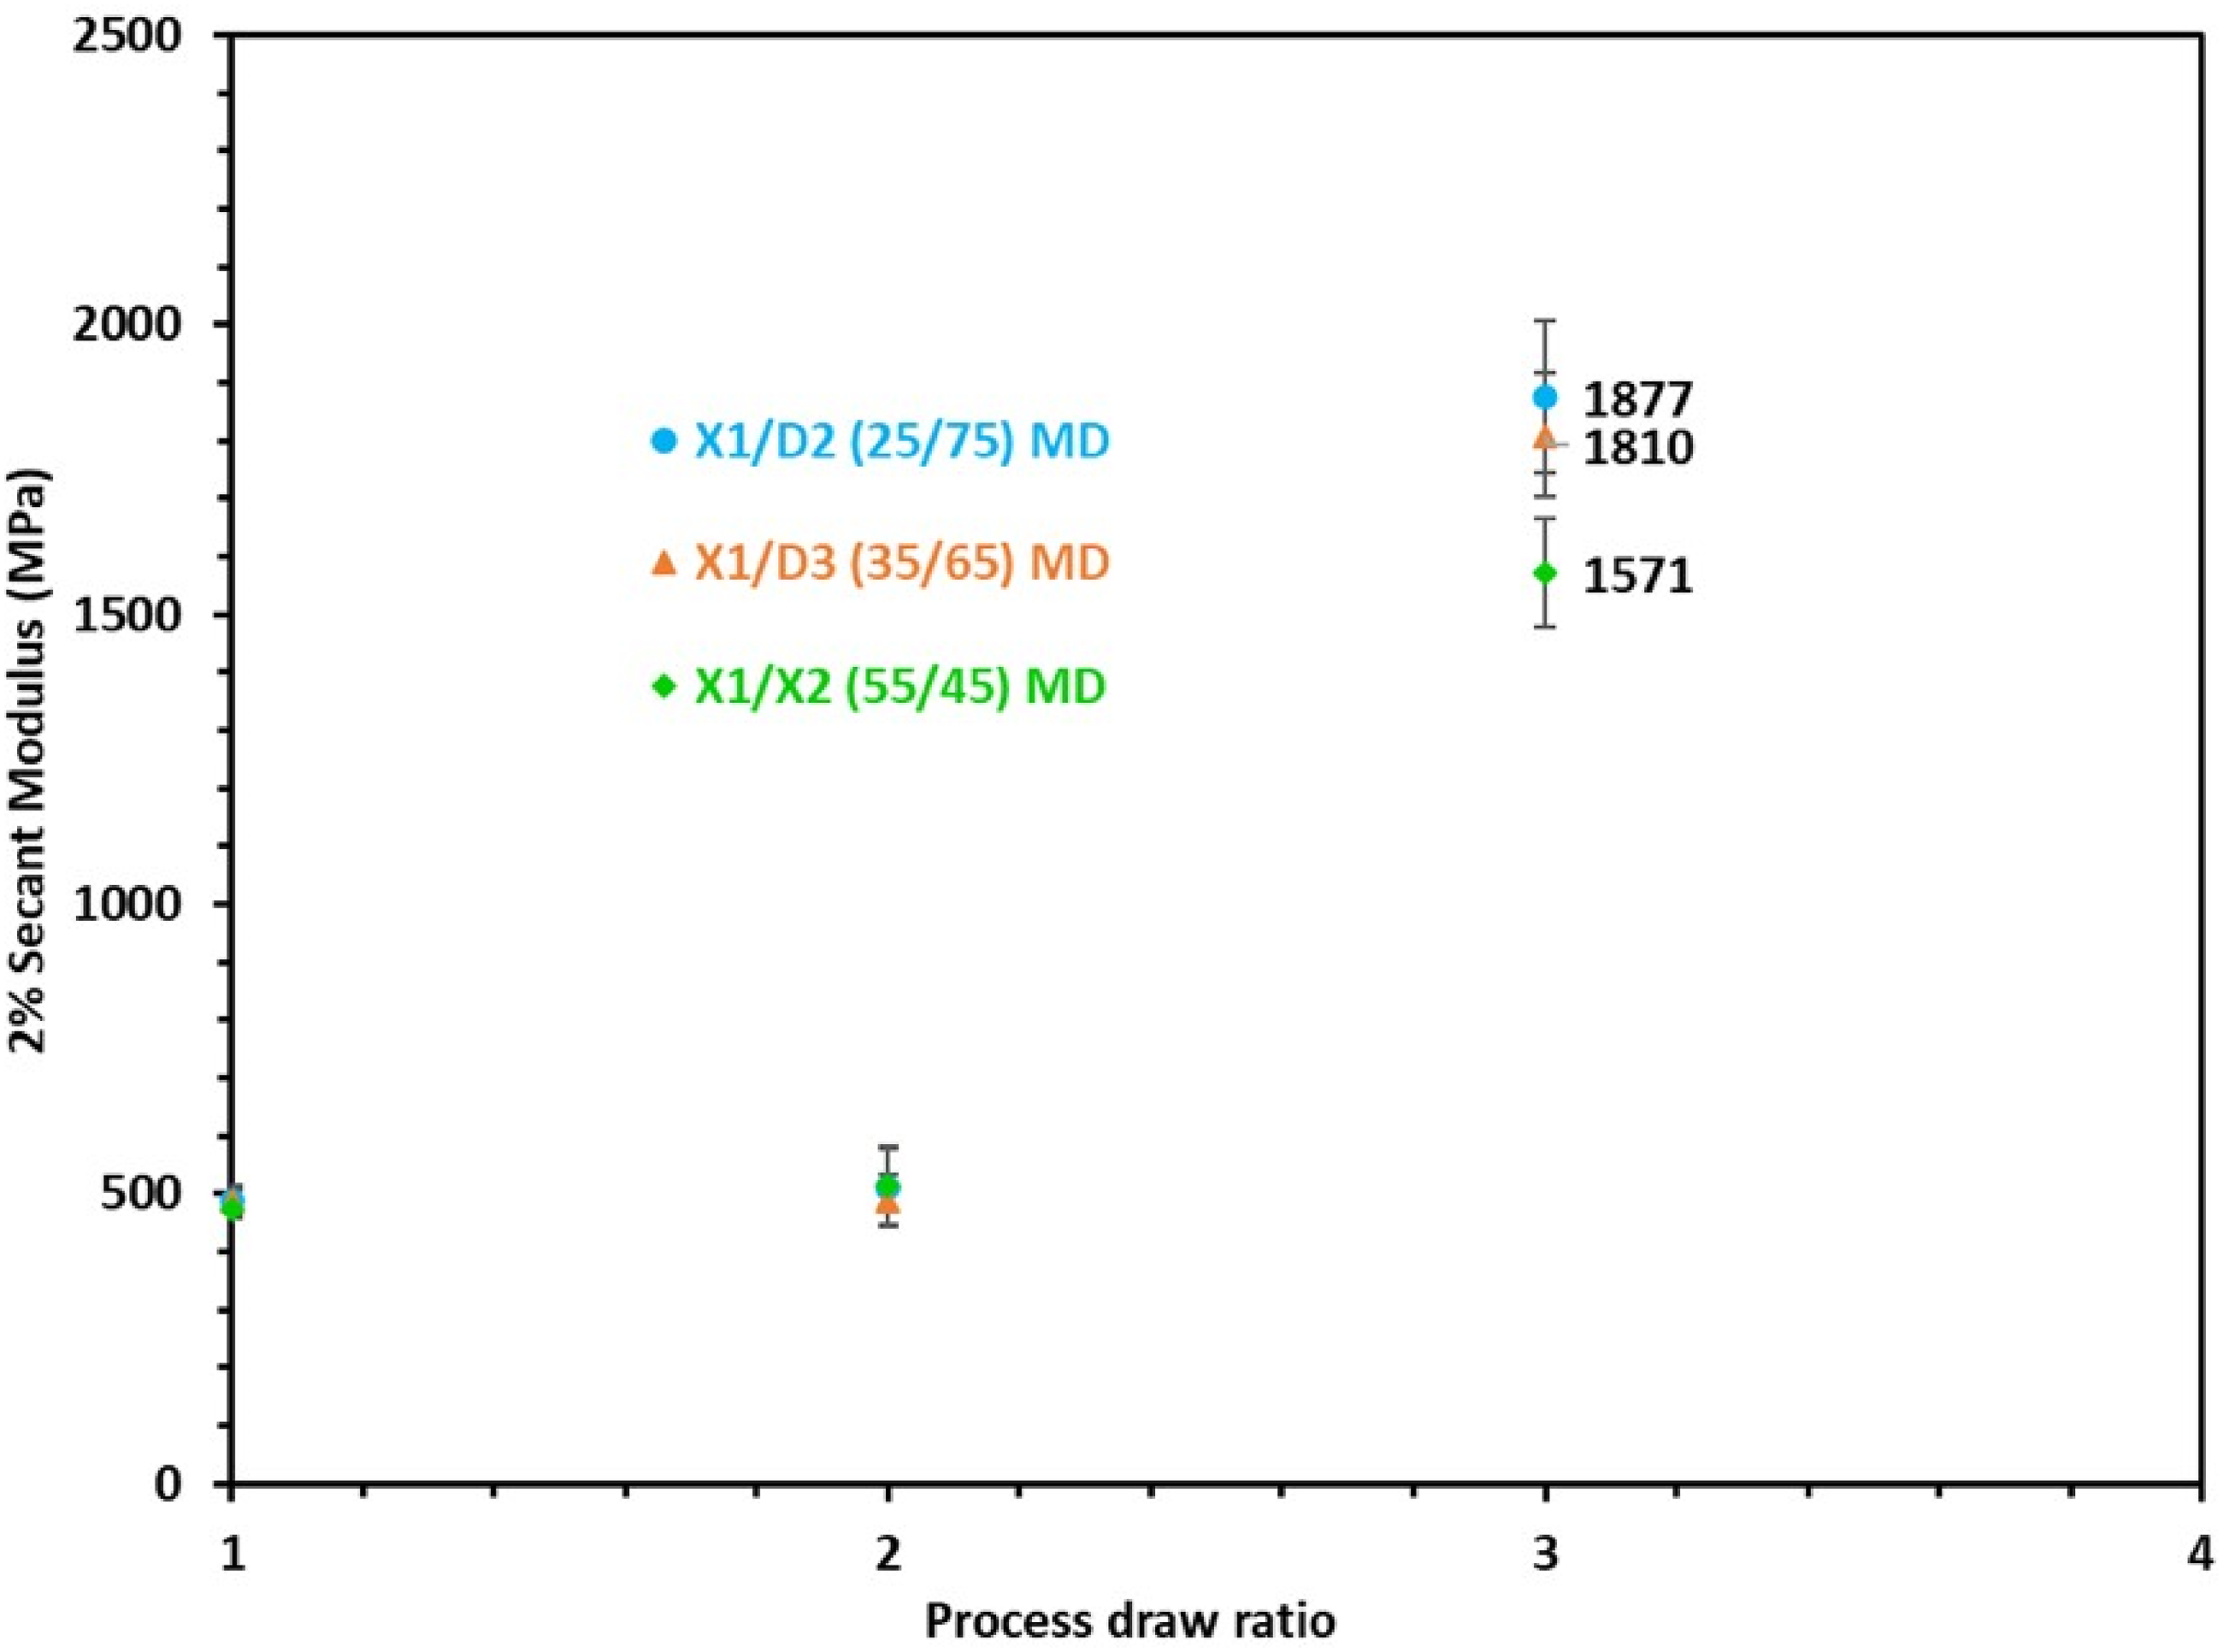
Process draw ratio effects on MDO-PE film tensile modulus
The X1 blown film was stretched at 2, 6 and 13.33 process draw ratios to further analyse how the process draw ratio affects tensile properties. Figure 16 shows an exponential-like increase in MD modulus with increased draw ratio. 2% Secant Modulus versus Process Draw Ratio (MDX) for X1 resin along with pictorial representation at used process draw ratios. (roller speed before MDO oven: 0.9 m/min) Note: Process draw ratio one represents blown film before MDO operation.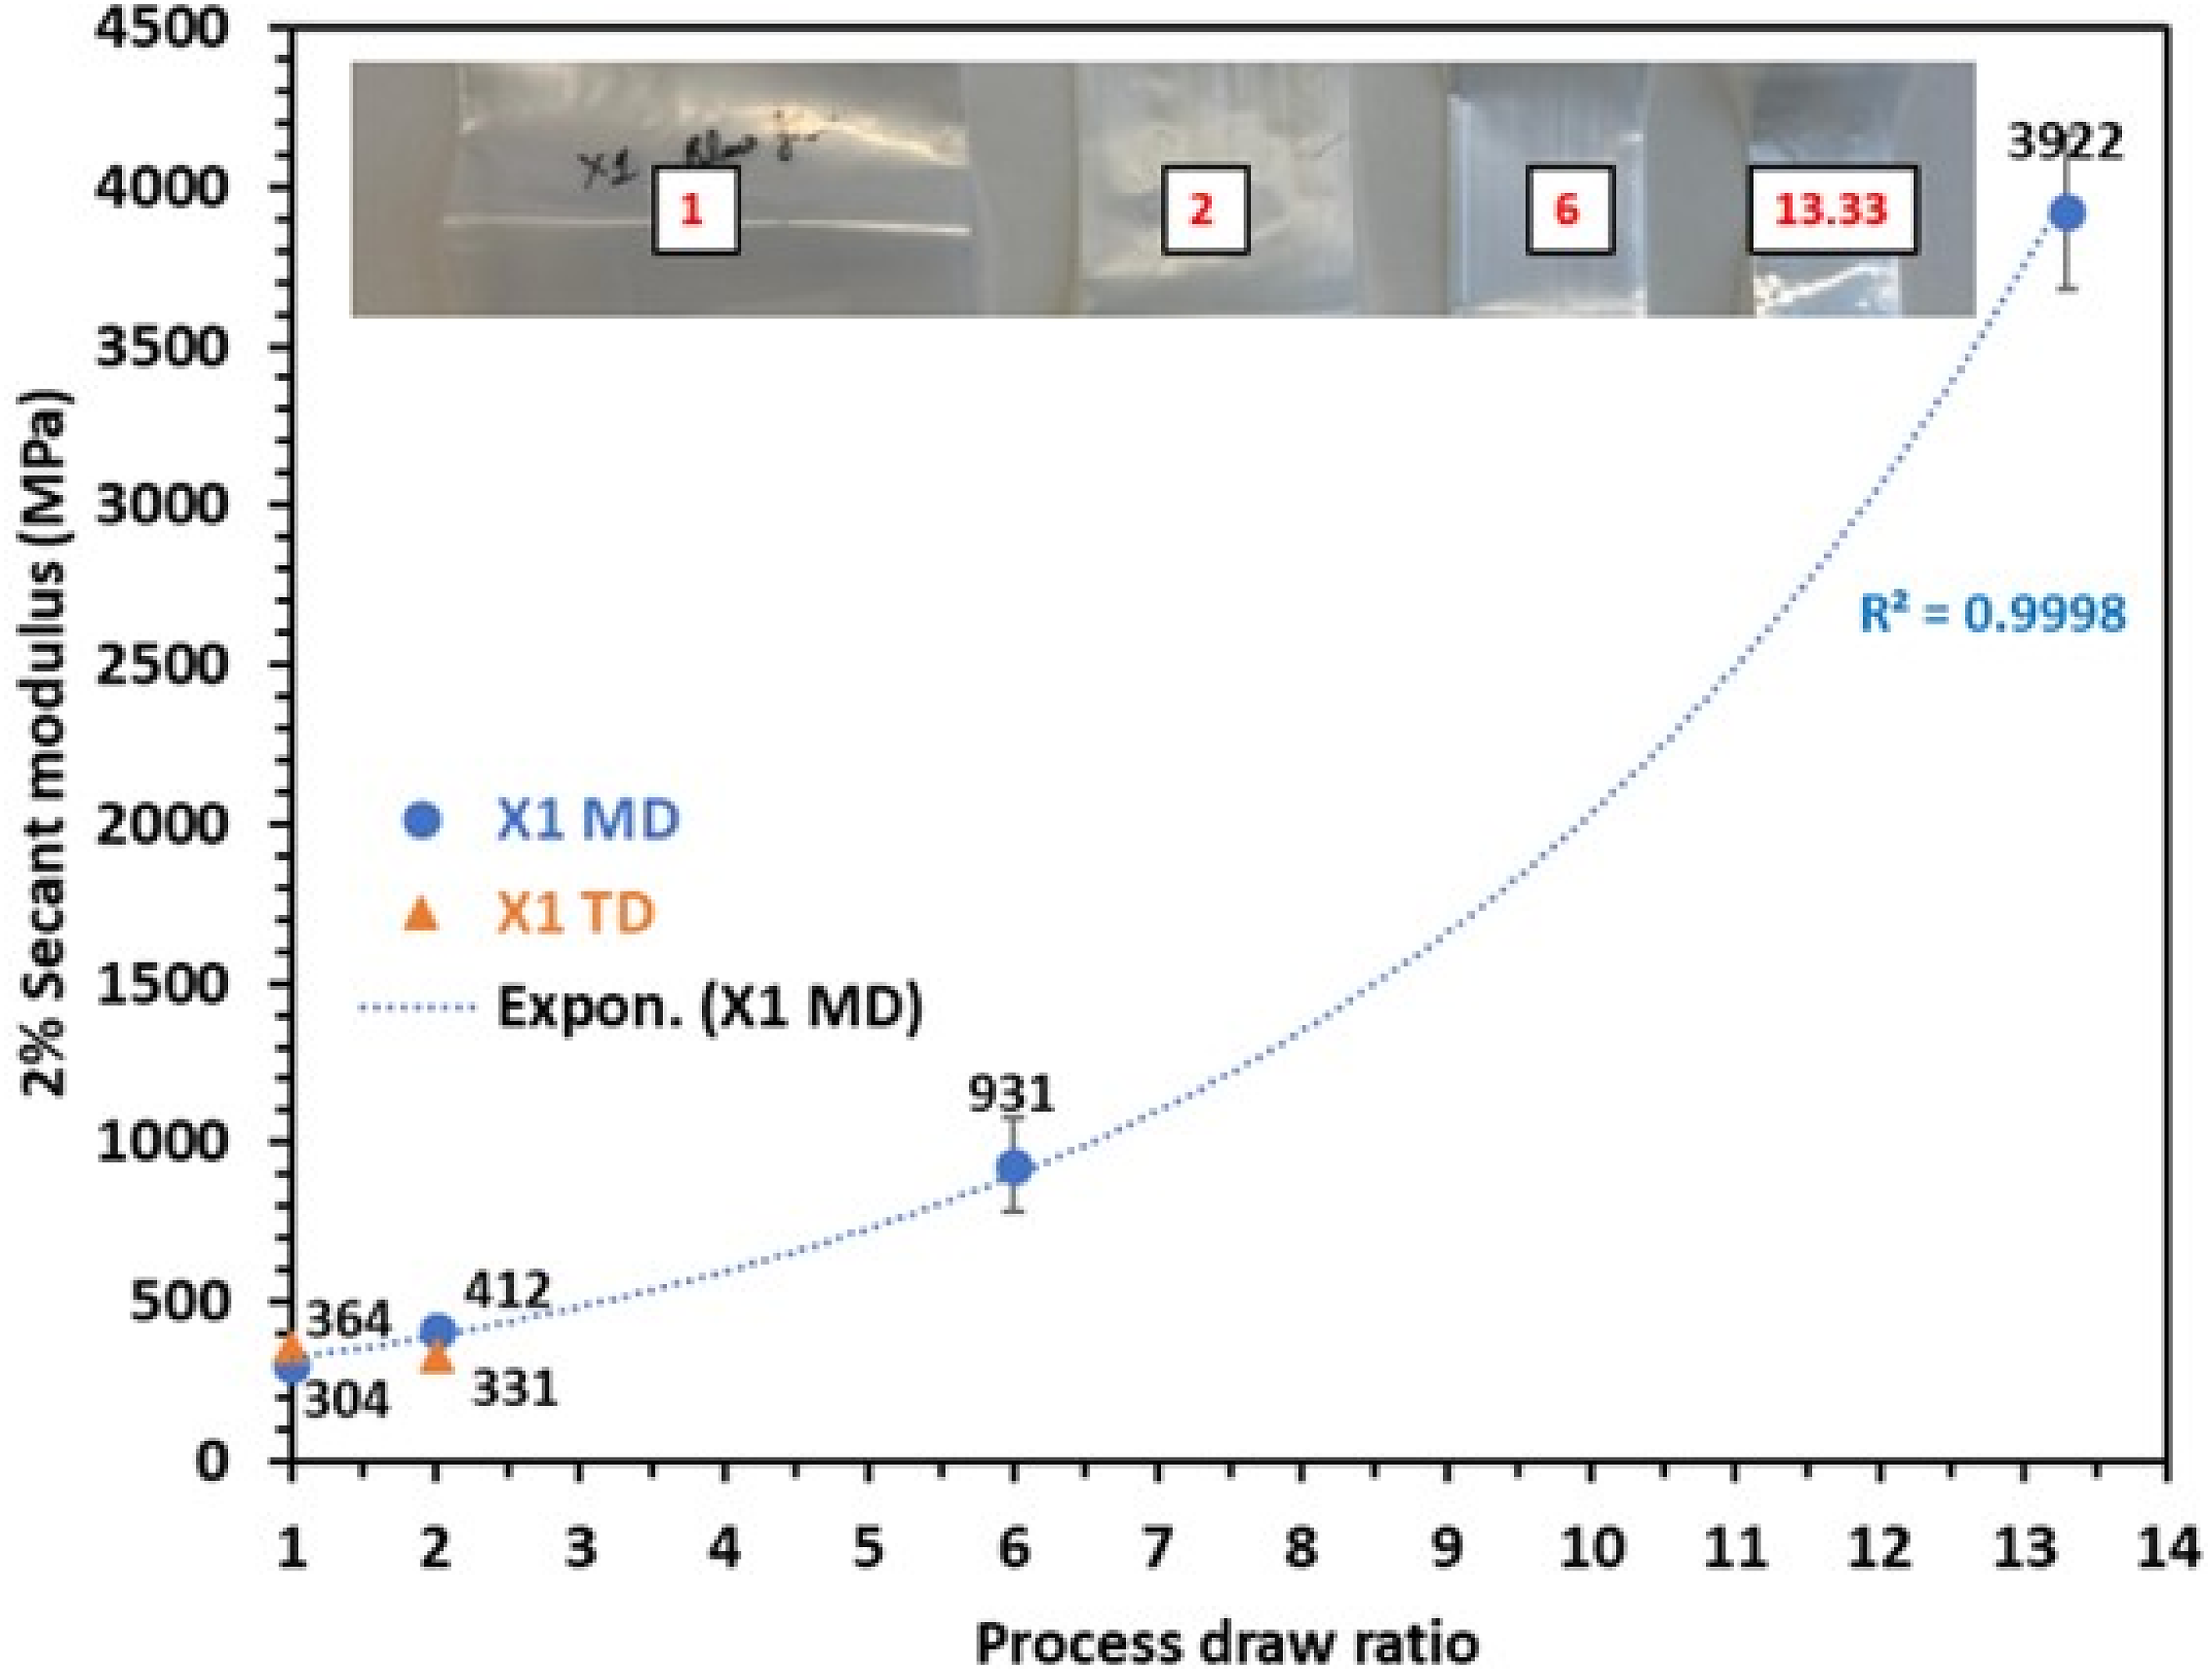
The X1 MD modulus increased to around 4000 MPa at the maximum used process draw ratio (13.33). This is almost 13 times higher compared to the unstretched blown film MD modulus. This higher modulus is also comparable with the modulus of polymers such as polyethylene terephthalate (PET) and polyamide (PA), which are conventionally used in multilayer flexible packaging systems outer layer: the PET film typical modulus is 2800 MPa and for PA film it is 3000 MPa.55,56 This large increase in modulus at the highest used process draw ratio is attributed to high fibrillation of the initial crystalline structure accompanied by strain-induced crystallization and amorphous phase orientation with increasing draw ratio, resulting in the overall increased crystallinity and a highly oriented microstructure in the machine direction.
MDO films thermal analysis confirmed this. The DSC melting curves in Figure 17 show a notable rise in the enthalpy of melting and % crystallinity, progressing from 127.1 J/g (43.4% crystalline) for the X1 blown film to a maximum of 151.9 J/g (51.8% crystalline) for its MDO film at 13.33 MDX. During stretching a fibrillar structure with higher crystallinity is formed.57–60 Steep melting curves at 13.33 MDX with higher melting enthalpy clearly indicates a fibrillar morphology with higher overall crystallinity. The peak melting temperature decreased slightly for MDO films compared to blown films, indicating that the crystals in the blown films were disintegrated, leading to forming more relatively smaller crystals after MDO stretching. X1 DSC melting curves (1st heating cycle, Endo up) for process draw ratio along with enthalpy of melting. (Note: Curves at the process draw ratio of 2, 6 and 13.33 are presented with offset of 1,2 and three respectively on y-axis for better comprehension).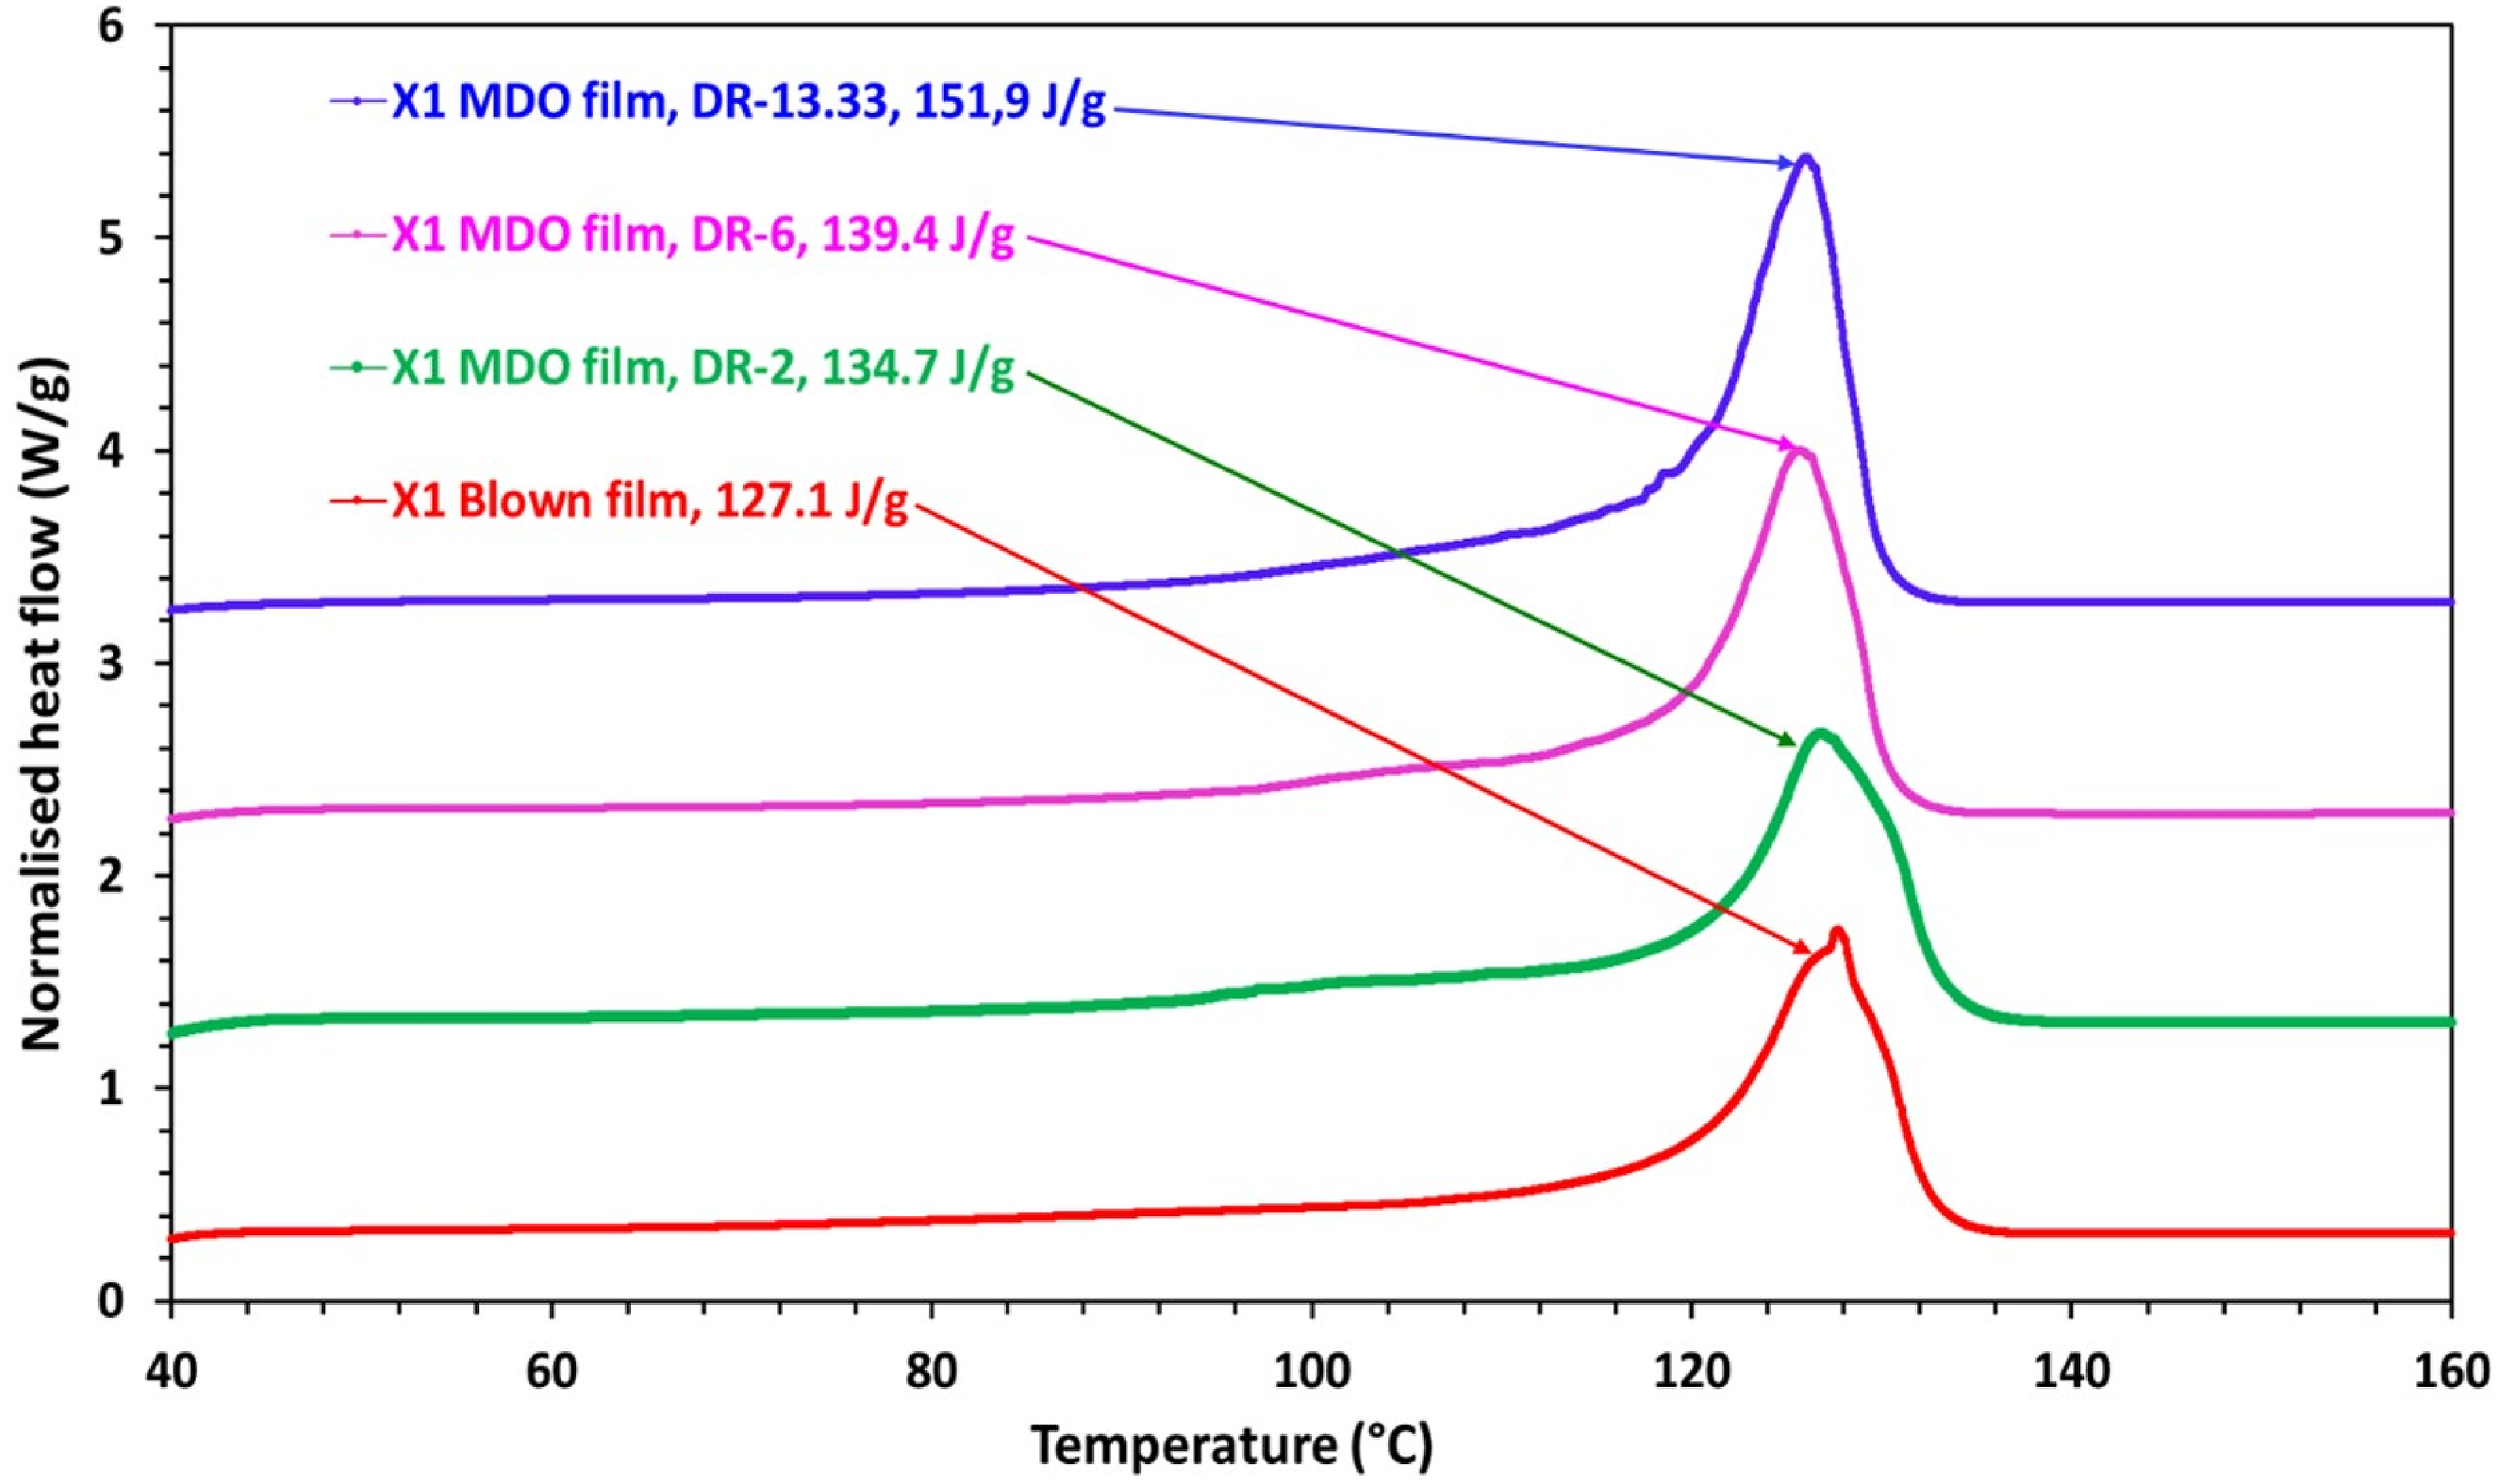
Figure 18 shows the nominal stress versus strain curves for X1 and its MDO films at 2, 6, and 13.33 MDX. Nominal stress versus strain at room temperature (23°C) for X1 blown film and its MDO films at 2, 6 and 13.33 MDX. (Note: The curves are truncated at 60% strain on x-axis for better representation).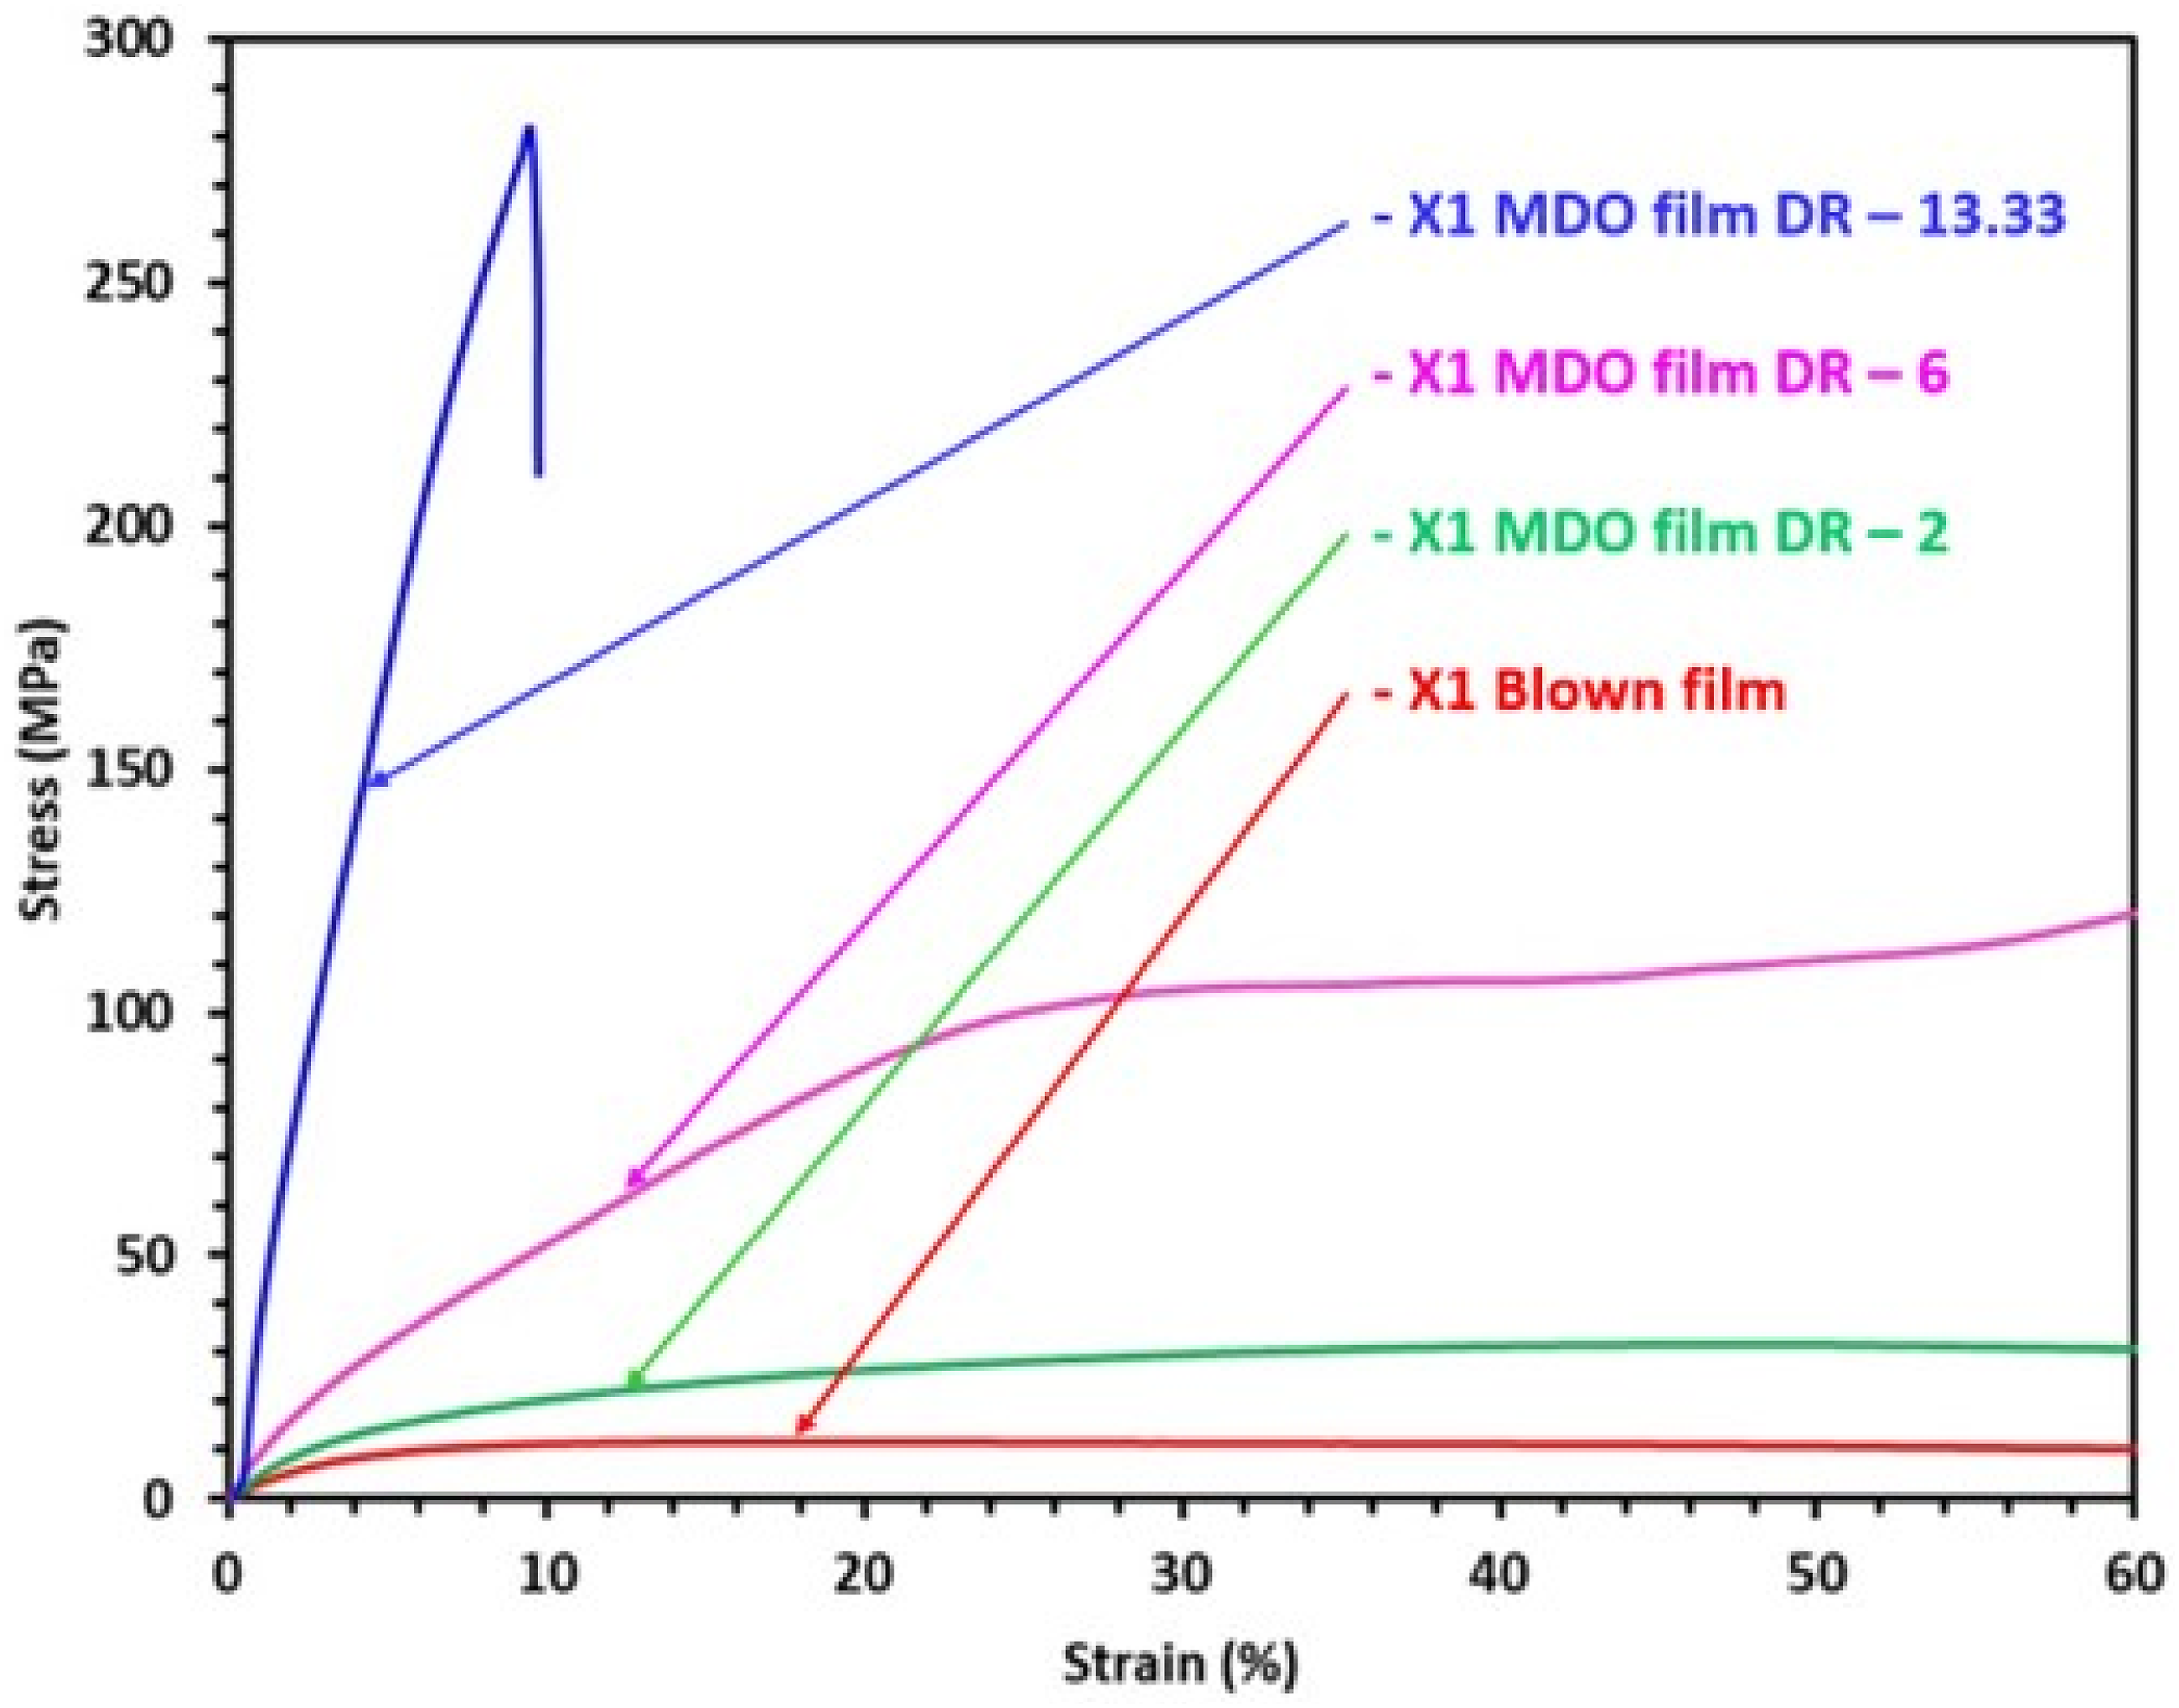
The nominal stress versus strain curves clearly shows that increasing draw ratios create stiffer and stronger behaviour. The yield stress increased while the yield strain decreased with the increasing draw ratios as expected. The 13.33X MDO film showed extremely high tensile strength (about 280 MPa). Conversely, its strain at break was lower at about 10%.
Examining the SEM and AFM images from Figure 19, the X1 blown film exhibited a coarse randomly oriented morphology. It was expected as blown film induces both machine direction (MD) and transverse direction (TD) orientations simultaneously. Both the 2.31 blow-up ratio (BUR) and the 3.15 draw-down ratio (DDR) were moderate and close to each other, giving the film balanced overall orientation and therefore randomly oriented morphology. SEM (top) and AFM (bottom) images of the X1 blown film and its subsequent MDO films at 2, 6 and 13.33 MDX. Green arrows represent machine direction and the picture above images are pictures of the four films.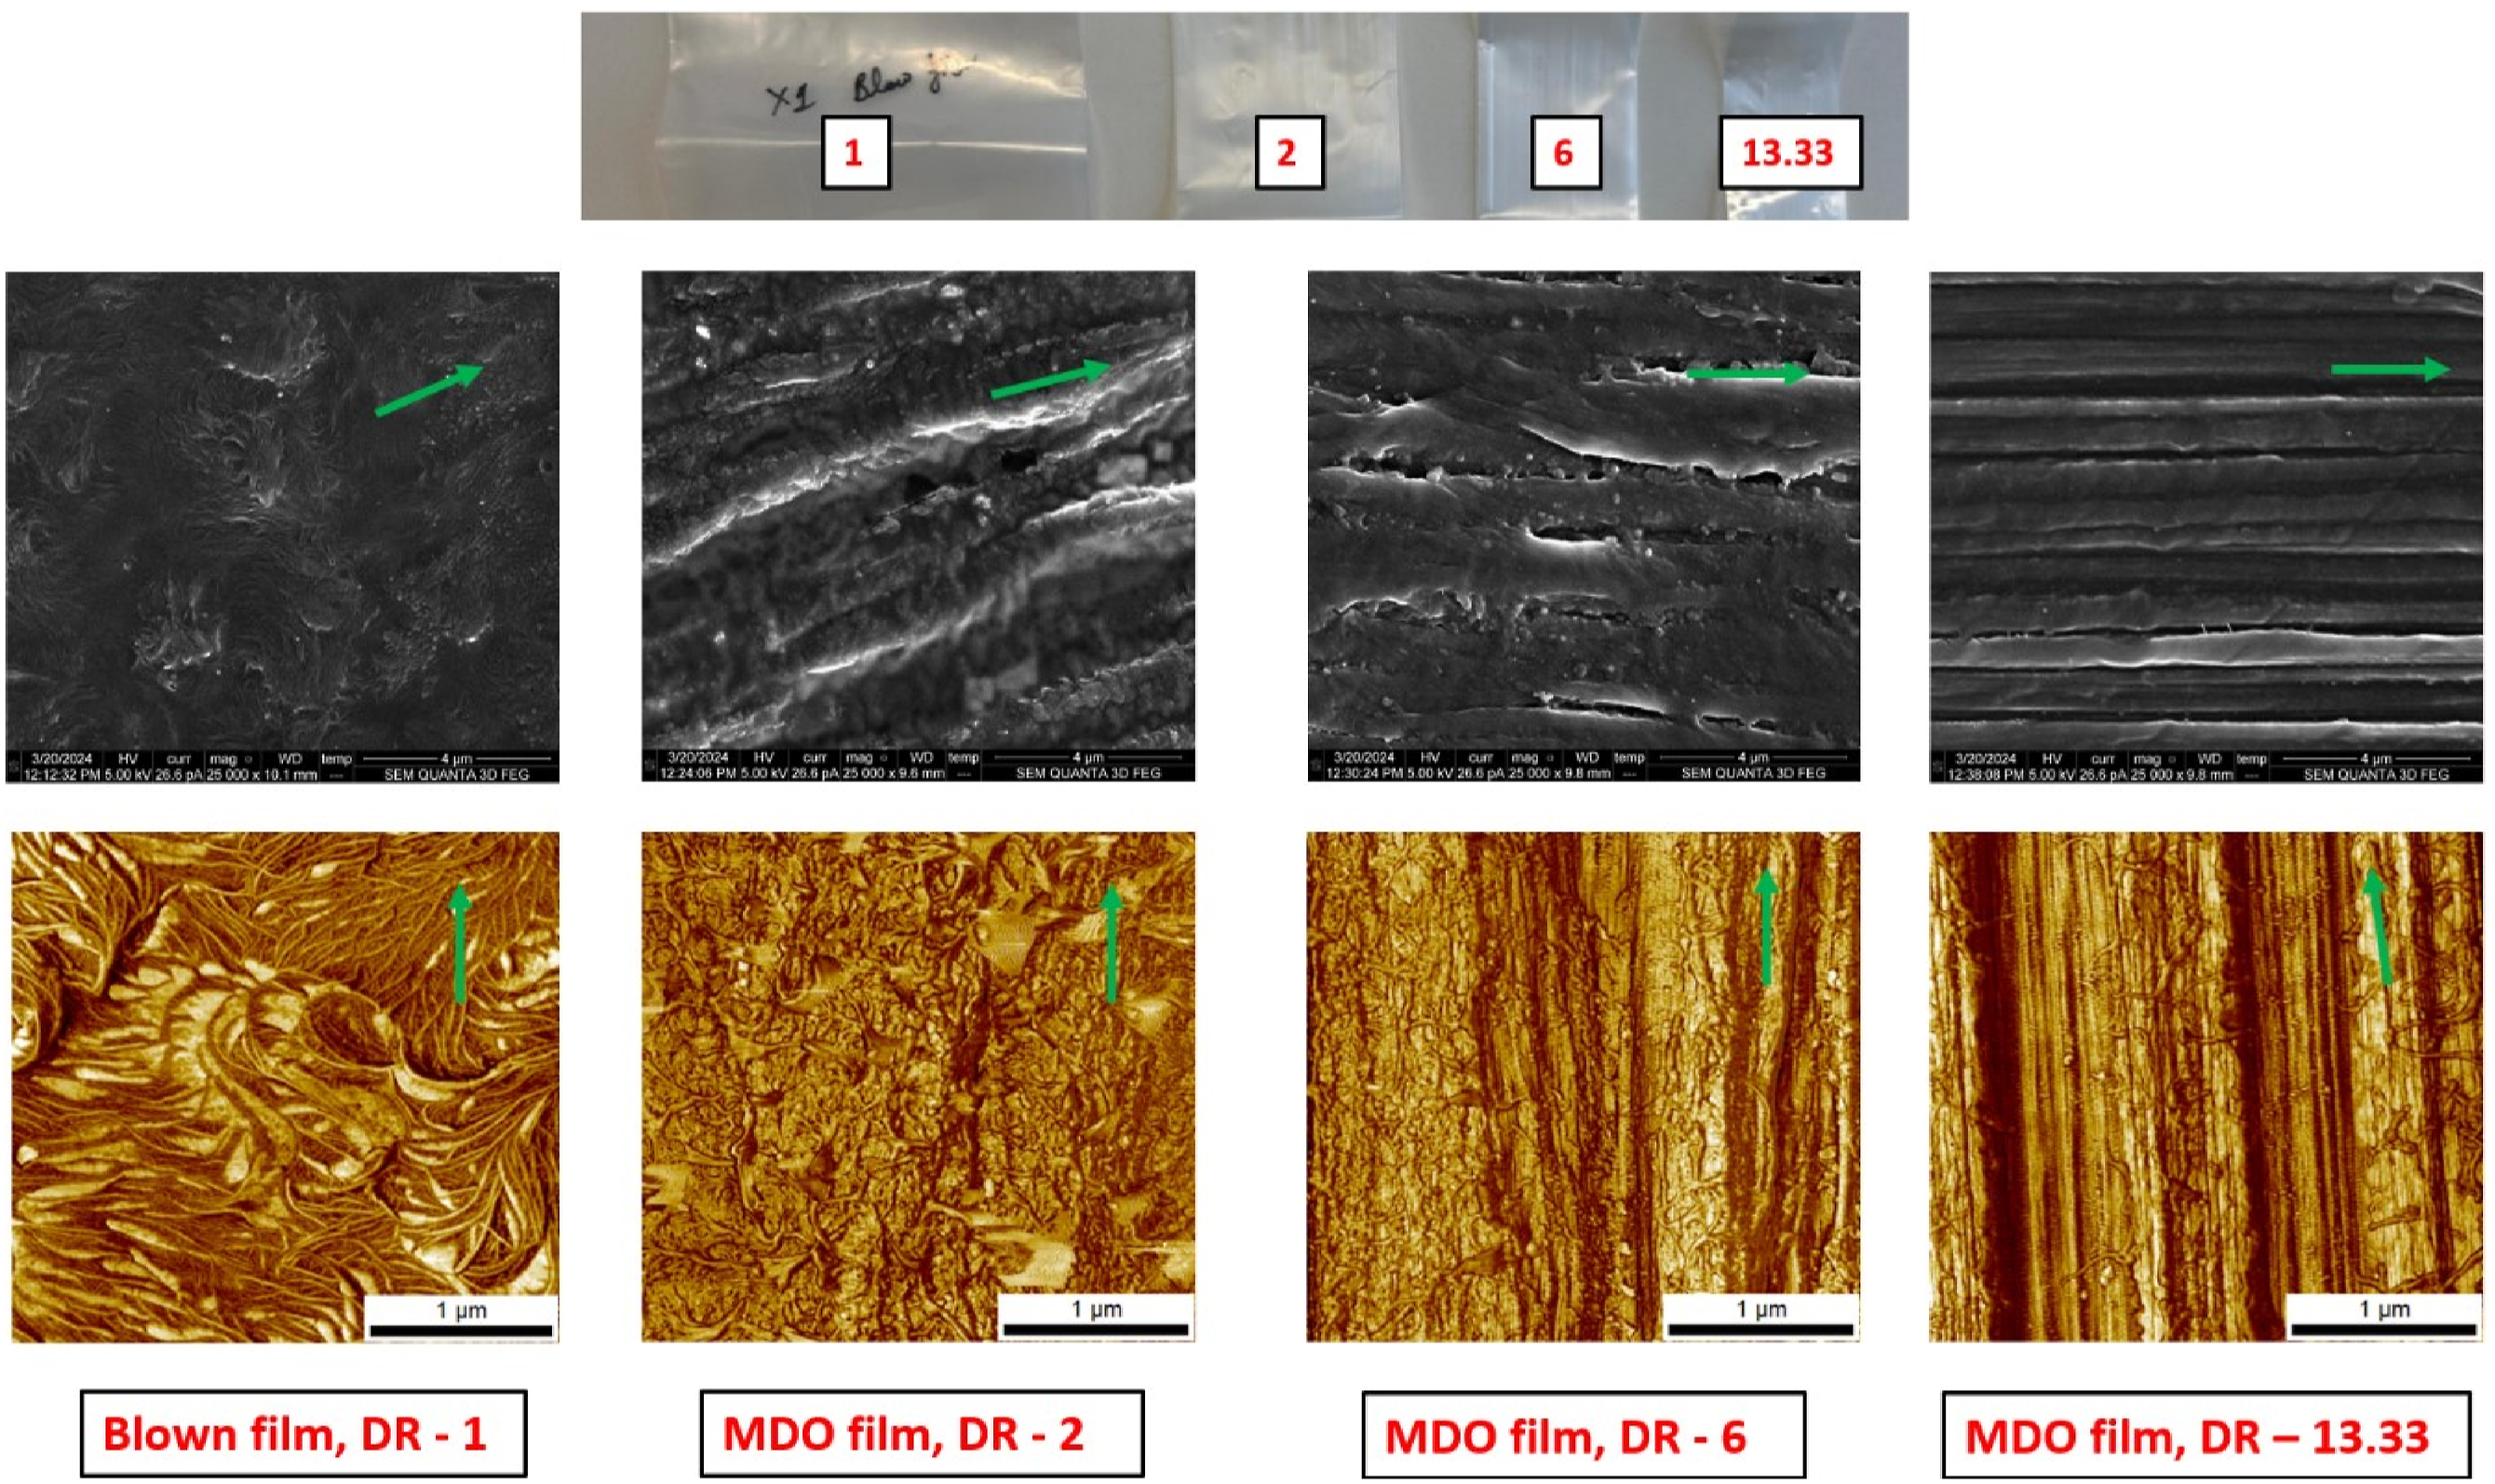
The SEM and AFM images with process draw ratio increasing from two to six shows the destruction of randomly oriented microstructure to fibril development oriented in the MD. SEM and AFM images at 13.33 MDX, present well-pronounced fibrils with a strong MD orientation with no evidence of the previously present randomly oriented morphology in its blown film.
Conclusions
In this work we studied how molecular properties like average molecular weight, molecular weight distribution, comonomer content and vital MDO process parameters like process draw ratio affect final morphology and increase targeted mechanical properties in MDO-PE films produced in series with blown film operation. For that, we studied five commercial PE resins and their blends with different average molecular weight, density, comonomer content, polydispersity, and correlated it with final targeted mechanical properties of the PE film with MDO orientation for outer layer application in multi-layer mono-material PE based flexible packaging. We further investigated how the MDO process draw ratio affects the targeted mechanical property of modulus. Key conclusions of the work are presented as follows: • A higher fraction of low-molecular-weight chains results in a higher natural draw ratio, leading to the higher modulus in the MDO films. • The blend with lower comonomer content exhibited greater modulus increase after stretching, likely due to the larger crystal sizes formed in its blown film prior to stretching, which facilitates higher strain-induced crystallization and amorphous region orientation during MDO. • The increased crystallinity and highly oriented microstructure in the MDO-PE films machine direction (MD) resulted in higher MD modulus compared to biaxially oriented blown films. • SEM and AFM results indicated that a higher MDO process draw ratio transforms randomly oriented microstructure into fibrils which are strongly oriented towards MD. • The tensile modulus increased exponentially with the process draw ratio, reaching values similar to high-modulus polymers like PET and PA used in the outer layer of multilayer flexible packaging.
The stiffness-enhanced MDO-PE films have potential applications as an outer layer in PE-based designs for flexible packaging, offering improved mechanical properties and performance.
Supplemental Material
Supplemental Material - Impact of molecular architecture and draw ratio on enhancement of targeted mechanical properties of MDO-PE films produced after blown film extrusion
Supplemental Material for Impact of molecular architecture and draw ratio on enhancement of targeted mechanical properties of MDO-PE films produced after blown film extrusion by Dixit Guleria, Mariya Edeleva, Sylvie Vervoort, Shouren Ge, Jaap den Doelder and Ludwig Cardon in Journal of Plastic Film & Sheeting
Footnotes
Declaration of conflicting interests
The author(s) declared no potential conflicts of interest with respect to the research, authorship, and/or publication of this article.
Funding
The author(s) disclosed receipt of the following financial support for the research, authorship, and/or publication of this article: This work has been performed in the framework of the C-PlaNeT (Circular Plastics Network for Training) project which has received funding from the European Union’s Horizon 2020 research and innovation program under the Marie Sklodowska-Curie grant agreement No 859885.
Data availability statement
Data will be made available on request.
Supplemental Material
Supplemental material for this article is available online.
Biographies
References
Supplementary Material
Please find the following supplemental material available below.
For Open Access articles published under a Creative Commons License, all supplemental material carries the same license as the article it is associated with.
For non-Open Access articles published, all supplemental material carries a non-exclusive license, and permission requests for re-use of supplemental material or any part of supplemental material shall be sent directly to the copyright owner as specified in the copyright notice associated with the article.