
Abstract
This study focuses on the development of low-density polyethylene matrix nanocomposite films for food packaging industry and aims at improving low-density polyethylene oxygen barrier properties while maintaining other relevant characteristics, such as processability, easy post-processing, optical and mechanical properties.
low-density polyethylene nanocomposites, with 1 and 2.5 wt.% nanoclay (NC) and also compatibilized with 5 wt.% polyethylene grafted with maleic anhydride (PE-g-MA), were prepared and used to produce blown films. The nanocomposites were characterized in terms of their morphology, thermal, rheological, mechanical, barrier and optical properties, through scanning electron microscopy (SEM), X-ray diffraction (XRD), differential scanning calorimetry (DSC), rheological measurements, tensile tests, water vapor transmission, oxygen permeability tests and spectrophotometry. The results demonstrated good NC dispersion in the polymer matrix and decreased oxygen permeability in the compatibilized nanocomposite films. All the other properties did not significantly change when compared to neat low-density polyethylene.
Overall, the film properties were improved with the added nanoclay and PE-g-MA and, have potential for food packaging.
Keywords
Introduction
Adding fillers in a polymer matrix is a common process, in the plastics industry, that improves properties, such as, mechanical, gas barrier, antimicrobial and, in some cases, reduce raw material costs.1,2
Polymeric nanocomposites consists of a continuous polymer-based phase and one or more phases dispersed at the nanoscale. 3 According to the literature, these systems exhibit better performance when compared to micro-composites and neat polymer, even at low nanoparticle concentrations.2,4 The size difference between micro and nanoparticles results in drastic changes in the material properties. Since the surface area to volume ratio is inversely proportional to the particle diameter, the smaller the diameter, the greater the surface area to volume ratio, increasing the interaction between the particle surface and the matrix.5–7 To take advantage of the improved properties resulting from this increased interaction, a good nanoparticle dispersion and distribution in the polymeric matrix is mandatory. However, it is quite difficult to obtain nanocomposites with a good NC dispersion in non-polar polymers, such as polyolefins.8–12
Polyolefins are widely used in flexible food packaging due to their low moisture permeability, among other features. Since they have a hydrophobic nature, their interaction with the organically modified clay is weak. Therefore the desired intercalation and/or exfoliation of the clay lamellas, despite the high shear forces applied during melt mixing process used to produce the nanocomposite, is not always achieved. 13 Adding compatibilizers improves the interface between polymer matrix and nanoparticle surface, enhancing nanoparticles dispersion. 14 PE-g-MA (polyethylene grafted with maleic anhydride) has been widely used to improve the interaction between the nanomaterial polar surface and the nonpolar matrix. 15
Despite the good properties associated to PE in food packaging industry, such as flexibility, transparency and good sealing properties, it has poor oxygen barrier properties,16,17 which might be overcome using NC. With the added NC, permeability is significantly affected due to the tortuous path imposed by the NC arrangement in the matrix to gas diffusion. 12
Therefore, since NC are authorized by the European Union in Commission Regulation (EU) No. 10/2011, as safe for food applications this study aims to improve the LDPE film barrier properties for food packaging applications. For this purpose, adding NC at 1 and 2.5 wt.%, with and without a compatibilizer (PE-g-MA), in a LDPE matrix affected the film performance for food packaging. The NC morphology and dispersion were investigated by scanning electron microscopy (SEM) and X-ray diffraction (XRD), thermal properties were characterized by differential scanning calorimetry (DSC), and processability was assessed through melt flow index (MFI). The barrier, mechanical and optical film properties were measured through oxygen permeability, tensile and turbidity tests, respectively. To assess the film performance in post-processing operations such as heat sealing and printing), sealing and contact angles tests were carried out. The characterization protocol evaluated not only the new films adequacy for food packaging, but also their viability to be produced in an industrial environment without significantly modifying the processing conditions.
Experimental
Materials
ExxonMobil LD 159 AC a low density polyethylene, extrusion blown film grade (density = 924 kg/m3, MFI = 1.2 g/10 min and melt temperature = 110°C) was used as matrix, Dow Inc. FUSABOND E226 a PE-g-MA compatibilizer (MFI = 1.75 g/10 min, melting temperature = 120°C), was selected. Laviosa Mineral Solutions SpA Dellite 67 G, montmorillonite modified with quaternary ammonium salt and purified was the NC used.
Preparation of low-density polyethylene based nanocomposites
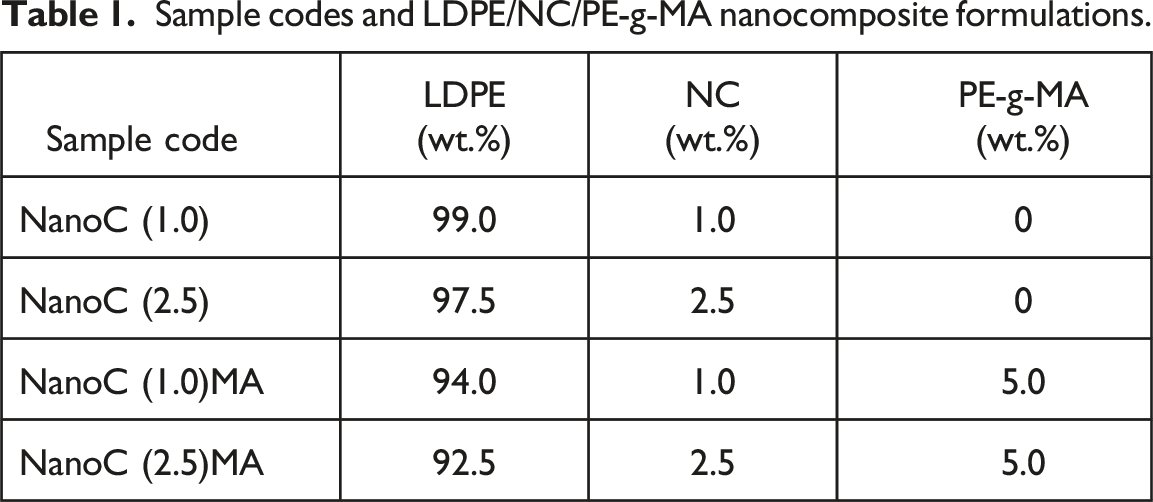
Sample codes and LDPE/NC/PE-g-MA nanocomposite formulations.
Blown film extrusion
The nanocomposite pellets were dried at 60°C for 4 hours before the blown film extrusion process, carried out in a laboratorial Periplast single-screw extruder (D = 25 mm and L/D = 25) coupled to an extrusion head with a 50 mm diameter annular die and 1.25 mm gap. The extruder temperature profile was set at 175°C - 180°C - 180°C, and the three heating zones of the extrusion head were set at 190°C. A blow-up 2.5 ratio (BUR) and a 8.5 take-up ratio (TUR) were used in the film production. These are typical ratios used in industry. The final film thickness was between 50 and 60 μm.
These processing conditions were maintained for all the nanocomposites tested.
Structural and thermo-rheological characterization
Morphology
Scanning electron microscopy
Scanning Electron Microscopy analysis was carried out on film samples fractured in liquid nitrogen coated with gold in a Nano SEM - FEI Nova 200 equipment.
X-Ray diffraction
X-Ray Diffraction measurements were carried out, on film samples, at room temperature, 23 ± 2°C, using a diffractometer (i.e., Bruker D8 Discover) equipped with a CuKα generator (λ = 1.5404 Å) at 40 kV and 40 mA, in a 2θ range from 2° to 10° with a step of 0.01° with a counting time of 1 second per step. The NC interlayer distance,
Barrier, mechanical and optical properties
Oxygen permeability
The oxygen permeability tests were carried out on a Gas Diffusion Permeameter (DP-100A) from Porous Materials, Inc, using the pressure increase method. The 4 cm diameter film samples were subjected to a 101,325 kPa (1 atm) pressure, at 23 ± 2°C for 3 hours. Three specimens were used for each film sample. Before the tests, samples were stored at a temperature of 23 ± 2°C.
Water vapor transmission
The WVT tests were performed according to the desiccant method from ASTM E96/E96M-10. The samples with 8 cm diameter were sealed to the open mouth of a test cup, containing calcium chloride pre-dried at 200°C. The samples were placed inside a desiccator at 23 ± 2°C and weighed every 24 hours for a period of 25 days to determine the water vapor transmission through the sample to the desiccant. The WVT was the slope obtained by curve fitting the weight change over time via linear regression.
Tensile tests
The tensile tests were carried out in a universal mechanical testing machine, Shimadzu AG-X, with a 1 kN load cell, at 23 ± 2°C, at 50 mm/min. Following ISO 527-3 standard, for each sample, 5 film specimens of type 2 (160 × 25 mm) taken from the transverse (TD) and the machine (MD) directions.
Optical properties
The turbidity was determined in a XL-211 Hazegard System transmittance meter, according to ASTM D1003-00. This system measures the total light transmittance,
Thermal and rheological properties
Differential scanning calorimetry
The nanocomposite granules (or part of a granule) (4–5 mg) were placed in aluminium crucibles with pierced lid under nitrogen flow rate = 50 mL/min on a DSC Netzsch equipment, the procedure was repeated twice for each sample. As recommended in ISO 11,357-1 each sample was subjected to two heating-cooling cycles. The samples were heated at 10°C/min, from 30°C to 200°C, held at this temperature for 1 minute, then cooled to 30°C, at a cooling rate of 20°C/min, and then re-heated to 200°C with a heating rate of 10°C/min. The melting temperature (
Melt flow index
Before this test, the pellets were dried at 60°C for 4 hours. The test was carried out in a MFI Daventest, at 190°C and using 2.16 kg weight, according to ISO 1133-1.
Post-processing
Heat sealing tests and contact angle measurements were carried out to check the possibility of maintaining the usual conditions in post-processing operations, i.e., film sealing and printing (through the film surface wettability by a liquid 21 ).
Heat sealing
Films were heat sealed at 351 kPa, for 1 s, using a Labthink, model PARAM HST-H3 to obtain the minimum sealing temperatures.
For the tensile test, to measure the maximum sealing force of a 15 mm long weld, the films were again sealed under the same conditions, at 130°C for all samples. For each sample, five specimens were collected from the MD an TD direction sealed, and then tested on a LF-Plus testing machine, from Lloyd Instruments, with a 50 N load cell, at 100 mm/min.
Contact angles
The contact angle measurements were carried out in a Contact Angle System OCA equipment using distilled water on the film samples at 23 ± 2°C, in accordance with ASTM D7334-08. Distilled water (3 μl) was deposited on the films at 2 μl/s, using a syringe. The contact angle was measured immediately after the water drop was placed on the film surface. A total of thirty contact angles per sample were measured.
Results and discussion
Film production
The SEM micrographs in Figure 1 demonstrate that the nanocomposites exhibit different NC dispersion when the PE-g-MA at 5 wt.% is added. Comparing NanoC(1.0) and NanoC(1.0)MA, i.e., with the same NC amount without and with PE-g-MA, it is clearly visible that NanoC(1.0)MA presents a better dispersion. Similar observation can be made for NanoC(2.5) and NanoC(2.5)MA. Similar observations were made by Majeed et al.
18
SEM micrographs of LDPE and nanocomposite films.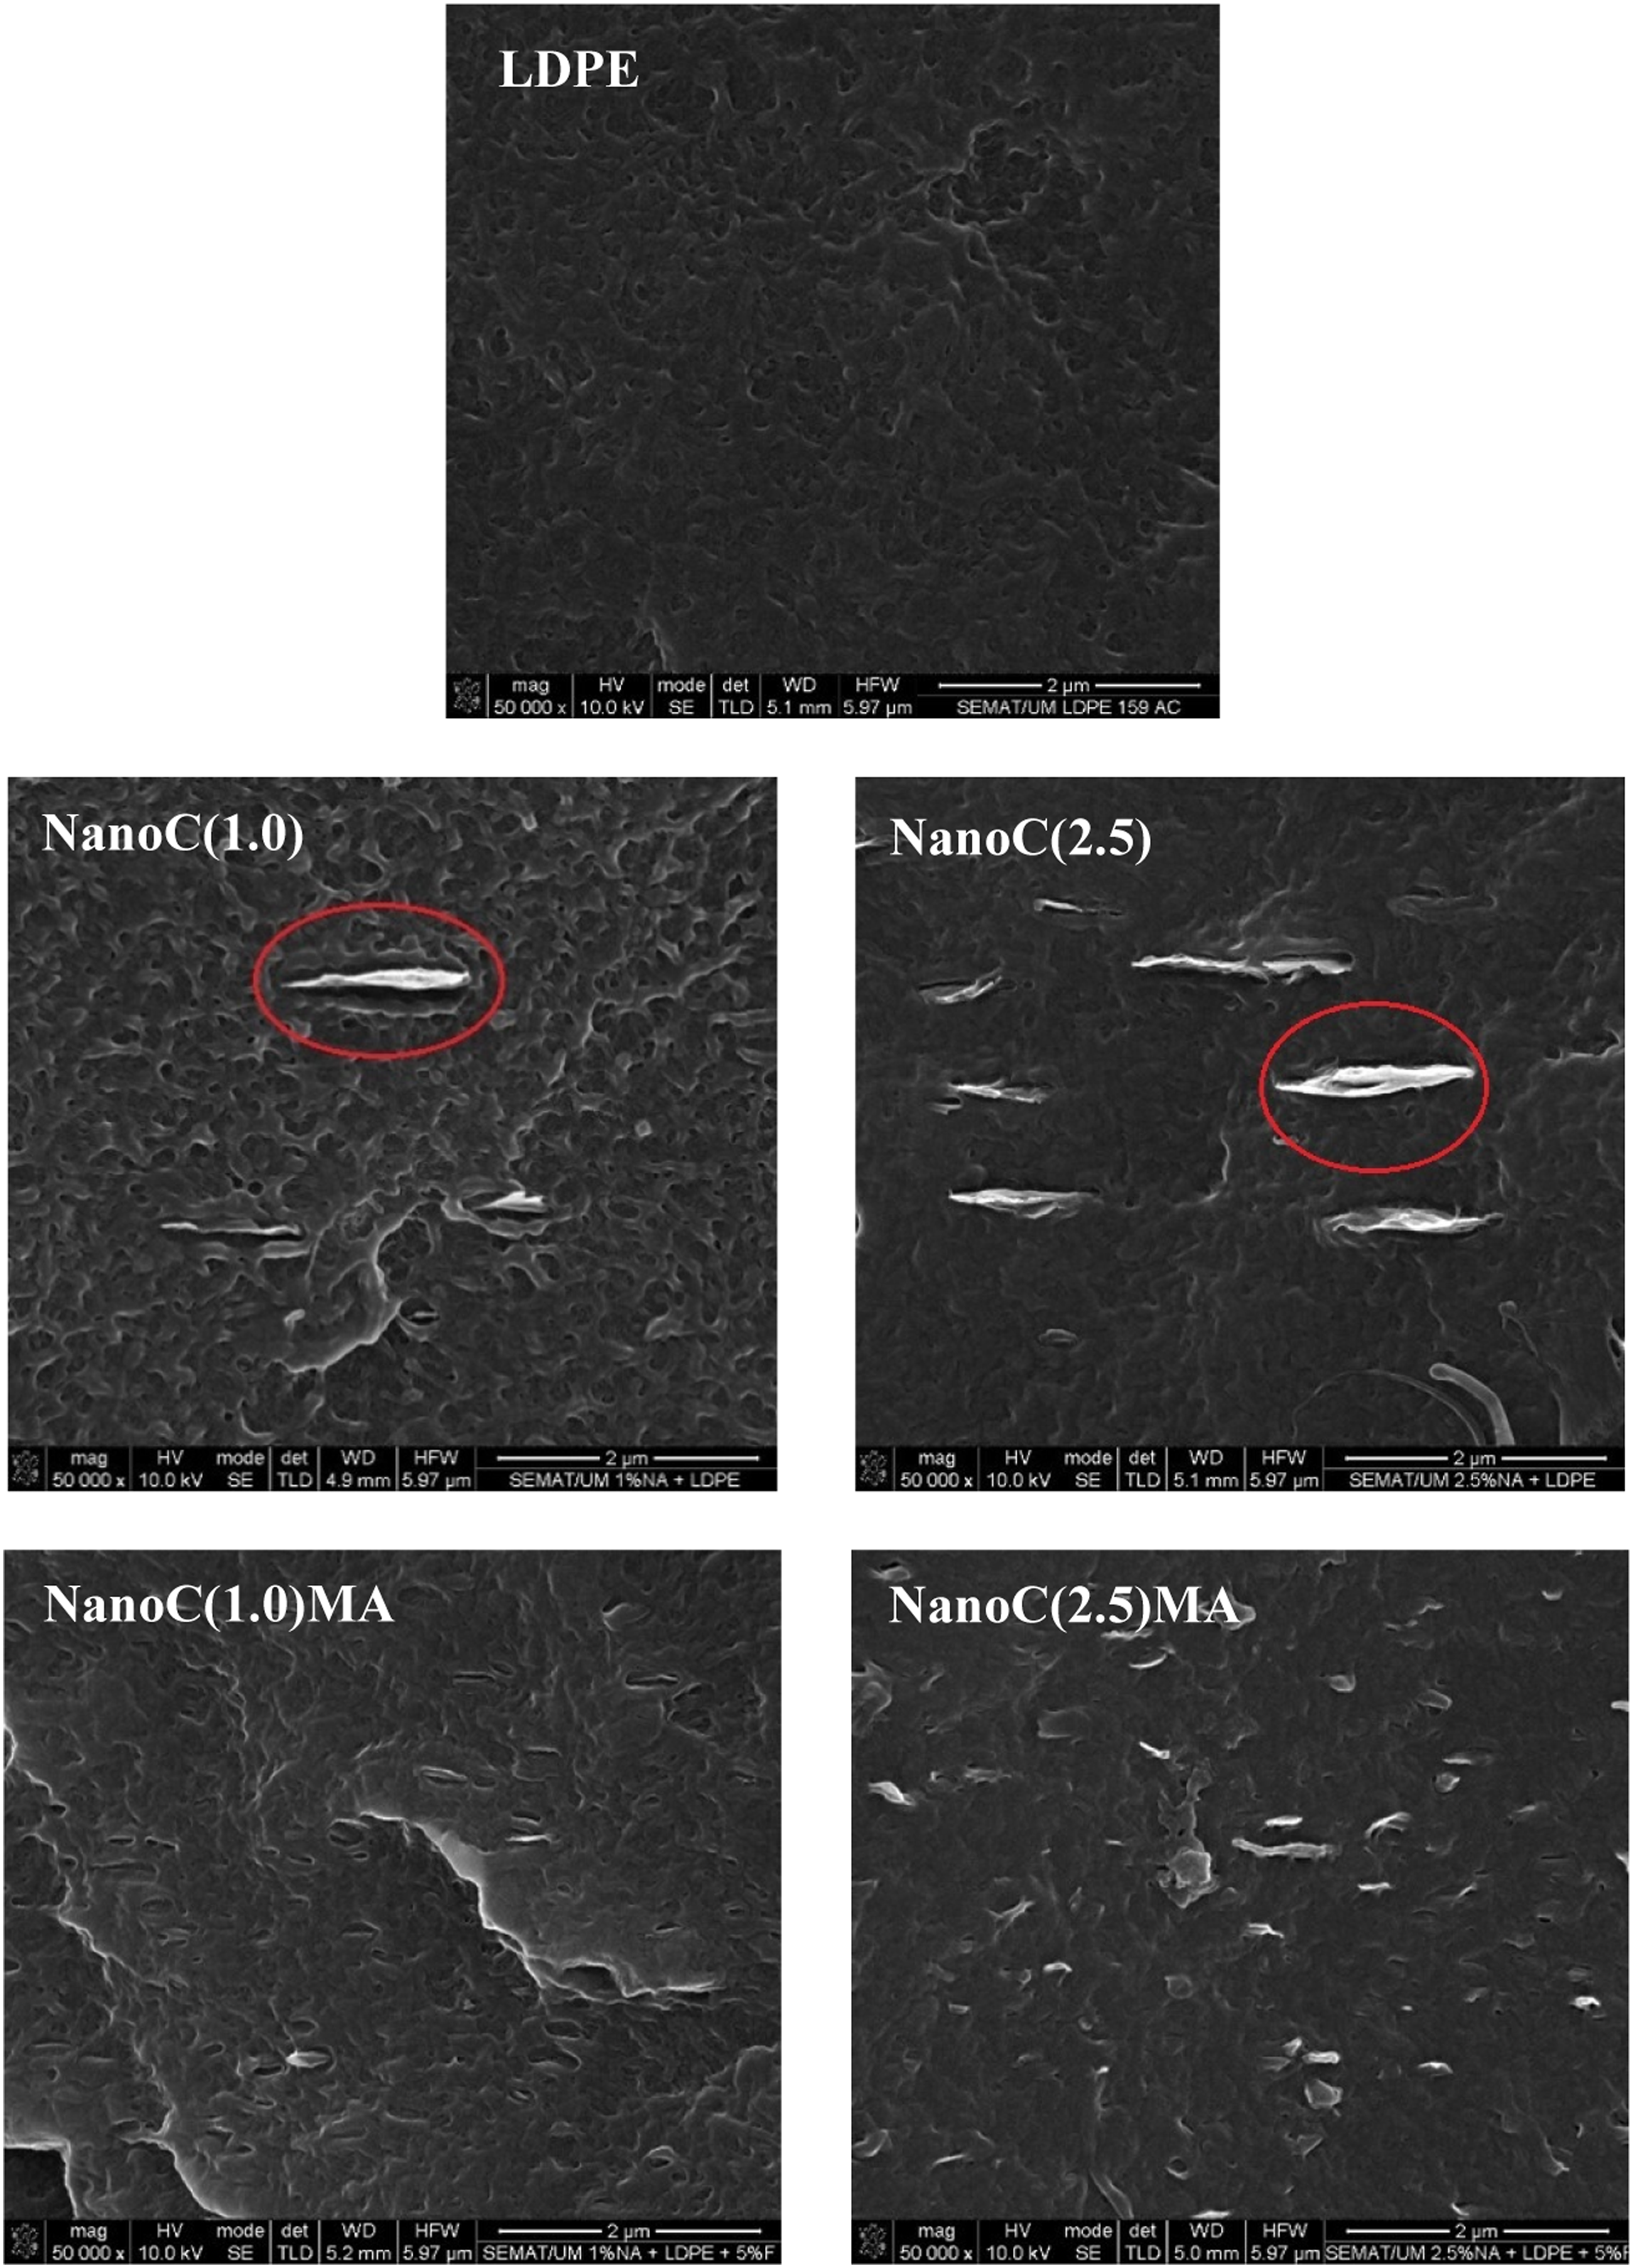
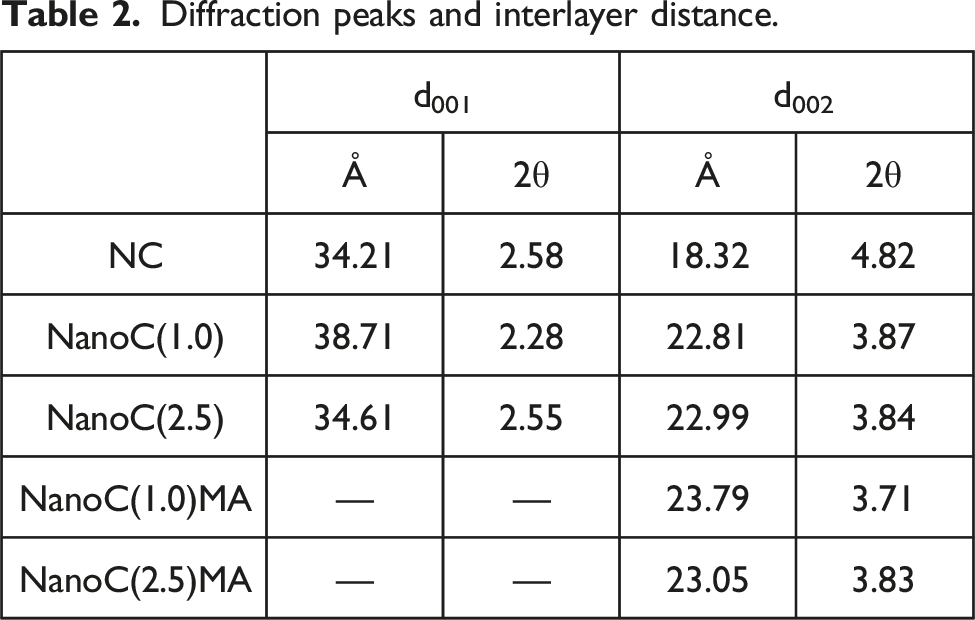
Figure 2 shows the XRD patterns for the NC, and the four LDPE/nanocomposite samples. They demonstrate that NC presents two diffraction peaks corresponding to interlayer distance d001 = 34.21 Å and d002 = 18.32 Å, Table 2. In samples NanoC(1.0)MA and NanoC(2.5)MA the peak at XRD patterns of NC and nanocomposites. Diffraction peaks and interlayer distance.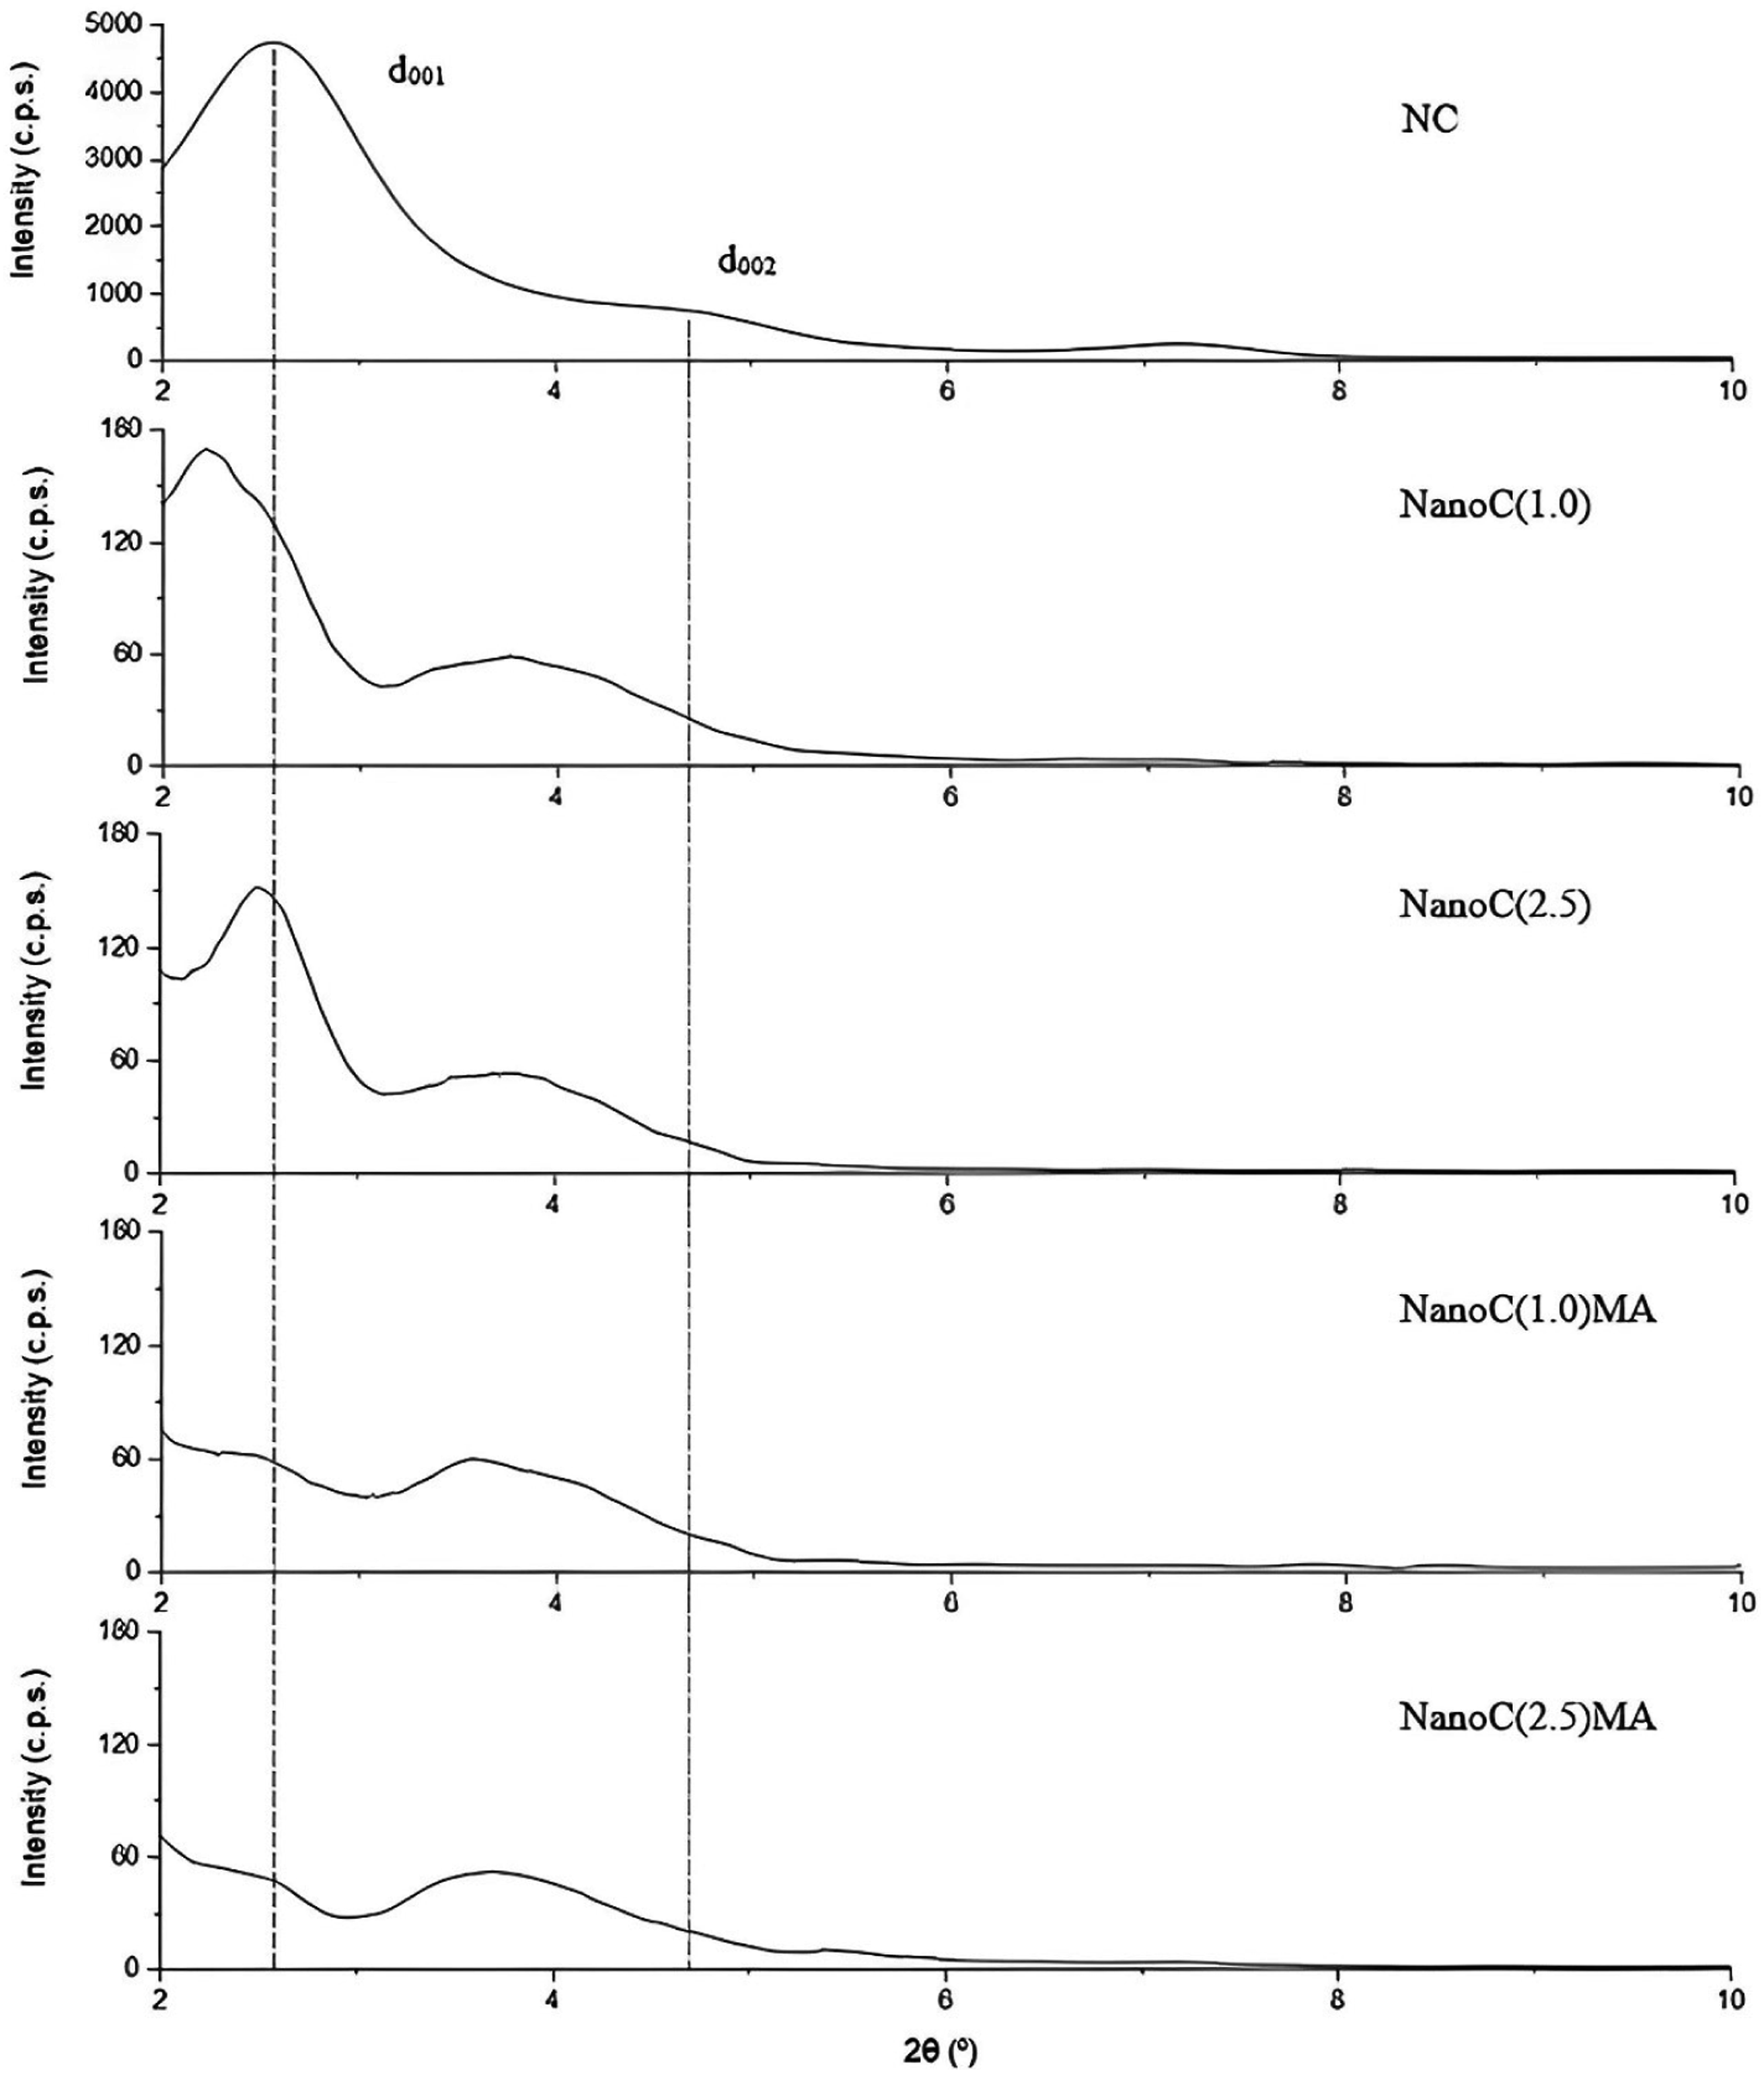
Film properties
Oxygen permeability and WVT results of the films produced.
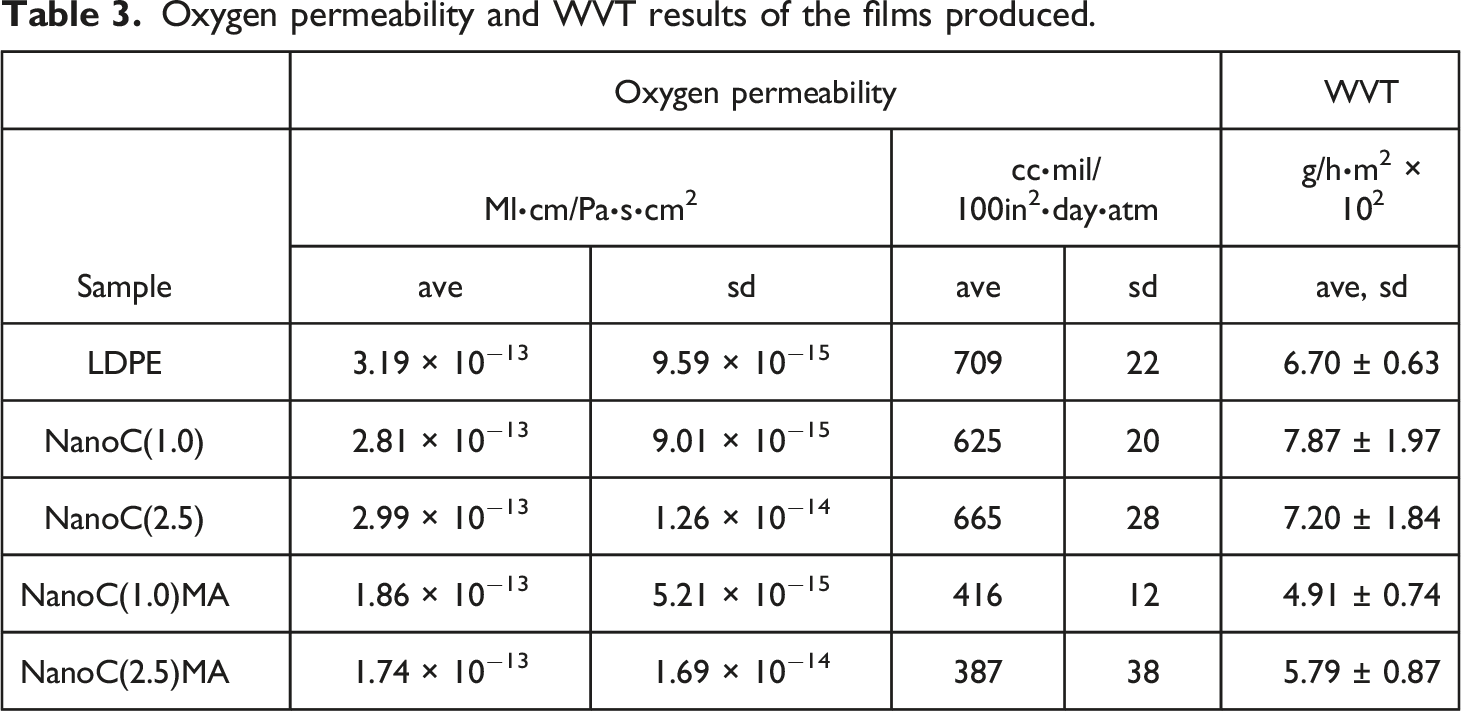
The WVT results demonstrate, in some way, a similar trend to the previous, but in this case, while the incorporation of NC without compatibilizer deteriorates the property, it improves when compatibilizer is used. The sample with the best WVT result was NanoC(1.0)MA, which has the lowest wt.% of NC, with a WVT of 4.91 × 10⁻² g/(h∙m2), i.e., a reduction of around 14% relative to LDPE. The increase of WVT in NanoC(2.5)MA sample, compared to NanoC(1.0)MA, can be associated to the agglomerates, as observed by SEM, where it can be seen that although the incorporation of PE-g-MA helps to promote the dispersion of NC, it is not sufficient.
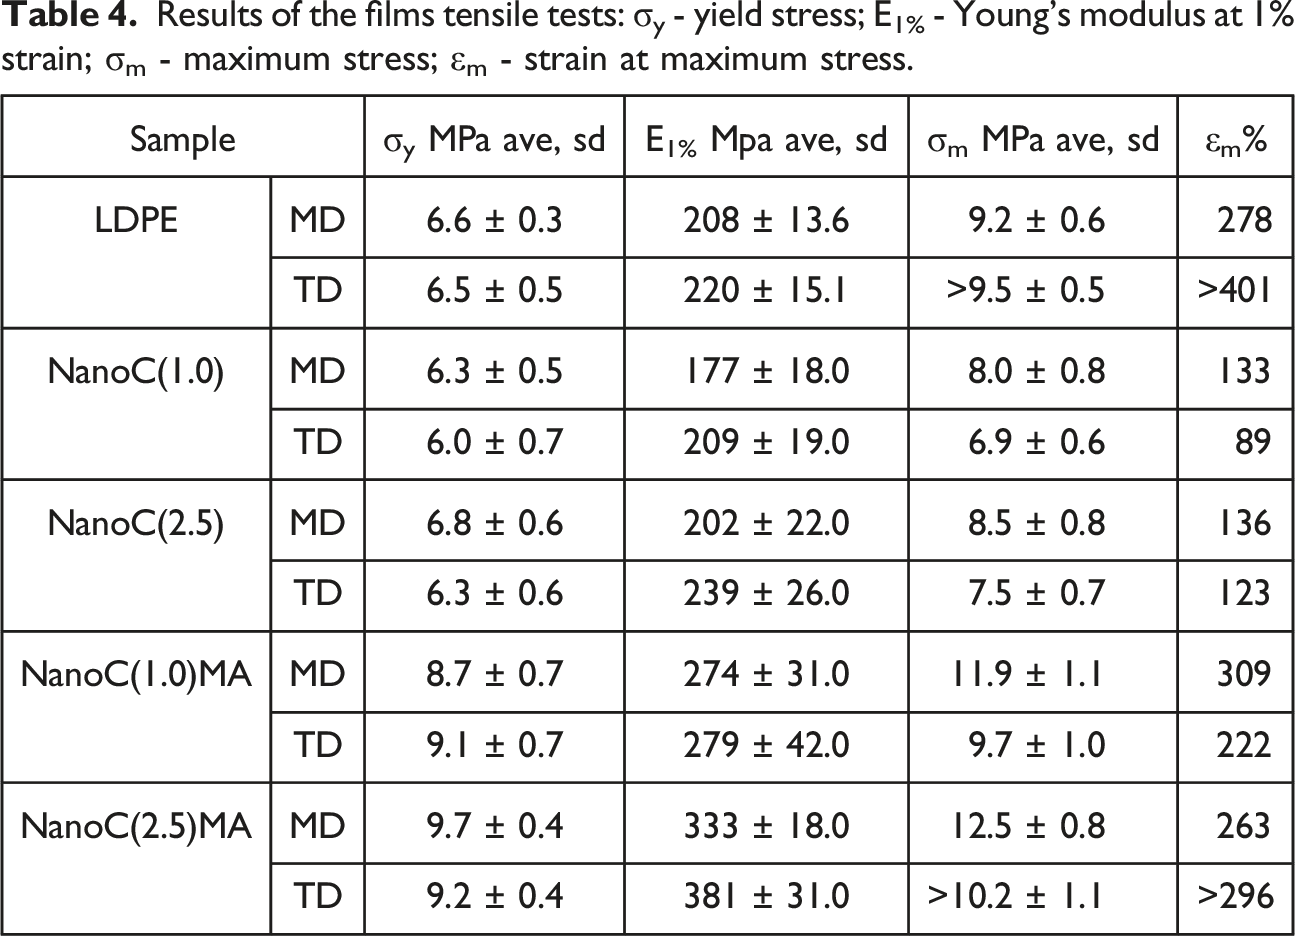
Results of the films tensile tests: σy - yield stress; E1% - Young’s modulus at 1% strain; σm - maximum stress; εm - strain at maximum stress.
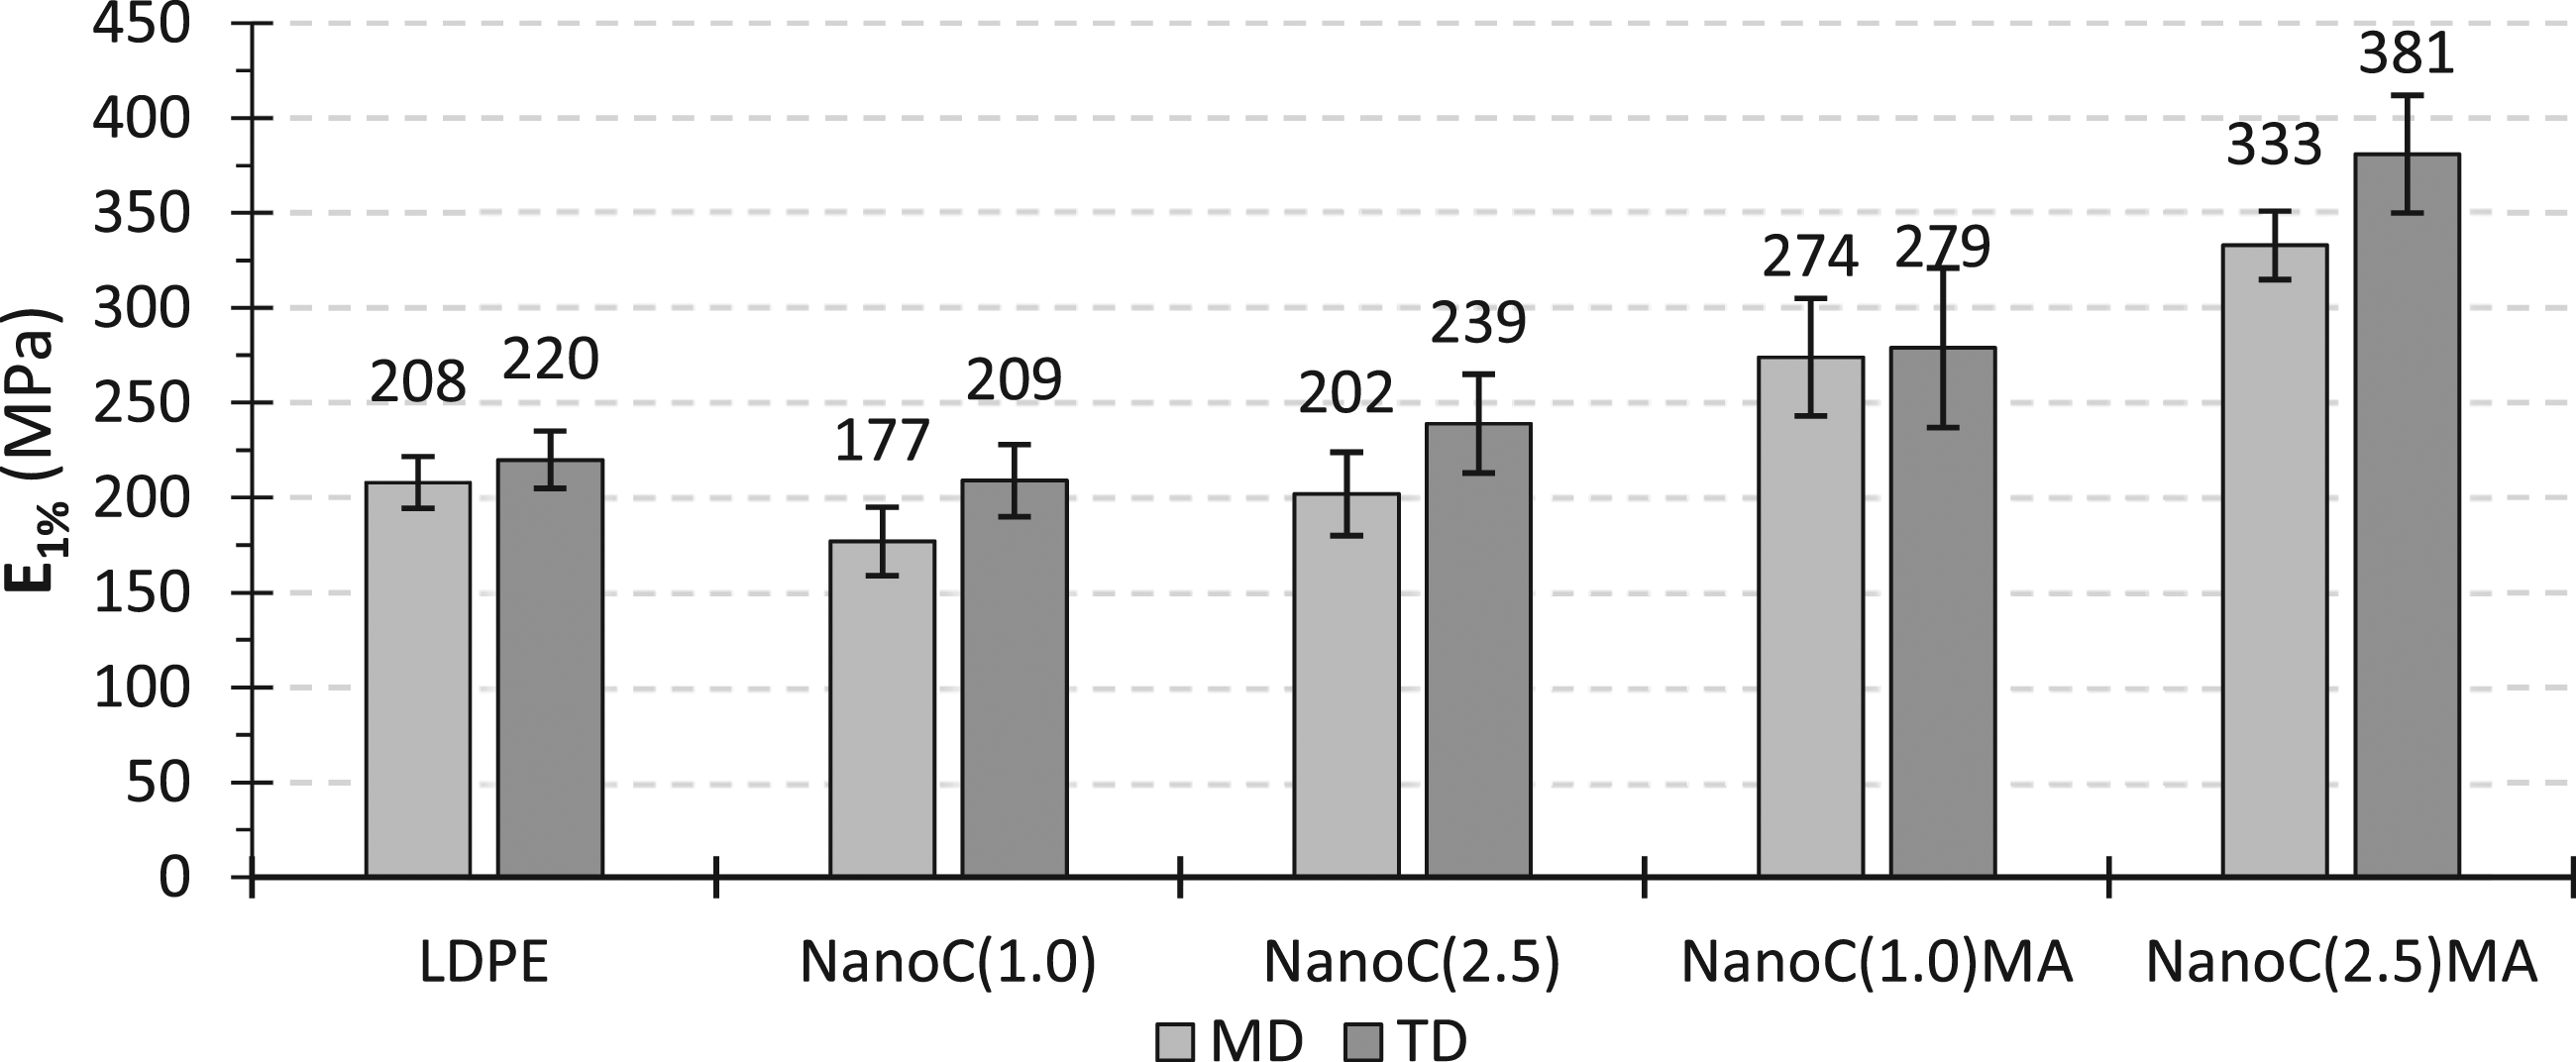
Young’s modulus values for LDPE and nanocomposite films.
According to the data provided the reinforcing capability of the NC only increases when the compatibilizer is added, which follows the literature results that shows that two incompatible systems have poor mechanical properties due to poor interfacial adhesion between the different components.18,23
T T , D T and turbidity values of LDPE and nanocomposite films.
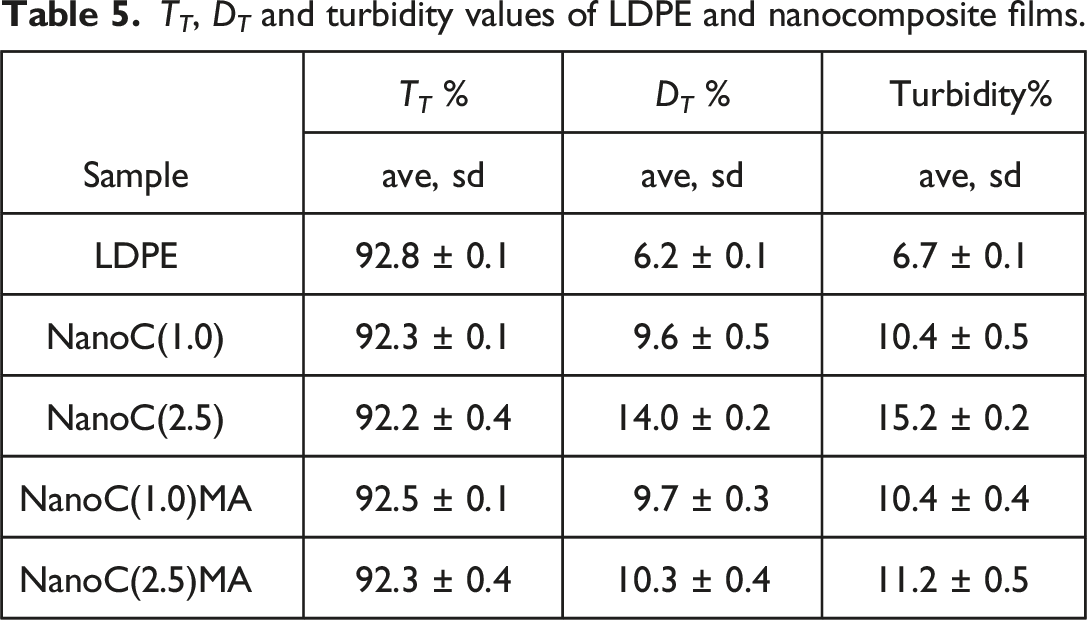
Figure 4 presents the turbidity as a bar chart. It shows that NanoC(2.5), which has 2.5 wt.% of NC, is the nanocomposite with the lowest transparency. This can probably be associated to the existence of NC agglomerates, resulting from the low compatibility between NC and LDPE. This result also explains the permeability results obtained for this sample. Turbidity of LDPE and the nanocomposite films.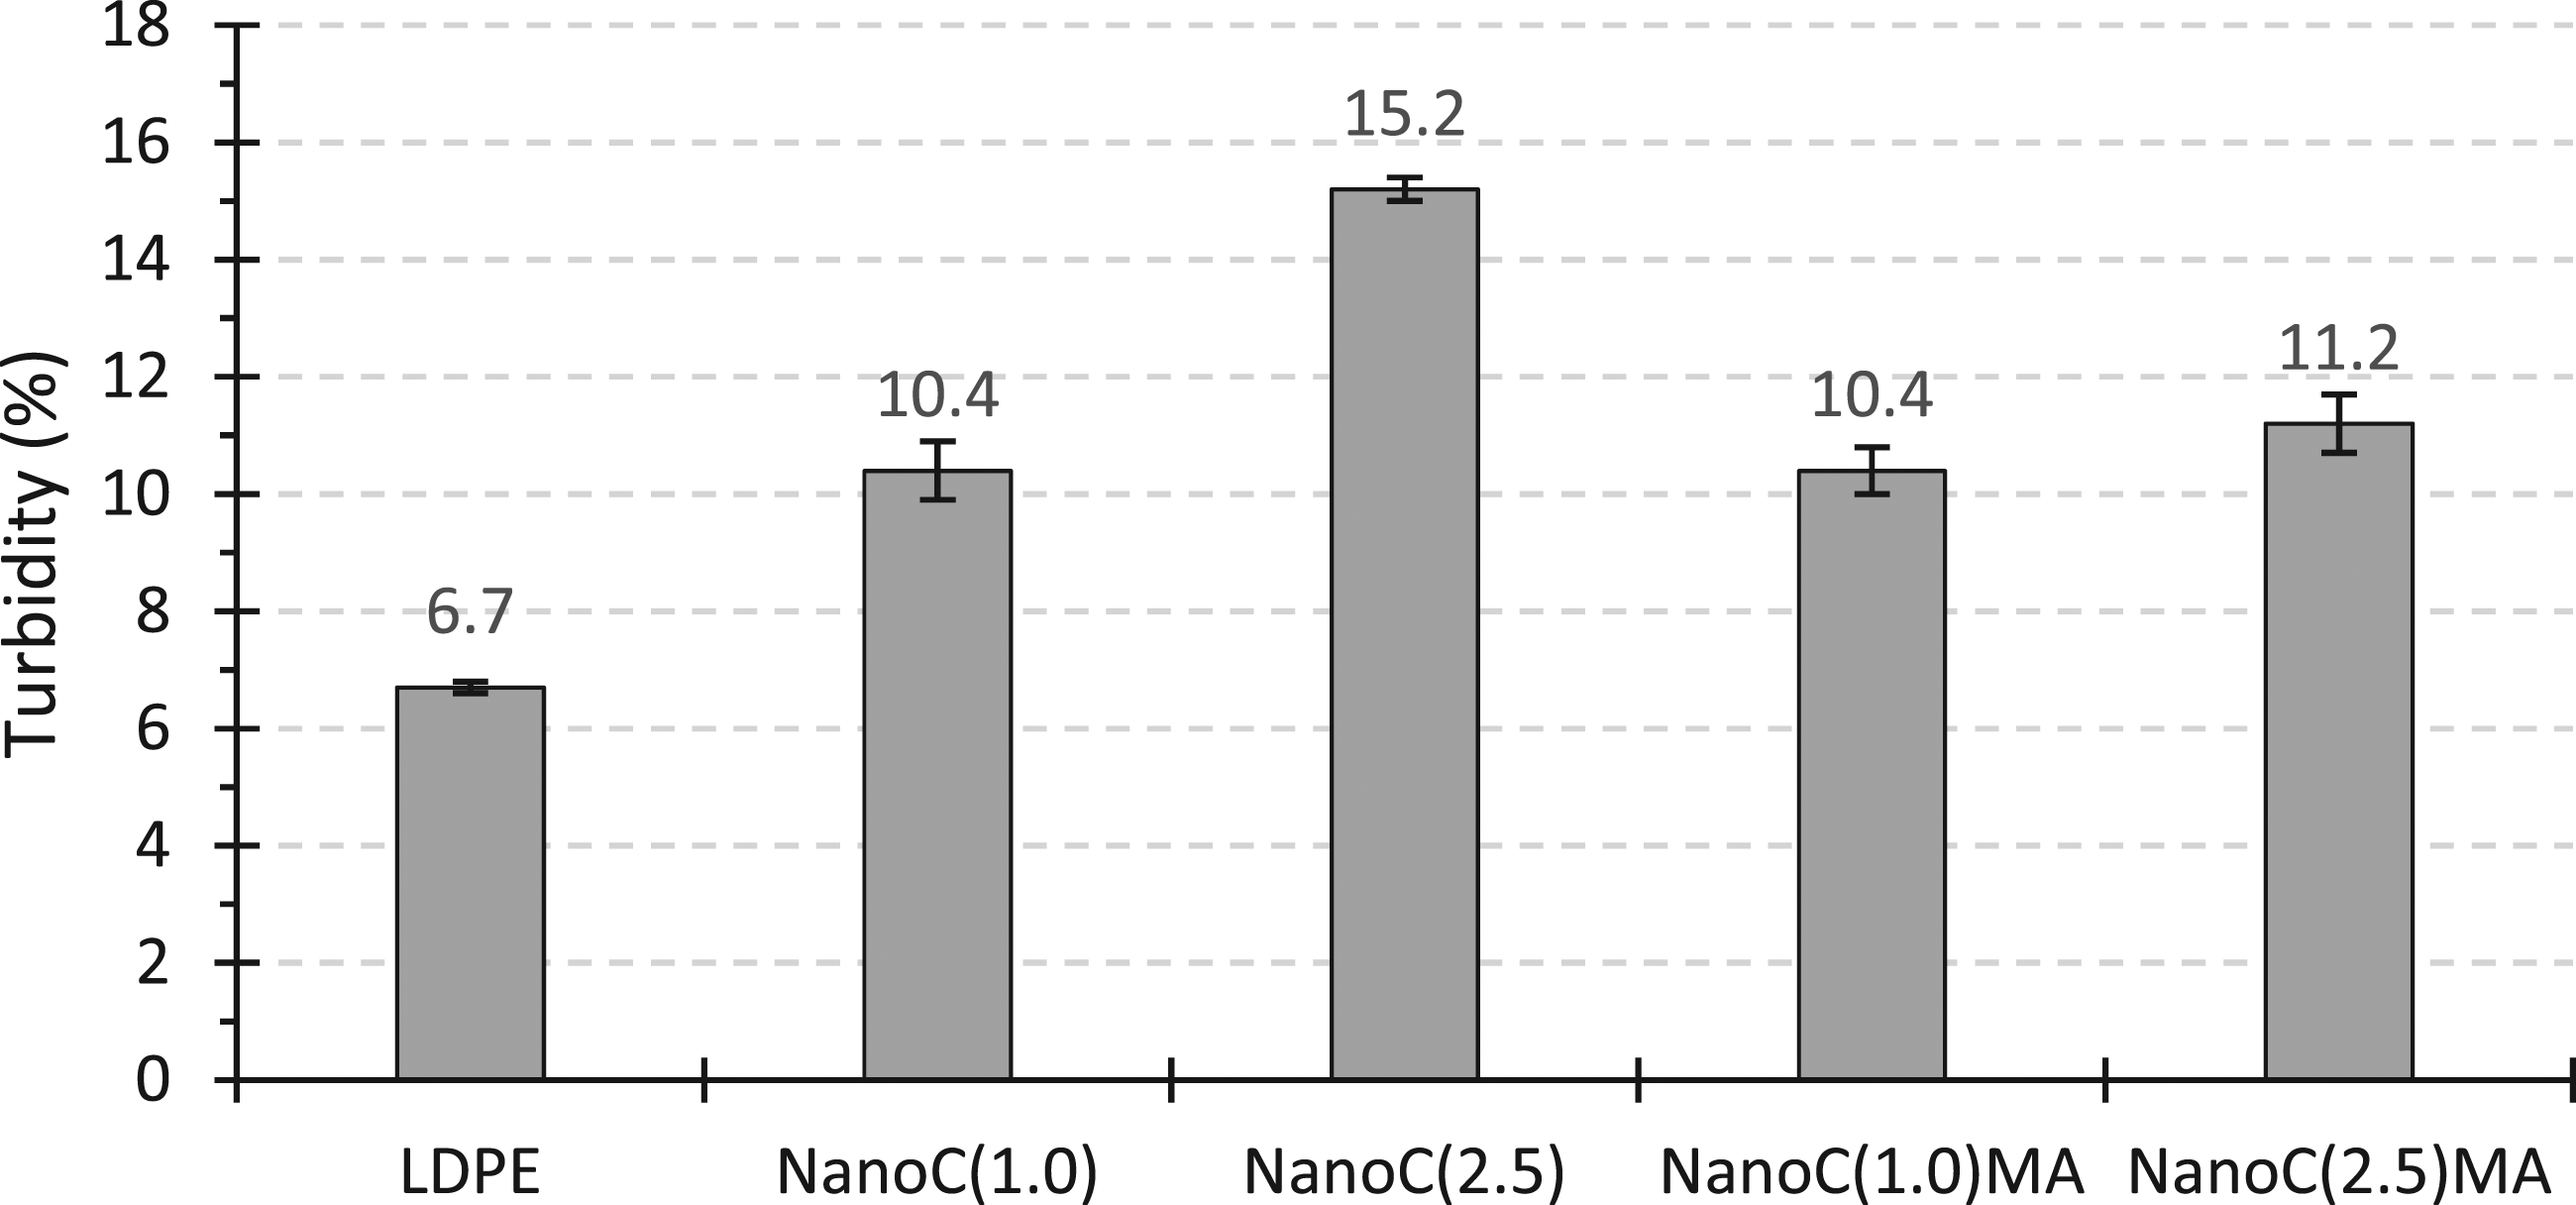
Figure 5 shows the LDPE film and NanoC(2.5) photographed when places over some text. Although NanoC(2.5) has higher turbidity, the film transparency is not sufficiently affected to prevent reading the text positioned under the films. The colour with NC is slightly brown, the brownish colour can only be noticeable when several films overlap. The film transparency for the food packaging industry is very important to capture consumer interest and, fortunately, was kept at a reasonable level. Transparency of the LDPE film (on the left) and NanoC(2.5) (on the right).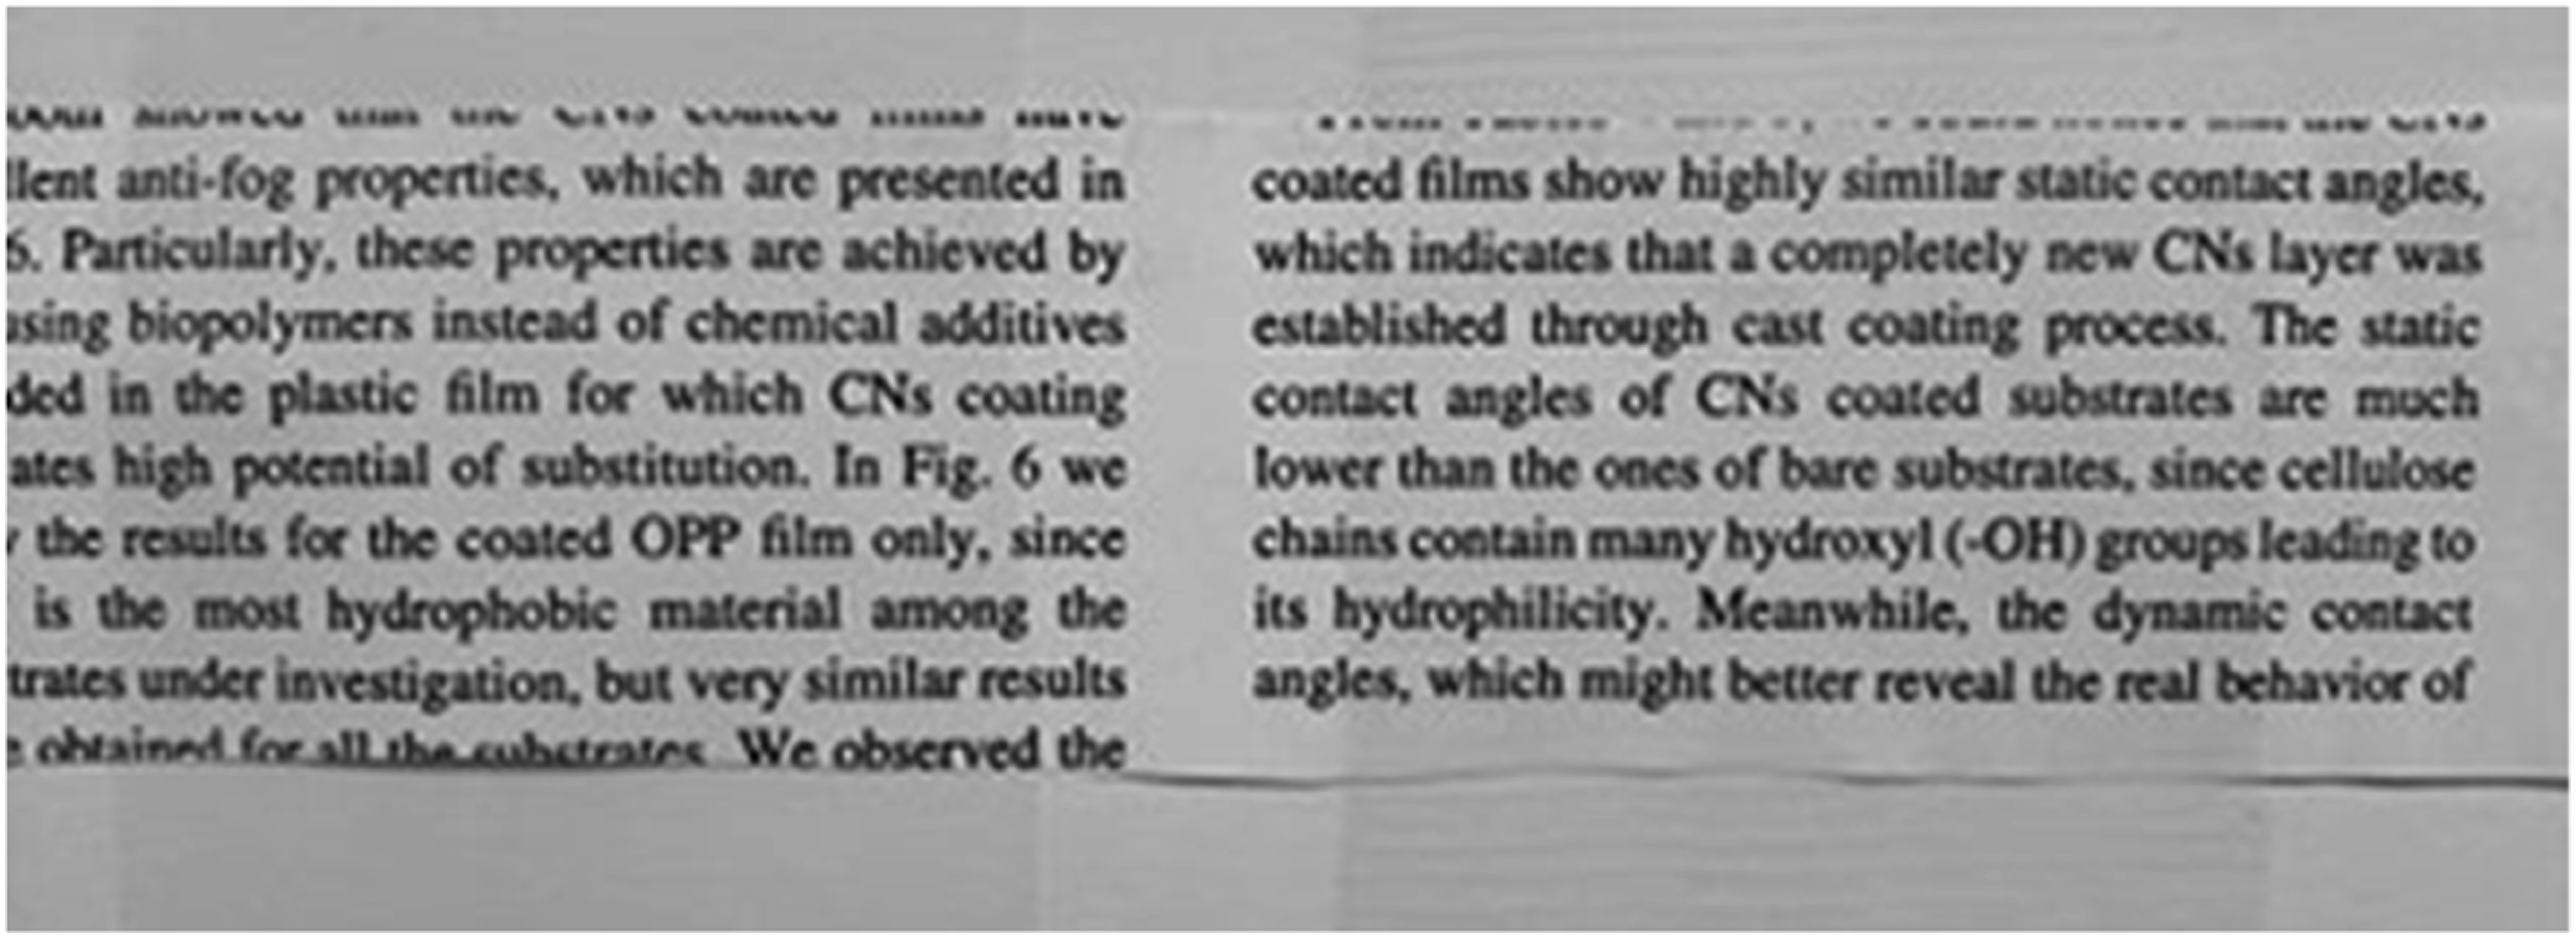
Film extrusion and post-processing
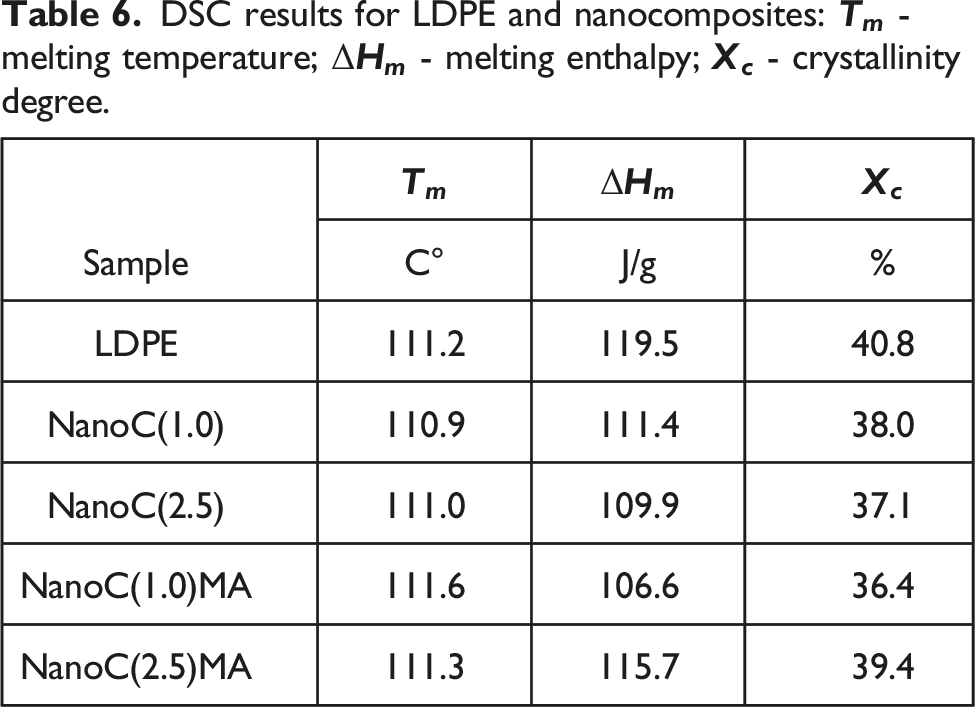
DSC results for LDPE and nanocomposites:
MFI values (Figure 6) decrease with the added compatibilizer, i.e., these samples exhibit higher shear viscosity (at least at the low shear rate values corresponding to the MFI test), indicating that the NC are effectively reinforcing the melt. SEM results also indicate higher intercalation/exfoliation when PE-g-MA was added. The same was noticed by Pedroso and Rosa study.
24
Without compatibilizer, the added NC does not affect the MFI, revealing a low interaction (compatibility) between NC and the LDPE matrix. MFI for LDPE and nanocomposites.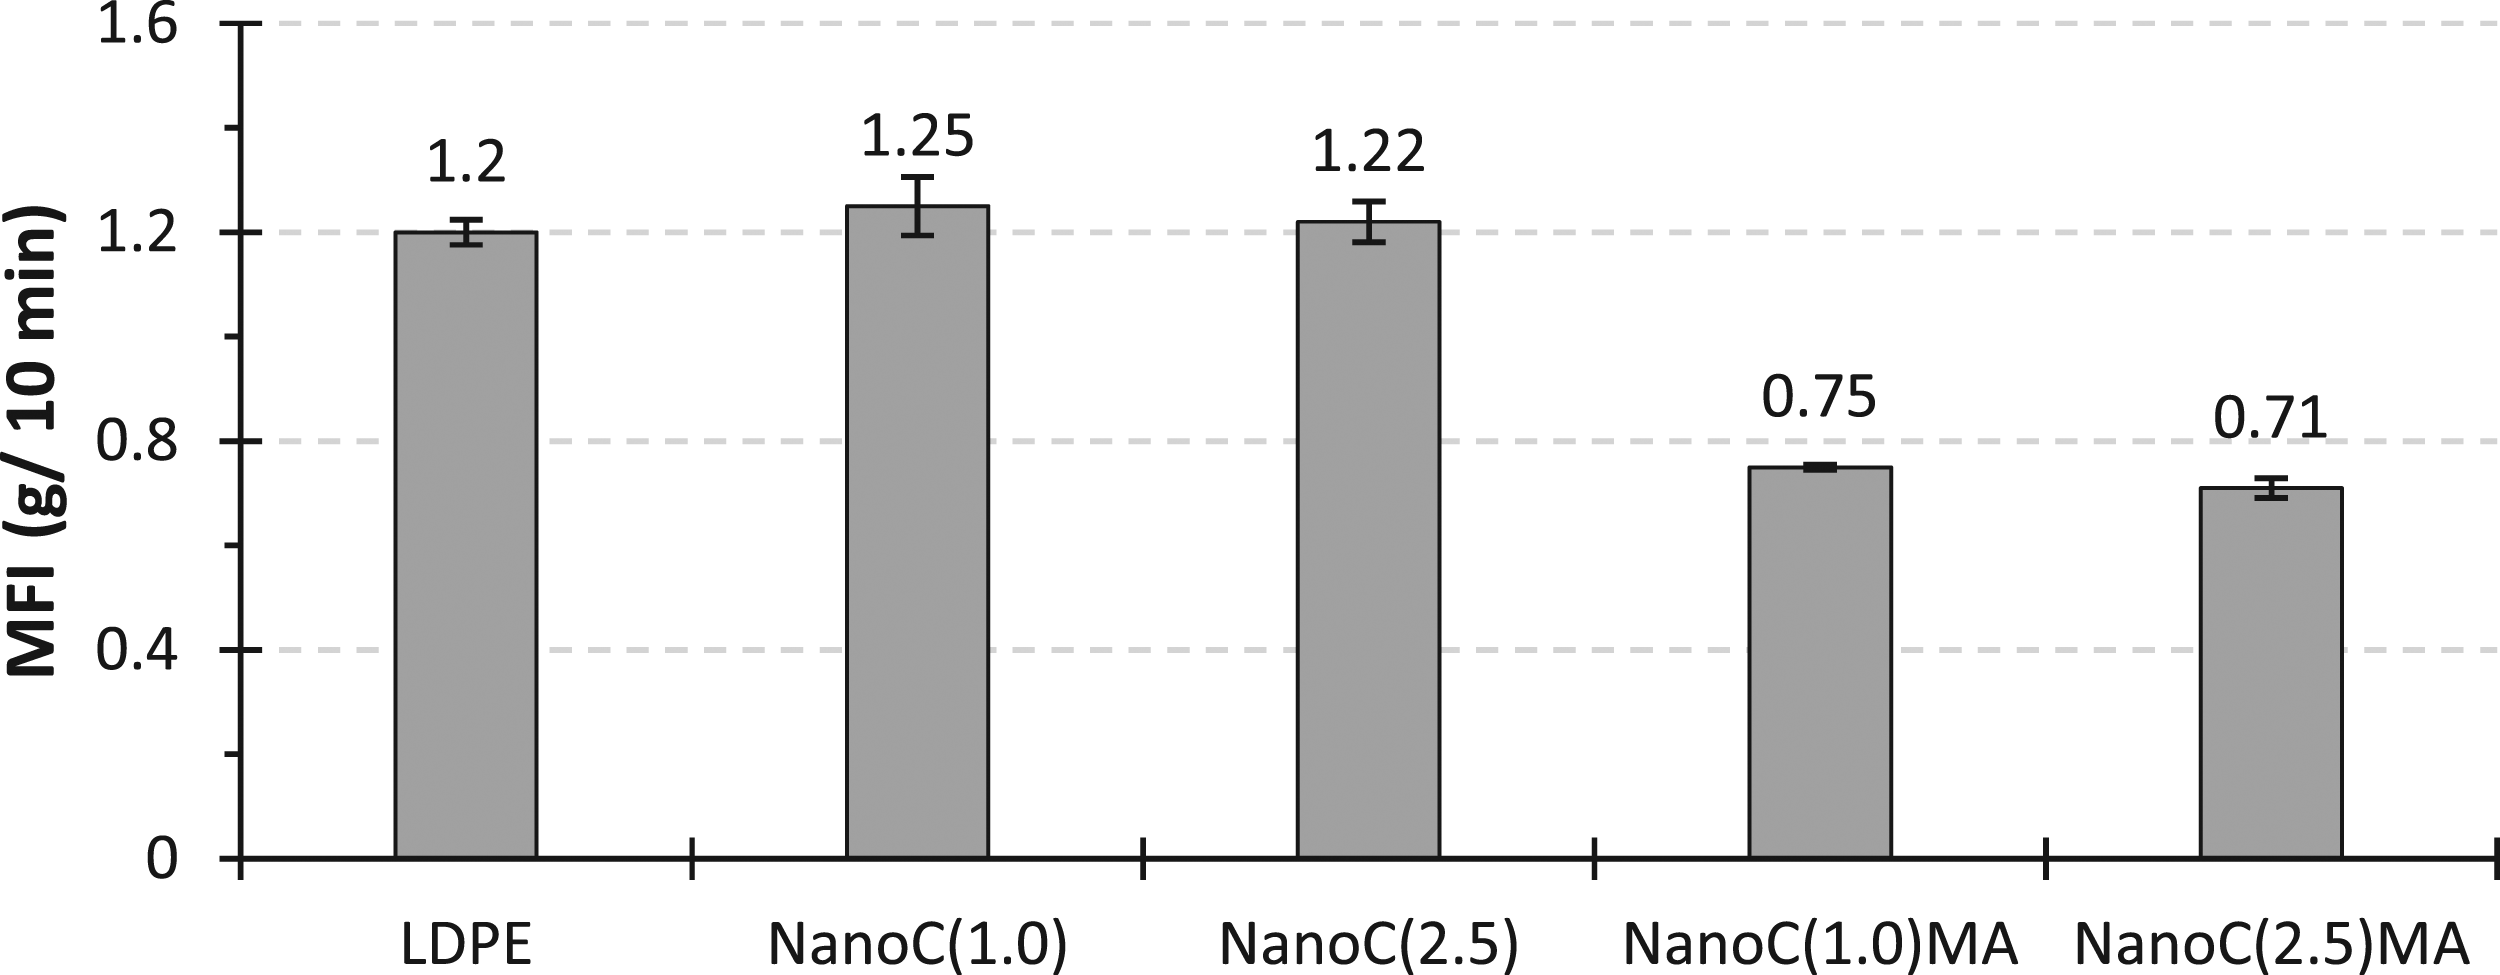
The increase in apparent viscosity of the compatibilized nanocomposites had a positive impact on film extrusion, since it is also expected to impact the melt strength, increasing the bubble stability, facilitating the extrusion process.
Maximum sealing force and contact angles of the films.
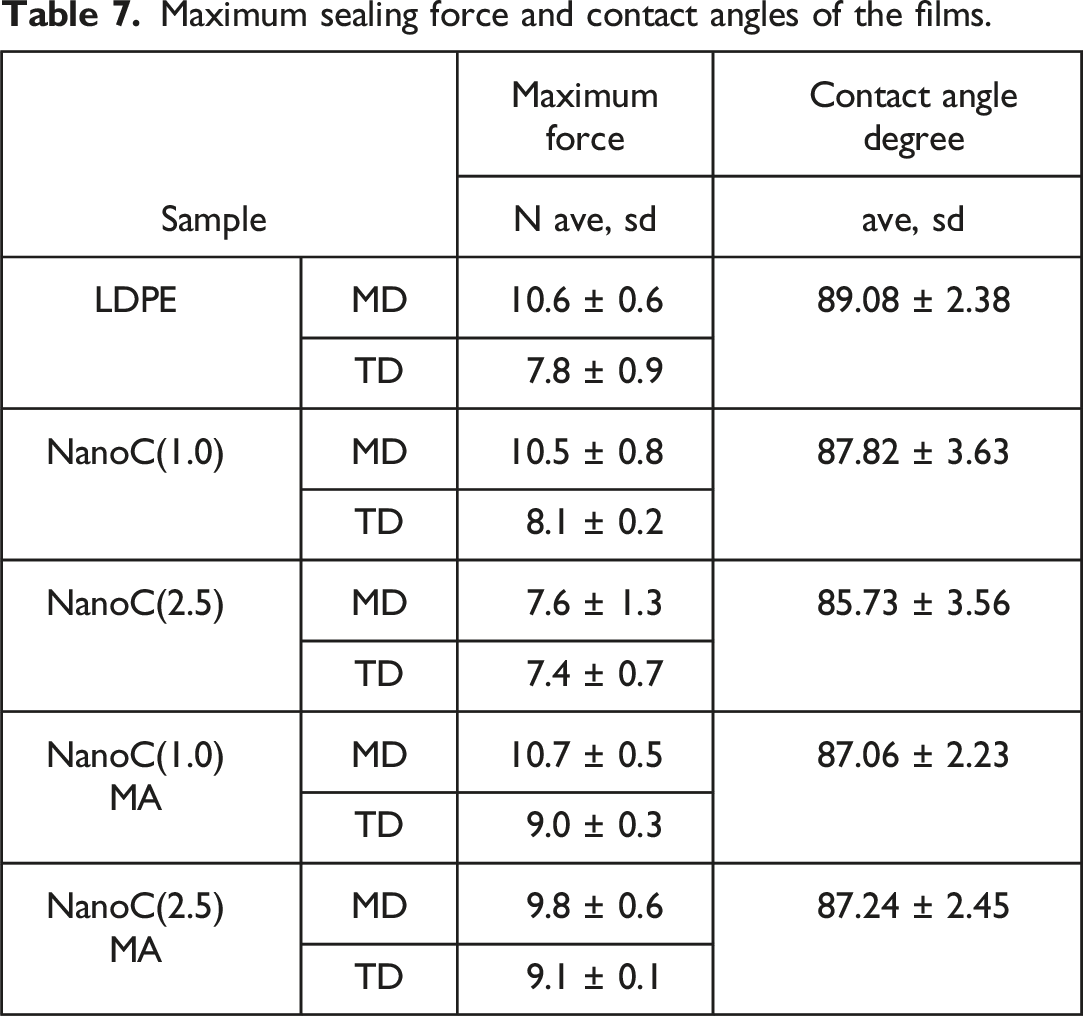
The added NC in the LDPE matrix does not change the contact angles (Table 7). These might be associate to the low NC amount at the film surface, which leaves the film topography unchanged, keeping the same contact angle.
Conclusion
LDPE/NC nanocomposite films were produced by blown film extrusion with and without compatibilizer, PE-g-MA. Through the joint analysis of several characterization techniques, it was possible to draw conclusion about the performance of the produced nanocomposites. SEM and XRD results showed that samples with the added 5 wt.% PE-g-MA present better NC dispersion and higher interlayer distance compared to samples without compatibilizer. This homogeneity allows producing films with better and more balanced mechanical properties (for the monolithic films and their heat sealing strength), and slightly better barrier properties, which were the main objective of this study. Although, the reduction in O2 permeability did not improve the barrier performance enough to replace high barrier polymers, such as EVOH.
The nanocomposite that presented the best results for structural and physical properties was NanoC(1.0)MA, with 1 wt.% NC, apart from the mechanical properties, which was NanoC(2.5)MA with 2.5 wt.% NC. Since good barrier properties are extremely important for food packaging production, the choice of a nanocomposite with better mechanical properties cannot be made at the expense of barrier properties. Thus, it was possible to conclude that the barrier properties as well as the other properties studied, to produce flexible films for food packaging, can be improved with by adding 1 wt.% NC.
While the turbidity increased with the increased NC, the film transparency was not significantly affected. Therefore, the films produced can be used in food packaging, still enabling product visualization.
Moreover, properties such as melting temperature, heat sealing temperature and contact angles were not significantly affected by the added NC or compatibilizer, preserving the conditions for packaging production.
As for future studies, it may be relevant to study the eventual migration of NC from the film to the food packaged, as the packaging must comply with the regulations on migration of substances into food imposed by the European Commission.
Footnotes
Acknowledgements
This study was supported by the project “MobFood – Mobilizing scientific and technological knowledge in response to the challenges of the agri-food market”, Reference POCI-01- 0247-FEDER-024524.
Declaration of Conflicting Interests
The author(s) declare(s) that there is no conflict of interest.
Funding
The author(s) disclosed receipt of the following financial support for the research, authorship, and/or publication of this article: This research was funded by the European Regional Development Fund (ERDF), through the Competitiveness and Internationalization Operational Program within the scope of the “Portugal 2020”.