
Abstract
This article presents a dataset from an experimental campaign investigating the out-of-plane (OOP) seismic response of unreinforced masonry (URM) gables in existing buildings. Addressing a critical gap in published research, the dataset provides novel experimental data on the incremental dynamic OOP behavior of three URM gables tested under seismic loading until full collapse. All three gables were nominally identical but differed in their interaction with the supporting roof structure. This interaction was experimentally reproduced by imposing differential motions at the top of the gables, which were either linearly amplified or both amplified and phase-shifted relative to the motion at the base. This approach ensured idealized and numerically replicable boundary conditions, making the dataset an ideal benchmark for refining existing and developing new modeling approaches for URM structures. The dataset includes measured and calculated acceleration, displacement, and force time histories. Beyond supporting the validation and development of numerical models, it can also contribute to improving guidelines for the out-of-plane seismic assessment of URM gables and is openly available for further research and engineering applications.
Keywords
Introduction
Unreinforced masonry (URM) gables are among the most seismically vulnerable components of low-rise masonry buildings, as evidenced by numerous post-earthquake damage assessments. This vulnerability is attributed to their slender geometry, weak roof connections, and exposure to amplified seismic excitation at the building apex. Their interaction with flexible roof structures, such as timber roofs, further influences their seismic vulnerability. Despite this, dedicated experimental data on their out-of-plane (OOP) behavior remain scarce, with most insights derived from tests on complete buildings with gables (Graziotti et al., 2017; Guerrini et al., 2019; Kallioras et al., 2020, 2022; Magenes et al., 2014; Miglietta et al., 2021; Tomassetti et al., 2019a), or walls with rectangular geometries (Damiola et al., 2018; Giaretton et al., 2016; Graziotti et al., 2016; Griffith et al., 2004, 2007; Messali et al., 2017; Moshfeghi et al., 2024; Penner and Elwood, 2016; Sharma et al., 2020a, 2020b; Sharma et al., 2020; Tomassetti et al., 2019b; Vaculik and Griffith, 2018), rather than isolated gables. Among the limited tests focusing on gables, their interaction with the roof was either disregarded (Candeias et al., 2016) or the roof motion was not explicitly controlled (Tomassetti et al., 2019c), making them unsuitable to be adopted as experimental benchmarks for developing, refining, and validating numerical modeling strategies.
To address this, the ERIES (Engineering Research Infrastructures for European Synergies)-SUPREME (Seismic oUt-of-Plane REsponse of Masonry gablEs) Project was established as a joint initiative of Delft University of Technology (TU Delft), the Dutch Organisation for Applied Scientific Research (TNO), the University of Pavia, and the European Centre for Training and Research in Earthquake Engineering (EUCENTRE). The project aimed to improve the understanding of the seismic OOP response of URM gables in existing buildings in their as-built configuration without any retrofit or strengthening measures. Its primary objective was to generate experimental data which can be used as benchmarks for numerical model development on the dynamic behavior of URM gables, which had been largely missing from published literature. To achieve this, incremental dynamic tests were conducted to investigate the force and displacement capacity of URM gables under OOP seismic loading. A secondary objective was to quantify the influence of roof diaphragms on the gable OOP response, specifically how roof stiffness and the effectiveness of its connections to the gables influenced the seismic performance at different damage states. It should be noted that while retrofitting measures such as reinforced-concrete tie-columns or tie-beams and steel angles connecting roof joists to gables are known to improve the seismic performance of gables, the present study focuses exclusively on evaluating the baseline as-built behavior of URM gables against which the effectiveness of such retrofit measures can be quantified in future research.
As part of this project, a testing campaign involving the incremental dynamic testing of three full-scale URM gables until complete collapse was carried out as presented in Section “The experimental campaign.” While all three gables were nominally identical, they were subjected to different seismic inputs at their top and bottom to simulate interaction with various roof typologies. The experimental specimens are described in Section “Tested URM gables.” The use of differential motions at the top and base of the gables to replicate roof interaction was enabled by an innovative test setup, detailed in Section “Test setup.” All three gables were heavily instrumented, with the instrumentation setup described in Section “Instrumentation.” The applied input motions and the adopted incremental dynamic sequence are presented in Section “Input seismic motions and incremental dynamic testing sequence.” This approach ensured idealized and numerically replicable boundary conditions, making the dataset a valuable benchmark for refining existing numerical modeling approaches for URM gables and developing new tools. This data paper ultimately presents the dataset obtained from these experiments in Section “The dataset,” providing both measured quantities (acceleration and displacement) and derived quantities (inertial force), each described in detail. The dataset, which includes the experimental data as well as video recordings of each experiment, is openly available for download from the Built Environment Data database at https://doi.org/10.60756/euc-1avy7q49. Finally, the concluding remarks are summarized in Section “Concluding remarks.”
The experimental campaign
The experimental campaign of the ERIES-SUPREME project involved the incremental dynamic testing of three full-scale URM gables until complete collapse. The tests were conducted at the EUCENTRE laboratory in Pavia, Italy, using the 9DLAB facility. This advanced seismic testing system features a dual shake-table setup, where the top and bottom tables can apply differential input motions across nine degrees of freedom. While the 9D LAB, with its in-plane dimensions of 4.8 × 4.8 m, allowed for full-scale masonry gable testing, it could not accommodate an entire roof diaphragm. To account for the influence of roof stiffness on the gable response, variations in the input motion applied to the top table were introduced. Specifically, three different roof configurations were considered within the same experimental campaign: a stiff roof (Gable1-STIFF), a semi-rigid roof (Gable2-SEMIFLEX), and a flexible roof (Gable3-FLEX). The input motions applied at the bottom table were identical for all three gables, while the motion at the top table varied for each specimen:
Gable1-STIFF: The motion at the top and bottom tables was the same, simulating interaction with a stiff roof diaphragm.
Gable2-SEMIFLEX: The motion at the top table was linearly amplified relative to the bottom table, simulating interaction with a semi-rigid roof diaphragm.
Gable3-FLEX: The motion at the top table was both amplified and out of phase with the bottom table, representing interaction with a flexible roof diaphragm.
Tested URM gables
The tested specimens were identical full-scale URM gable walls with a triangular shape, a base length of 6 m, and a height of 3 m (Figure 1). They were constructed on a composite steel-concrete foundation. Each gable was built using solid clay bricks with average dimensions of 230 × 105 × 55 mm, resulting in a wall thickness of 105 mm. The masonry was laid in 45 courses with 10-mm-thick mortar joints. In addition, five joist pockets were incorporated to accommodate timber beams with a cross-section of 100 × 200 mm. Each beam was subjected to an approximate load of 4.5 kN, simulating the vertical load exerted by the roof diaphragm, leading to a total vertical load of 22.5 kN on the gable. This load is representative of half the weight of a roof diaphragm, consistent with the geometry of the specimen. The tested gable represents one of two end gables in a roof structure where the total roof weight is shared equally, with each gable bearing half of the load. The beams also facilitated the application of lateral loads along the specimen height, as detailed in the following sections. The timber-to-masonry connections relied solely on friction, with the timber joists placed into the joist pockets to their full depth only after the masonry had fully cured. Mechanical characterization of all specimen materials was conducted and is also accessible at https://doi.org/10.60756/euc-1avy7q49.
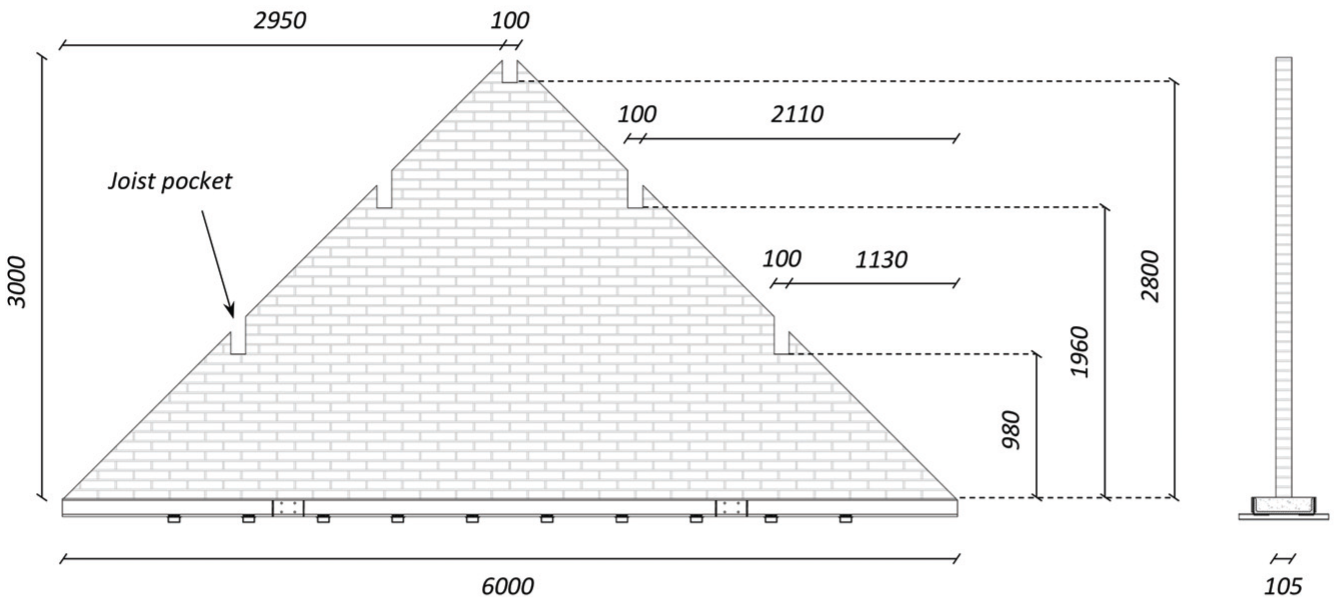
Geometry of the tested URM gables (units of mm).
Test setup
The experimental setup featured a dual shake-table configuration, with a top and bottom table designed to apply differential input motions (Figure 2). A custom steel loading frame was constructed to transmit accelerations along the height of the gable through five horizontal loading arms, each hinged to the frame. Timber beams were attached to the steel arms using screws to replicate the behavior of timber joists commonly found in real roof structures.
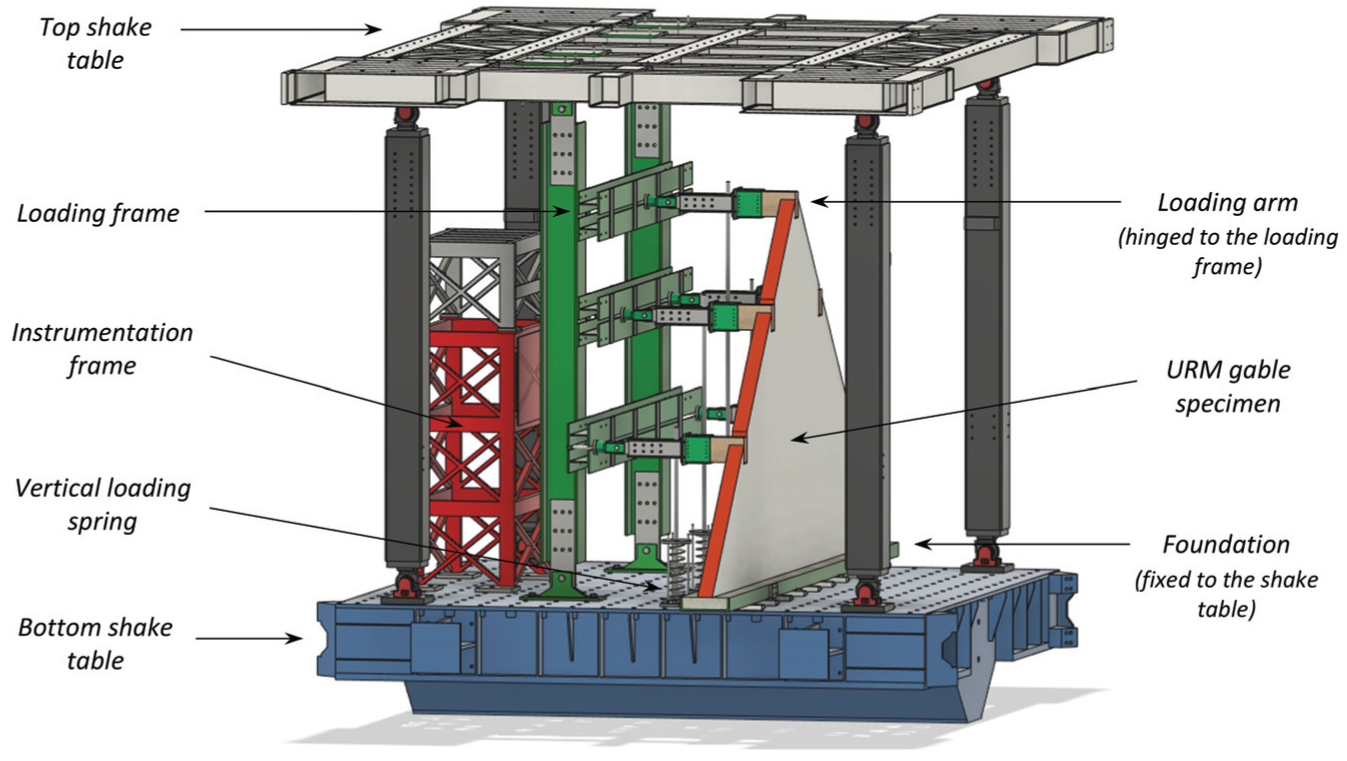
Three-dimensional view of the testing setup.
To prevent any unintended increase in out-of-plane stiffness and strength, the loading frame was hinged at both the top and bottom shake tables. The gable foundations were securely fixed to the bottom shake table using steel bolts. A rigid instrumentation frame, anchored to the bottom shake table, completed the setup, providing a fixed reference point for measurements and supporting the instrumentation system.
A system of five springs, one per loading arm, was used to apply vertical loads that simulated the weight of the roof. These vertical loads were applied by pulling down the horizontal steel arms with steel bars connected in series with the springs. The stiffness of the springs (≈ 50 N/mm) was calibrated to prevent excessive increases in the vertical load applied to the timber beams, even as the gable approached collapse. Deformations and the corresponding vertical loads exerted by the springs on the timber beams were continuously monitored throughout testing, providing essential data to support numerical modeling of these benchmark experiments.
Instrumentation
The instrumentation for each specimen included accelerometers, traditional potentiometers, wire potentiometers, and a 3D optical acquisition system. Instrument placement was determined based on the expected deformed shapes and cracking patterns of the gables. Accelerometers were installed on the gable specimens to record acceleration-time histories, with additional units placed on the loading and instrumentation frames, as well as on the specimen foundation. The accelerometers used were silicon Micro-Electro-Mechanical Systems (MEMS)-based devices with a nominal bandwidth of 0–200 Hz. Traditional potentiometers measured the elongation or shortening of the springs and the relative displacements between the timber beams and the masonry. Wire potentiometers, mounted on both the loading and instrumentation frames, recorded gable displacements. The optical monitoring system played a crucial role in maintaining dense instrumentation during high-intensity shake-table tests, when some traditional instruments had to be removed to prevent collateral damage. It was used to measure displacements on the free surface of the gable, opposite to the loading frame, ensuring continuous and detailed data acquisition. This comprehensive instrumentation scheme (illustrated for each of the three specimens in Figure 3) resulted in 165 different time histories of displacements and accelerations recorded for the gables until their complete collapse. The numbers shown in Figure 3 correspond to the instrument identifiers used for dataset organization, as explained in more detail in Section “The dataset.”
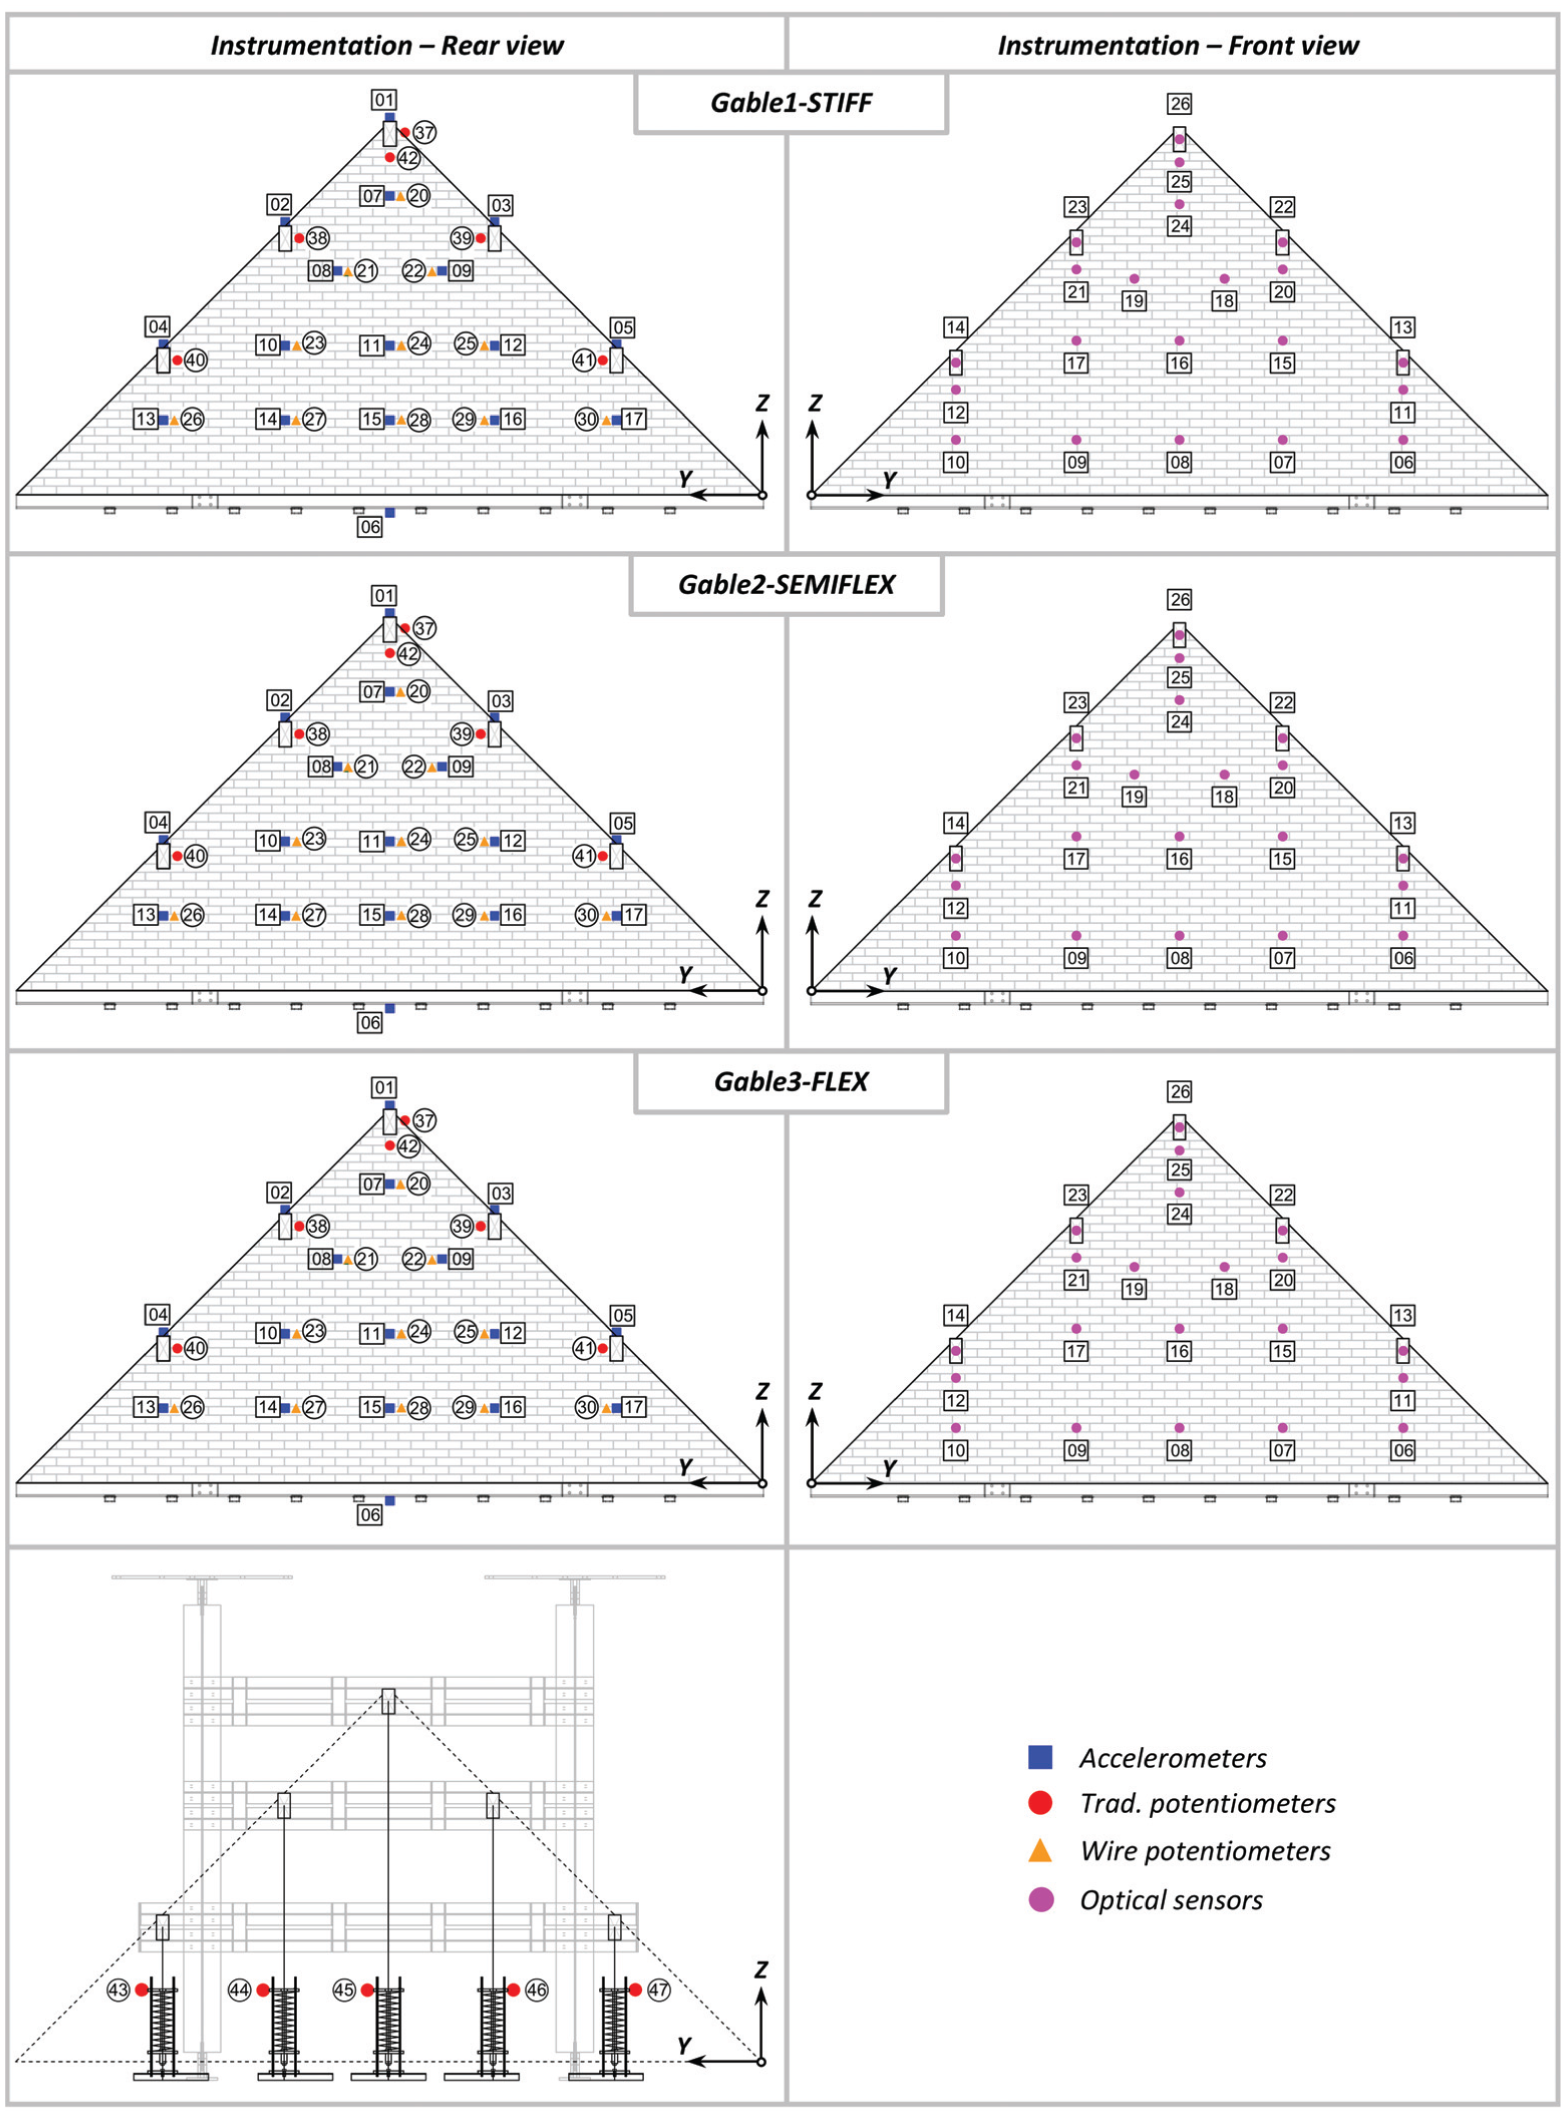
Rear and front views of the instrumentation used for Gable1-STIFF, Gable2-SEMIFLEX, and Gable3-FLEX.
Input seismic motions and incremental dynamic testing sequence
The input motions applied at the top and bottom tables were selected to represent two alternative floor motions (FM) scenarios: induced seismicity and tectonic seismicity. For the induced seismicity scenario (FM1), finite element-based numerical analyses were conducted on a typical URM building from the Groningen region of the Netherlands. The analyses considered the building in its as-built condition with a flexible timber roof, as well as in two retrofitted configurations: one with a stiff concrete roof and another with a semi-flexible timber-strengthened roof. For the tectonic seismicity scenario (FM2), input motions were derived from recordings of the 2016 Central Italy earthquake, obtained from a monitored masonry building at the attic floor level. In this case, the gable-roof interaction was modeled using a representative elastic single-degree-of-freedom system, featuring a fundamental mode of vibration with a period of 0.5 s and a damping ratio of 5%. Further details on the selection of input signals can be found in Mirra et al. (2025).
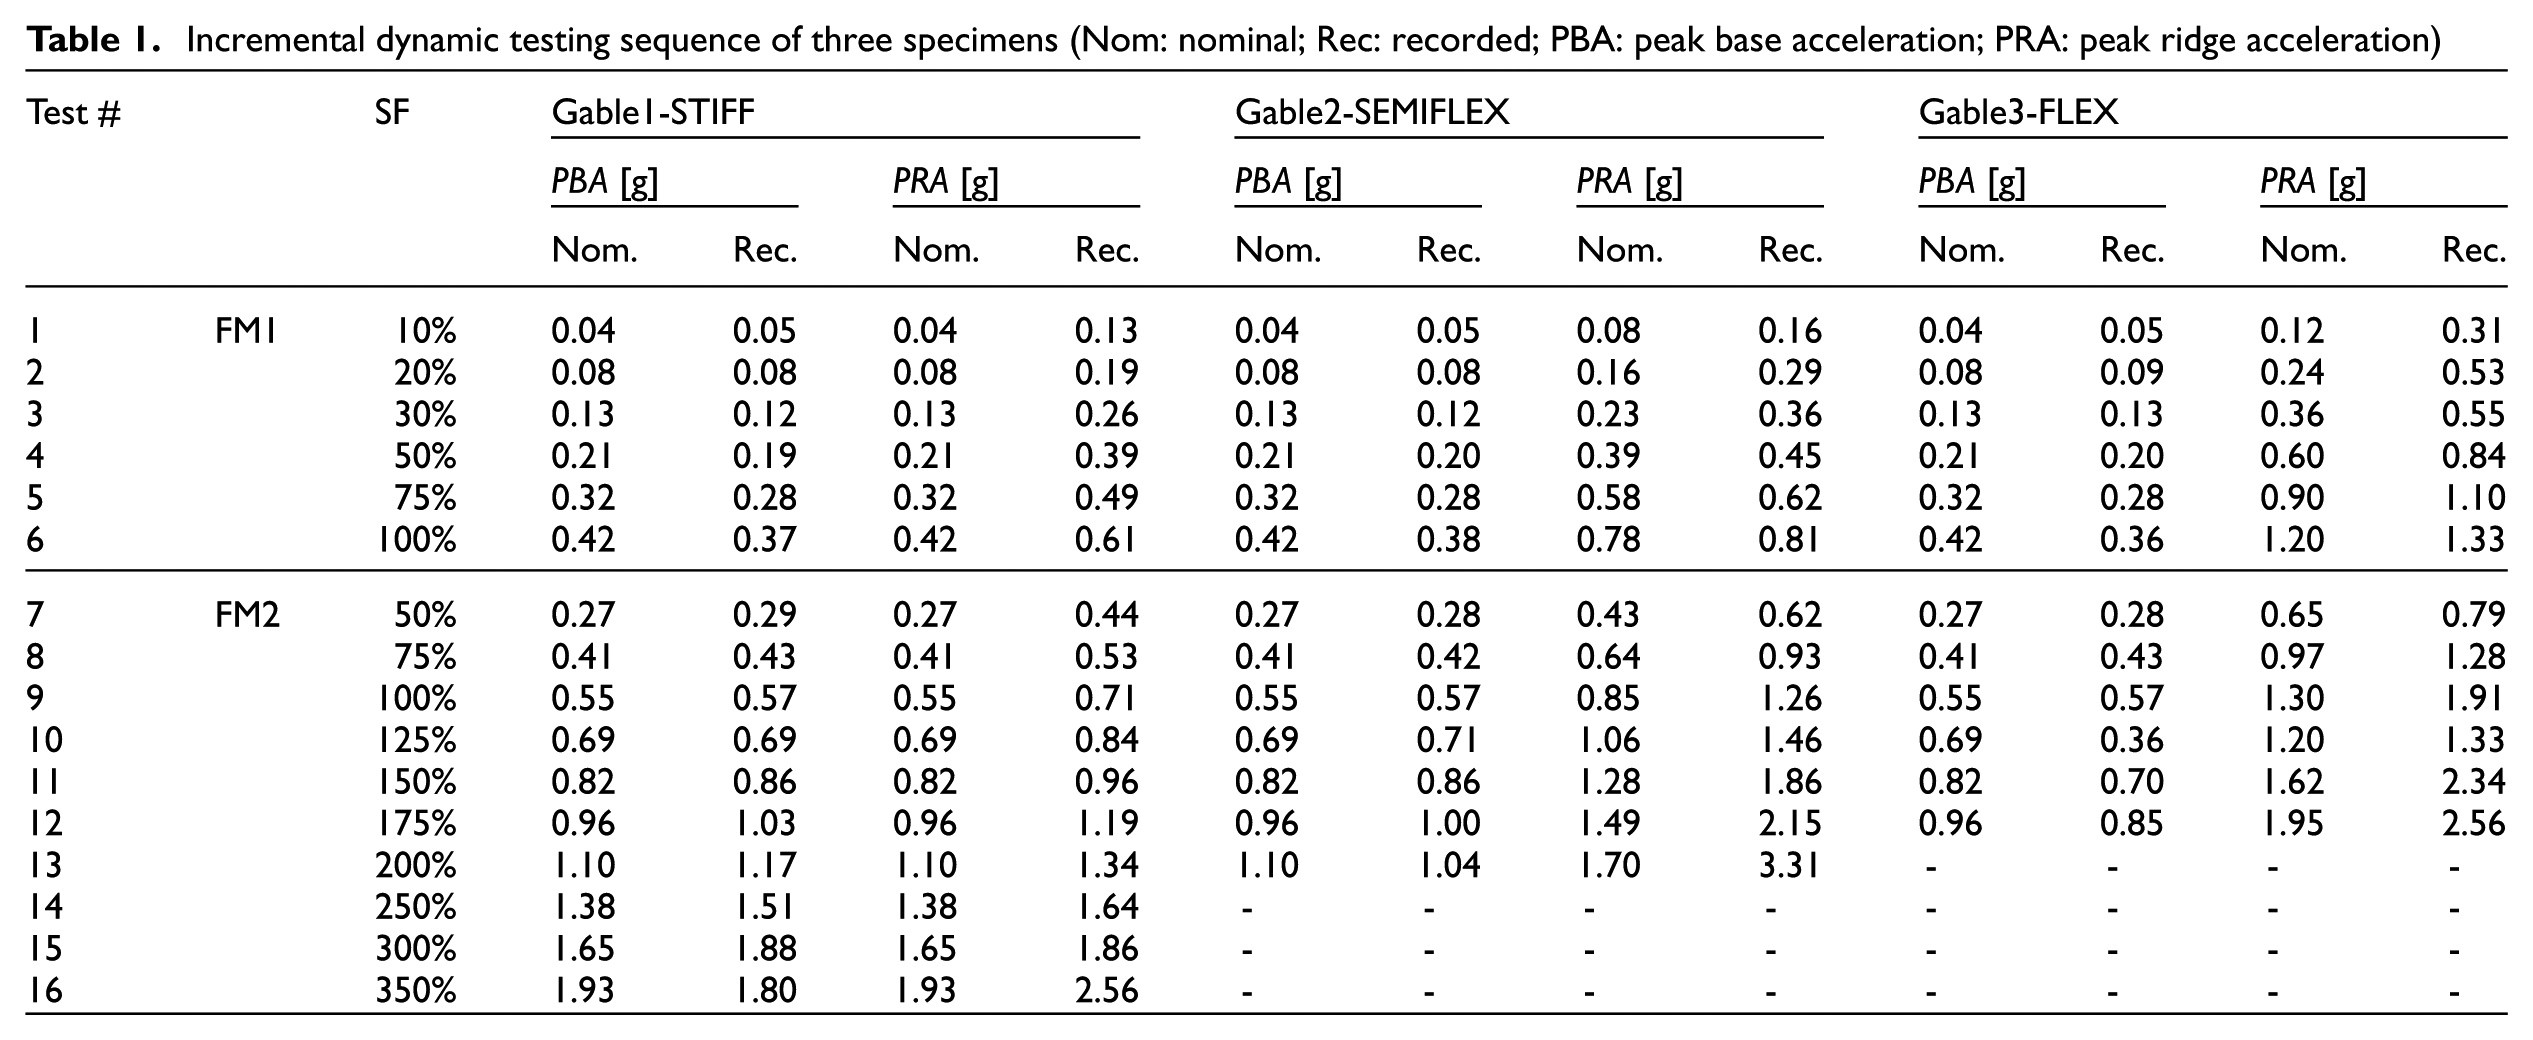
All three gables were tested using an incremental dynamic approach, where the input motions on both the top and bottom shake tables were linearly scaled by a scaling factor (SF) until complete collapse. The testing sequence applied to each gable, including the scaling factors (SF), peak base acceleration (PBA), and peak ridge acceleration (PRA), is summarized in Table 1. It should be noted that for Gable3-FLEX, an additional shake-table test at 100% FM1 was conducted after Test #9 (i.e. the 100% FM2 run) to evaluate its ability to withstand an induced seismic motion corresponding to the highest PBA expected as per the current hazard model for Groningen, the Netherlands after sustaining damage from tectonic motion.
Incremental dynamic testing sequence of three specimens (Nom: nominal; Rec: recorded; PBA: peak base acceleration; PRA: peak ridge acceleration)
The dataset
The data from the experimental campaign is provided in .txt/.csv files, with each column containing either measured or computed data. A separate .txt/.csv file is available for each test, with filenames indicating the corresponding test (Table 1). Videos of each run in the testing sequence are also included in the shared directory which can be downloaded at https://doi.org/10.60756/euc-1avy7q49. All acquired data were filtered for frequencies above 48 Hz. Displacements are expressed in [mm], accelerations in [m/s2], and forces in [kN]. Note that the displacement measurements include residual values, as the displacements recorded were intentionally not reset to zero at the end of each testing run in the testing sequence (Table 1). When instruments were offline, their values are recorded as “not a number” (NaN), including during the final part of the last run after the specimen had collapsed.
Organization of the data
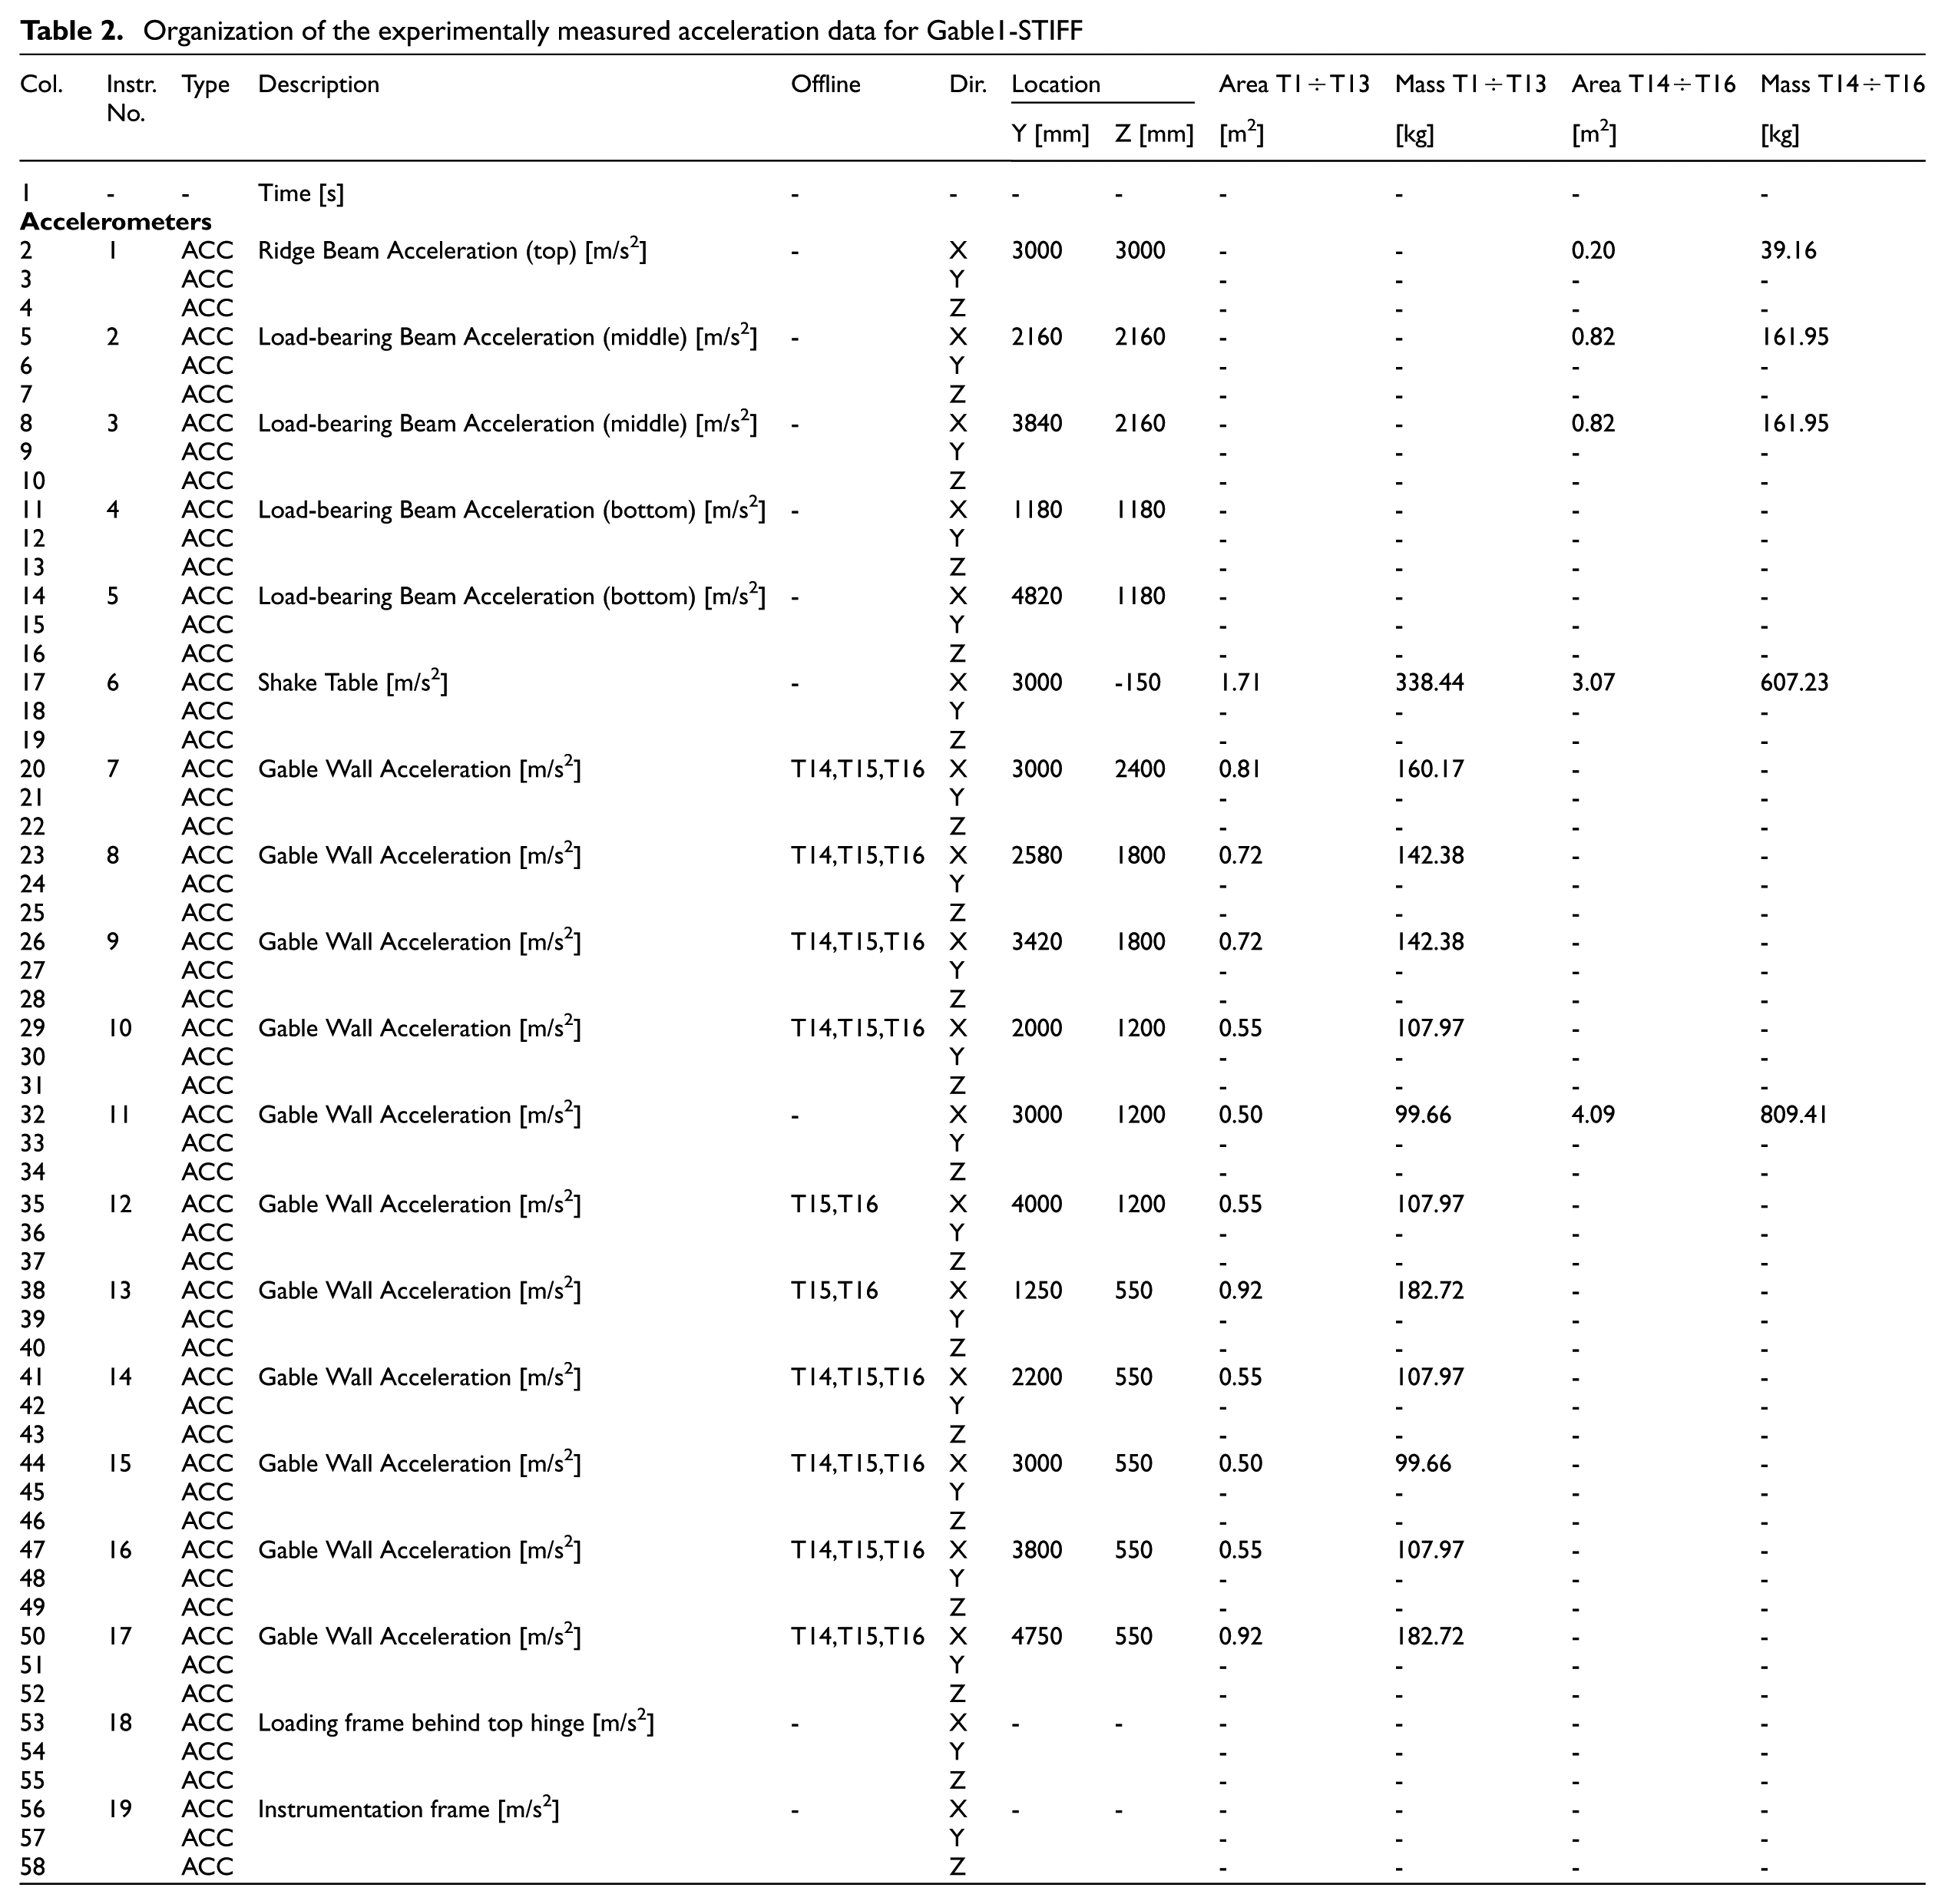
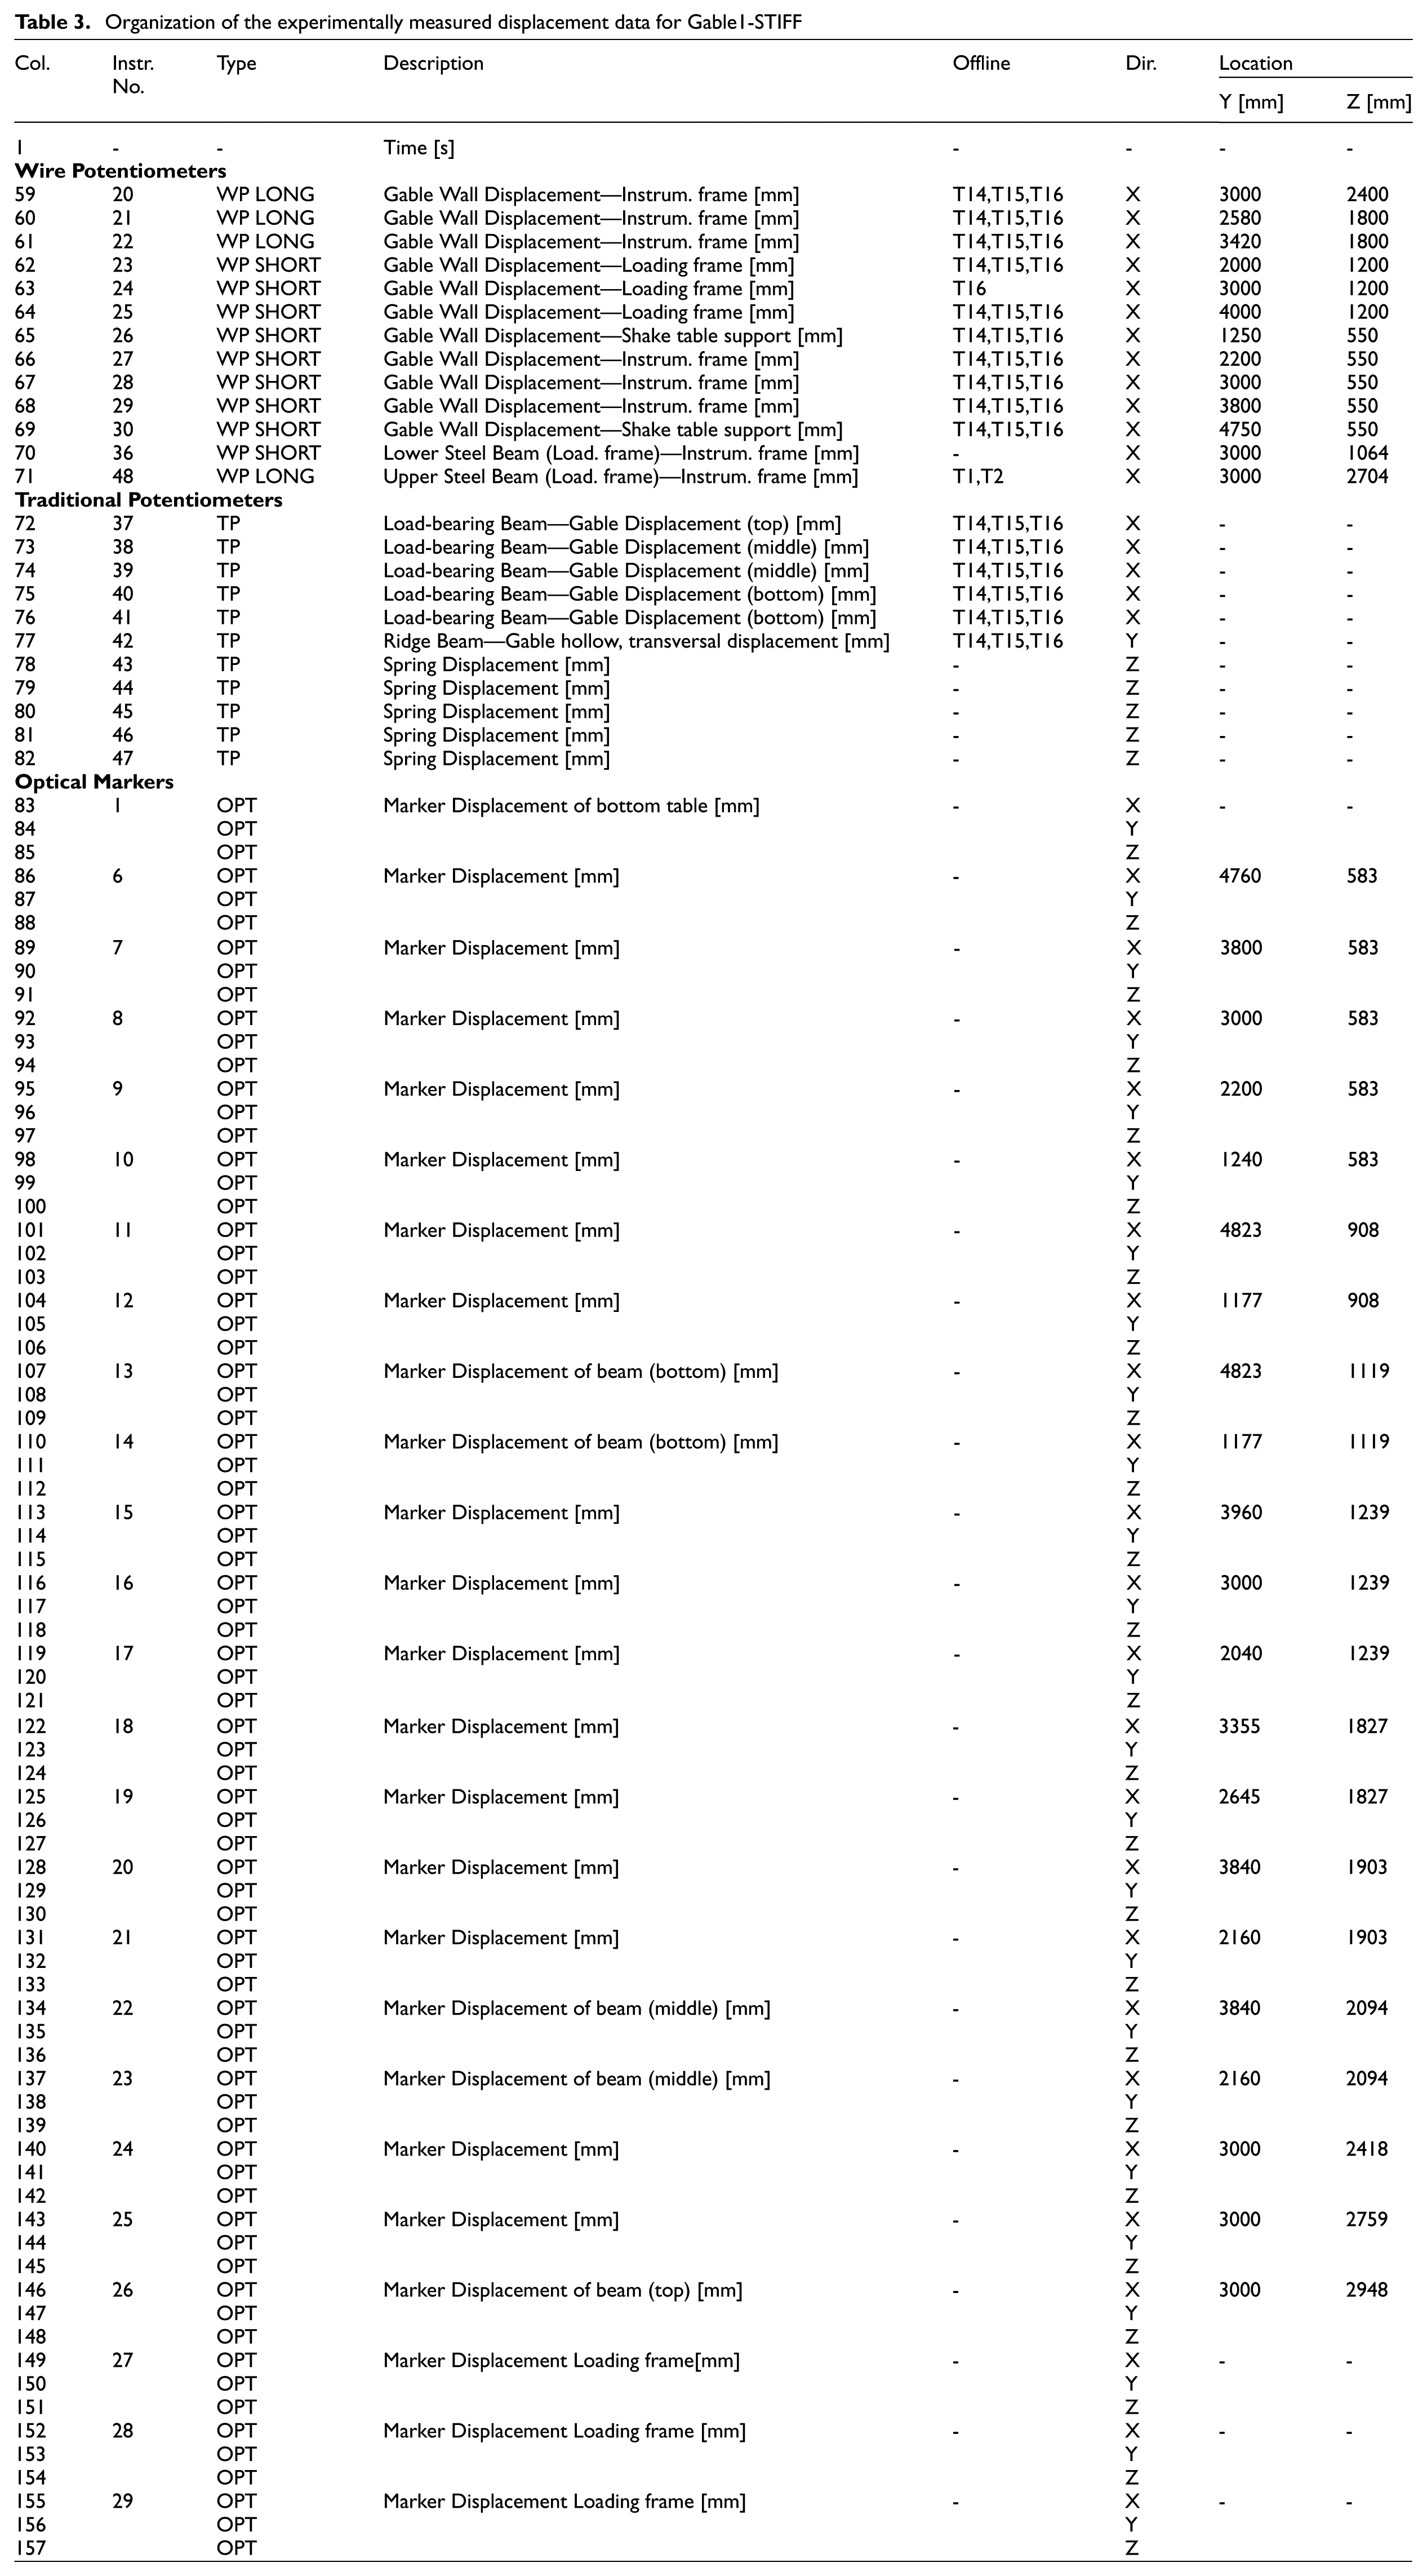
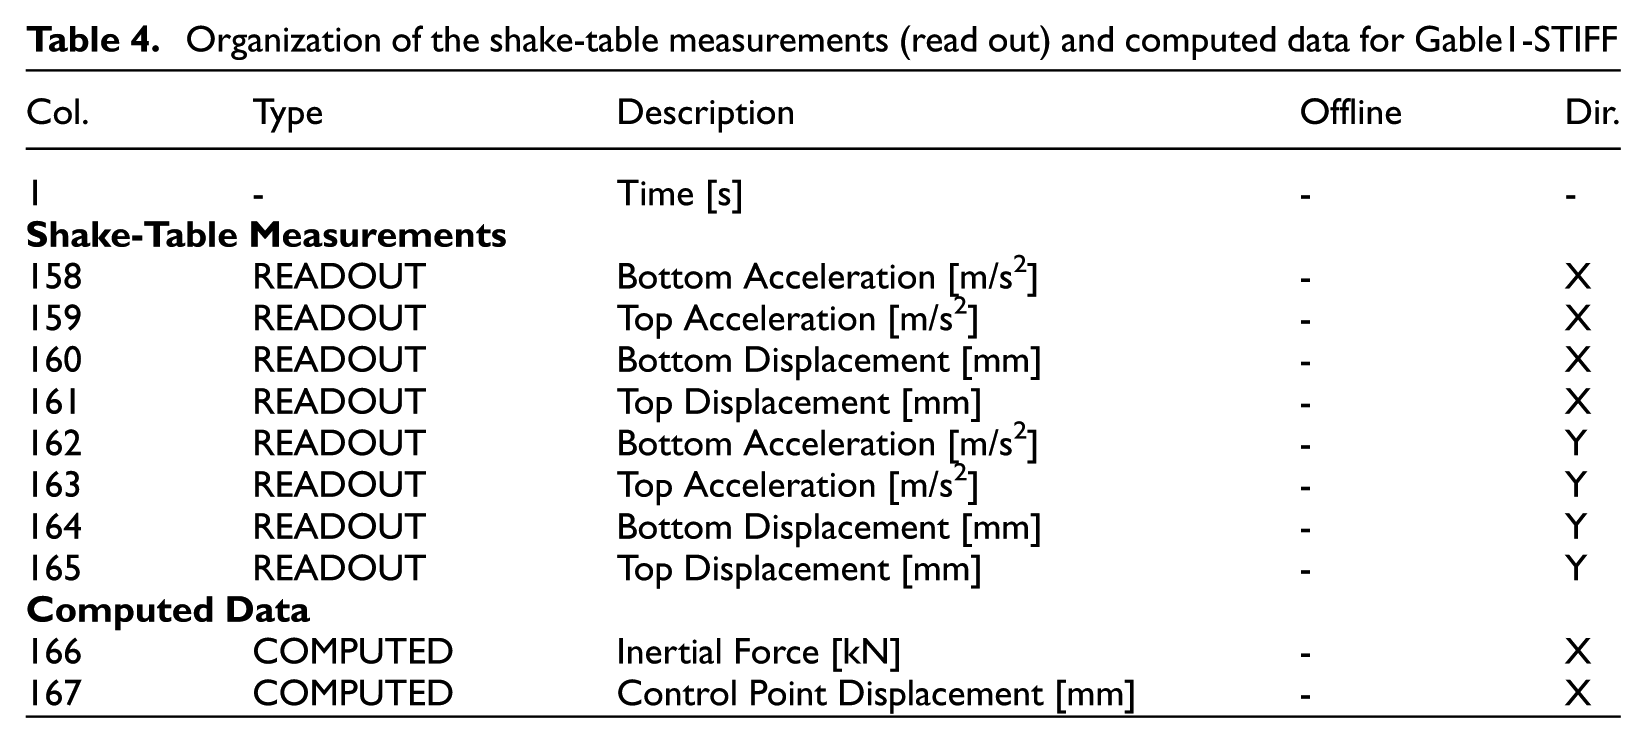
The organization of the .txt/.csv files, specifically the data stored in each column, is summarized in Tables 2 to 4 for Gable1-STIFF as an example. The same tables for Gable2-SEMIFLEX and Gable3-FLEX are available for download at https://doi.org/10.60756/euc-1avy7q49. In these tables, the “Col.” column refers to the column number in the data matrix, while “Instr. No.” indicates the instrument number in Figure 3. The “Type” column specifies the instrument type, which can be an accelerometer (ACC), traditional potentiometer (TP), wire potentiometer with 1000 mm maximum elongation (WP LONG), wire potentiometer with 250 mm maximum elongation (WP SHORT), and optical measurement (OPT). In addition, the dataset includes the directly measured acceleration, velocity and displacement readouts (READOUT) from both the top and bottom shake tables, and computed data (COMPUTED), such as inertial force or control point displacement. The “Description” column provides a brief explanation of the instrument location, and the “Offline” column lists the test numbers during which the instrument was not recording. The “Dir.” column indicates the measurement direction, while Location refers to the instrument coordinates in the gable plane. Finally, “Area T#” and “Mass T#” correspond to the area distribution and mass values assigned in test T#, respectively. These values are used to compute the inertial force associated with the URM gable, as detailed in Section “Computed data,” and are included in the dataset.
Organization of the experimentally measured acceleration data for Gable1-STIFF
Organization of the experimentally measured displacement data for Gable1-STIFF
Organization of the shake-table measurements (read out) and computed data for Gable1-STIFF
All optical measurements are post-processed to be relative to the base/lower shake table. Potentiometers measure relative displacements between the two locations they are connected to, which are specified in Table 3. The sign conventions for each instrument type are as follows. For accelerometers (ACC) and optical measurements (OPT), a positive sign (+) indicates movement toward the loading frame (−x), while a negative sign (−) represents movement away from the loading frame (+x). For traditional potentiometers (TP) and wire potentiometers (WP), a positive sign (+) corresponds to elongation (+x), whereas a negative sign (−) indicates shortening (−x).
Computed data
In addition to the measured data, the dataset includes two computed quantities: (1) the displacement of a control point and (2) the inertial force associated with the gable at each stage of the incremental dynamic testing. This section outlines the procedure adopted to compute these quantities. Plotting inertial force against control point displacement allows for the evaluation of the gable hysteretic force-displacement response.
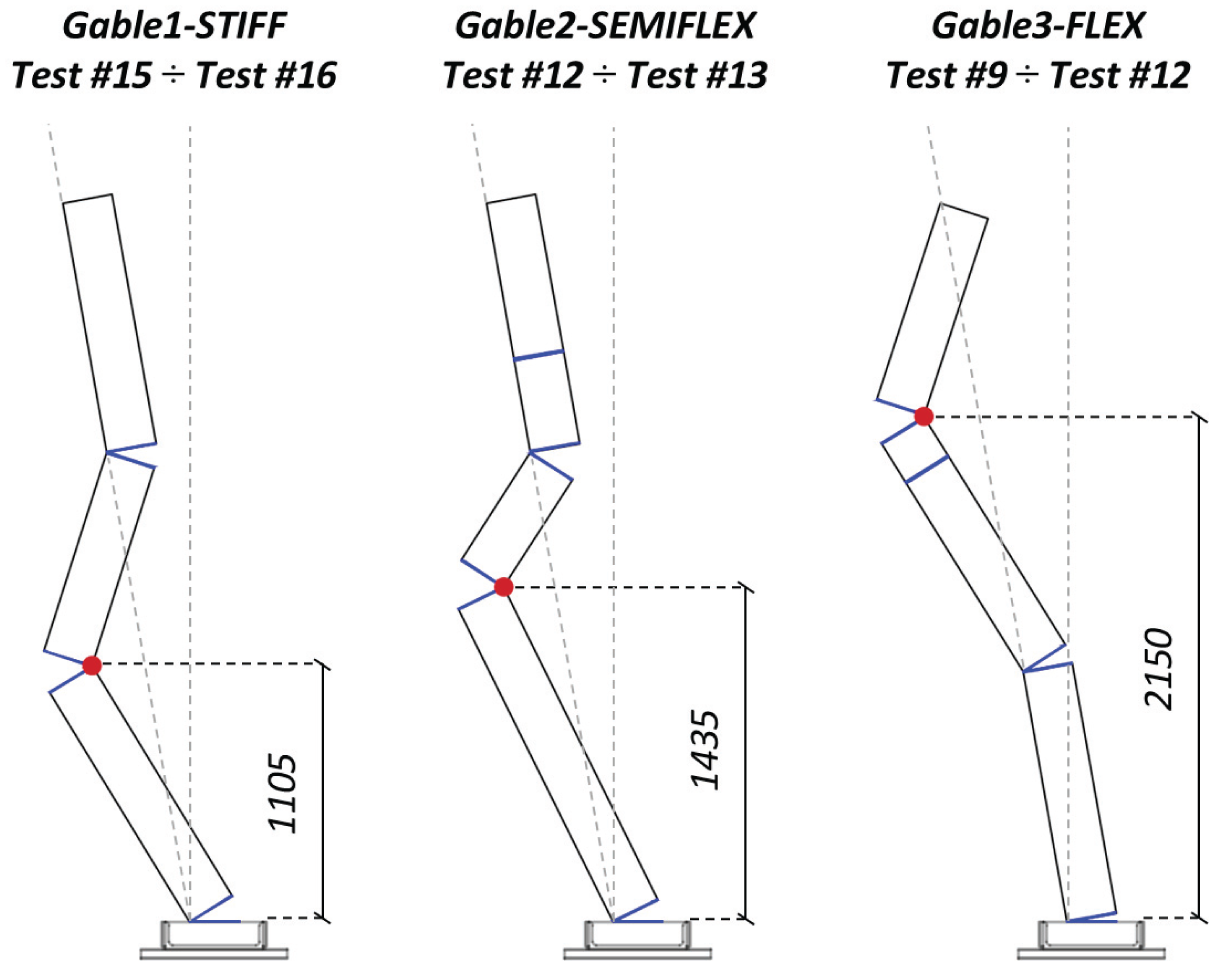
Location of the control points (red marker) for Gable1-STIFF, Gable2-SEMIFLEX, and Gable3-FLEX after the development of the collapse mechanism, with the corresponding test numbers indicated (units of mm).
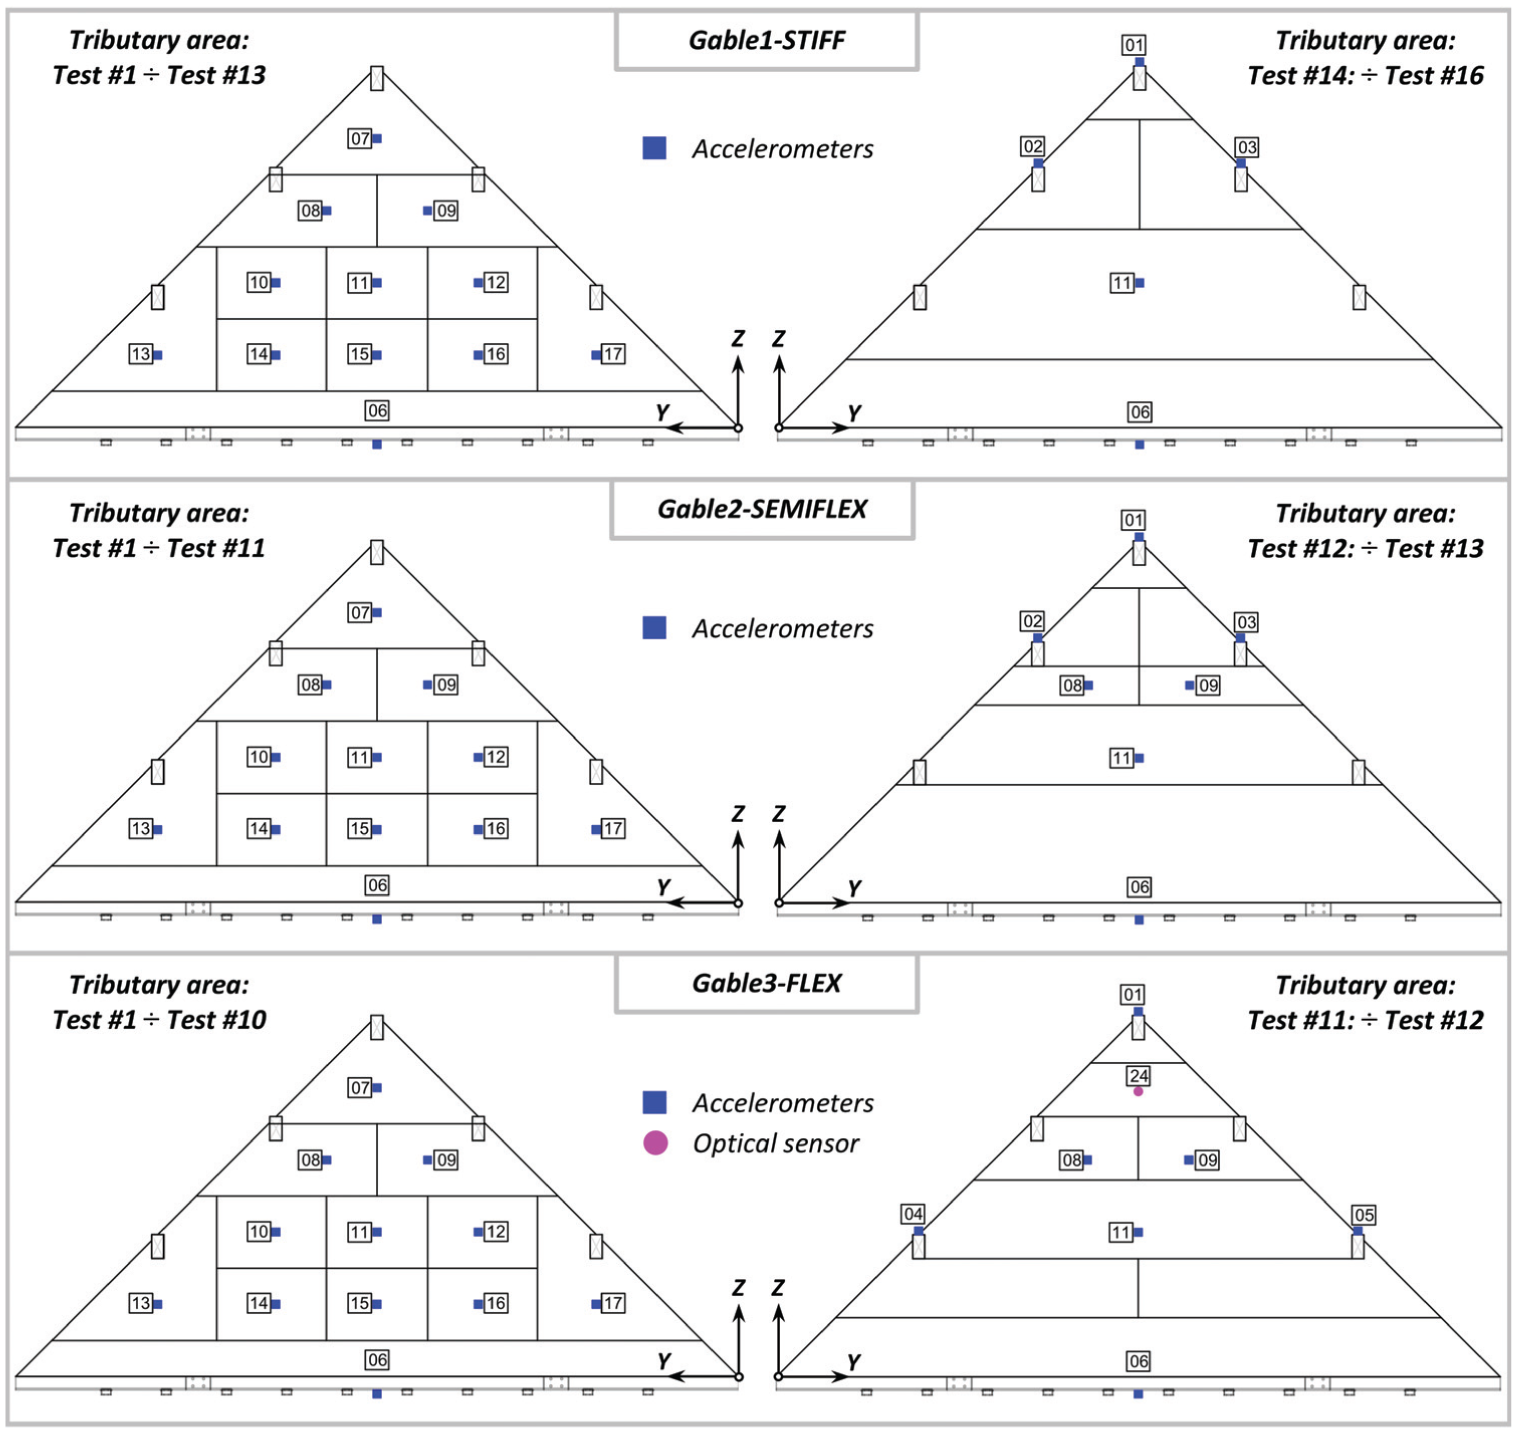
Tributary area/mass distribution used for calculating the inertial force for Gable1-STIFF, Gable2-SEMIFLEX, and Gable3-FLEX.
Data organization and illustrative examples
All data are available at https://doi.org/10.60756/euc-1avy7q49 and are provided in a ZIP archive together with a detailed technical report. The archive comprises two directories, “Videos” and “TXT,” each of which contains three subdirectories corresponding to the three tested gables. Within each subdirectory, the video files and .txt data files are named according to the specific run of the incremental dynamic testing sequence (see Table 1). Their file names reflect the run number in the testing sequence, the motion used and the associated scaling factor. The following are specific examples of how to interpret a .txt in the experimental dataset:
Instrument No. 1 (Figure 3) is an accelerometer (ACC), stored in columns 2,3 and 4 (Table 2) of the .txt files measures accelerations on the ridge beam. It remained online and recorded every test of Gable1-STIFF.
Instrument No. 20 (Figure 3) is a wire potentiometer with 250 mm elongation (WP SHORT), stored in column 59 (Table 3) of the .txt files measures relative displacements between the instrumentation frame (Figure 2) and the upper part of the gable (X = 3000 mm, Z = 2400 mm).
Instrument No. 37 (Figure 3) is a traditional potentiometer (TP), stored in column 72 (Table 3) of the .txt files measures relative displacements between the ridge beam and the gable. It was offline (not recording) during Test #14, Test #15, and Test #16 (Table 2) for Gable1-STIFF.
Instruments No. 43 to 47 (Figure 3), stored in columns 78 to 82 (Table 3) of the .txt files, measure the displacements of the springs applying vertical force to the purlins. Negative displacements indicate an increase in the applied vertical force relative to the target vertical load on the purlins. Positive displacements indicate a reduction in vertical force relative to the target vertical load.
Concluding remarks
This dataset provides comprehensive experimental data from incremental dynamic shake-table tests on three full-scale unreinforced masonry (URM) gables, offering valuable insights into their out-of-plane seismic response. The dataset includes measured and computed quantities, such as accelerations, displacements, inertial forces, and control point displacements, recorded until complete collapse. The instrumentation strategy, along with adjustments made based on damage progression, ensures high-quality data suitable for benchmarking numerical models and refining seismic assessment guidelines. To support users in interpreting the dataset, illustrative examples are provided, detailing specific instrument readings and their significance within the experimental setup. In addition, videos of each test are available in the dataset, offering a visual reference for the observed structural response throughout the testing sequence. The dataset is openly available for download from the Built Environment Data database at https://doi.org/10.60756/euc-1avy7q49.
Footnotes
Declaration of conflicting interests
The author(s) declared no potential conflicts of interest with respect to the research, authorship, and/or publication of this article.
Funding
The author(s) disclosed receipt of the following financial support for the research, authorship, and/or publication of this article: The work presented in the present report is part of the transnational access project “ERIES-SUPREME,” supported by the Engineering Research Infrastructures for European Synergies (ERIES) project (![]() ), which has received funding from the European Union’s Horizon Europe Framework Programme under Grant Agreement No. 101058684. This is ERIES publication number D6. Additional funding beyond the scope of ERIES was provided by the Ministry of Economic Affairs and Climate (Ministerie van Economische Zaken, EZK) through the Netherlands Organisation for Applied Scientific Research (TNO), under contract number 3100404105 “Wandenaanpak/TU Delft.”
), which has received funding from the European Union’s Horizon Europe Framework Programme under Grant Agreement No. 101058684. This is ERIES publication number D6. Additional funding beyond the scope of ERIES was provided by the Ministry of Economic Affairs and Climate (Ministerie van Economische Zaken, EZK) through the Netherlands Organisation for Applied Scientific Research (TNO), under contract number 3100404105 “Wandenaanpak/TU Delft.”
Data availability statement
Supplemental material
Supplemental material for this article is available online.